Strait of Hormuz Traffic Is Rising Again: How to Verify a Maritime Recovery

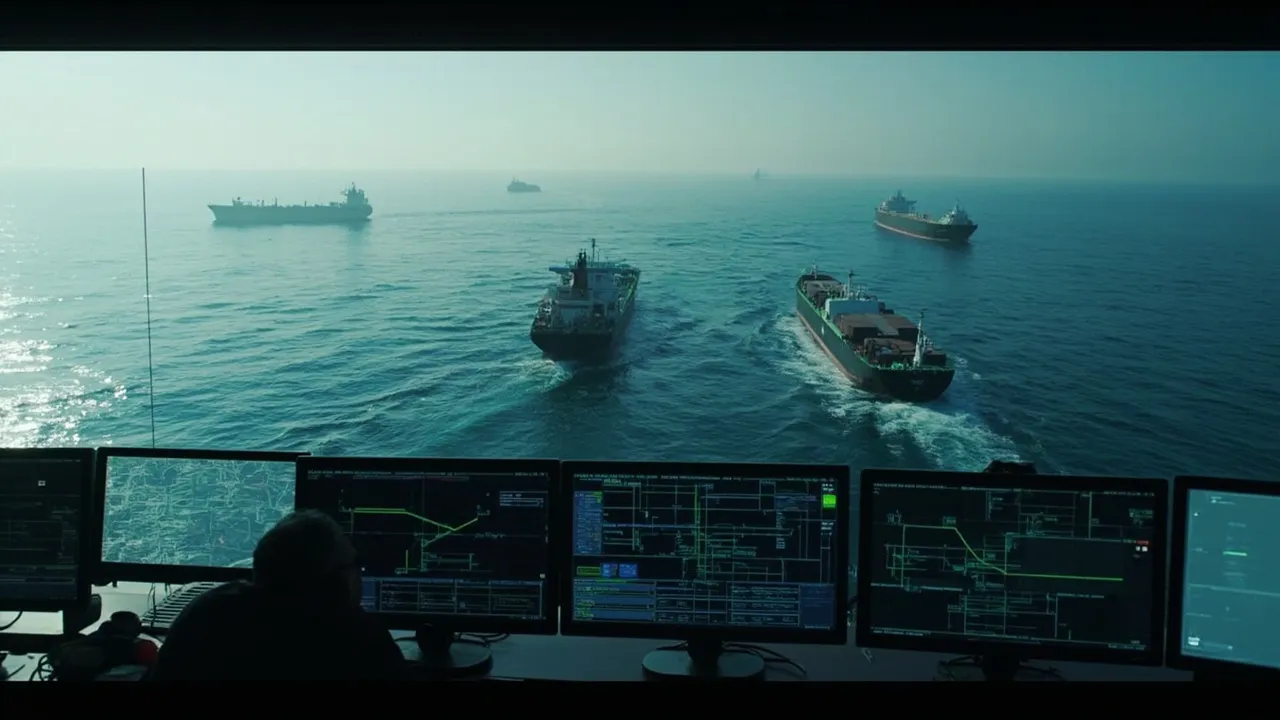
A rising vessel count in the Strait of Hormuz is encouraging. It is not, by itself, proof that maritime operations have normalized.
That distinction matters for importers, exporters, and freight forwarders deciding when to restore routing guides, release contingency inventory, or unwind expensive alternatives. A few more ships can cross while capacity remains constrained, war-risk premiums stay elevated, schedules remain unreliable, and major operators continue to limit exposure.
Recent data demonstrates the problem. Reuters reported a slight rise in traffic after the disruption. Yet follow-on preliminary data showed how volatile the signal remained: seven commodity vessels transited on one Thursday, down from 17 the previous day and below a 10-day moving average of about 15. A one-day increase can disappear just as quickly.
The right question is not “Are ships moving?” It is “Has the corridor recovered enough to support our required service, cost, and risk levels?”
Why vessel counts can mislead
Headline counts compress very different operations into one number. A product tanker, LNG carrier, bulk vessel, and container ship do not provide interchangeable capacity. Direction also matters: a ship entering the Gulf does not necessarily restore export capacity for the cargo, port, or sailing week a shipper needs.
Counts can also be distorted by vessels clearing a backlog. A temporary surge may represent delayed ships moving in a narrow security window rather than the return of predictable daily service. Conversely, fewer crossings on one day may reflect normal bunching, not renewed deterioration.
The commercial impact can be much larger than the vessel share suggests. FreightWaves estimated that annual container traffic through the strait represents only 2% to 3% of global container volume, while estimates for roughly 100 container vessels stranded in the Persian Gulf ranged from 1% to as much as 10% of effective capacity. Network position, vessel cycles, and missed rotations amplify the disruption.
Use a four-part recovery test
Logistics teams should combine four signals instead of treating AIS dots as the verdict.
1. AIS movement and traffic composition
Track a seven-day rolling average of completed crossings in both directions. Break movements down by vessel class, operator, and destination port. Compare the result with three baselines: the pre-disruption norm, the worst disruption week, and the most recent 10-day average.
Look beyond the centerline crossing. Measure anchorage time, speed changes, loitering, route deviations, and AIS gaps. A vessel that crosses but spends several extra days waiting has restored movement, not service.
A useful operational threshold is at least 80% of the pre-disruption seven-day average for 10 consecutive days, with no single day below 60%. The exact percentage should reflect the shipper's tolerance, but persistence is essential.
2. War-risk insurance and operating surcharges
Insurance prices translate geopolitical risk into a commercial signal. FreightWaves reported war-risk premiums reaching 33 times normal levels during the crisis. If crossings rise while premiums remain near crisis levels, underwriters are still pricing a substantial probability of loss.
Monitor quoted premiums, exclusions, deductibles, coverage availability, and the validity period of each quote. Also capture carrier war-risk surcharges. A lower surcharge without broader coverage can create false confidence.
For routing-guide restoration, require premiums and surcharges to decline for at least two consecutive renewal cycles. They do not need to return fully to the old baseline, but they should be stable enough for landed-cost planning.
3. Port calls and schedule performance
Count completed calls at the specific origin and destination ports in your network. Then measure berth waiting time, blank sailings, rolled bookings, and actual-versus-planned transit time.
Recovery should mean more than a ship appearing offshore. Establish thresholds such as:
- At least 85% of planned port calls completed over two consecutive weeks
- Median transit time within 15% of the pre-disruption baseline
- No more than 10% of confirmed bookings rolled to a later sailing
- Berth and anchorage dwell trending down for seven consecutive days
These measures expose a corridor that is open physically but still unstable operationally.
4. Carrier advisories and booking behavior
Carrier notices should be classified, not merely collected. Separate statements about physical passage, new booking acceptance, schedule reinstatement, surcharge changes, and force-majeure status. One operator resuming limited transits is not equivalent to broad market normalization.
Verify that at least two viable operators are accepting the required equipment type and commodity on comparable terms. Request written confirmation of routing, transshipment points, free-time rules, and contingency clauses. Quoted space should count only when a booking is confirmed and the sailing operates.
Set decision gates before the pressure arrives
Create three recovery states: constrained, provisional, and normalized.
In the constrained state, keep alternate routings active, preserve priority inventory, and use executive approval for high-risk transits. Move to provisional only when traffic persistence, insurance trends, port performance, and carrier acceptance all meet their minimum thresholds. During this stage, return a limited share of volume—perhaps 25% to 40%—and watch actual performance.
Release contingency inventory in tranches rather than all at once. The first tranche can move when two consecutive sailings complete within the agreed tolerance. Release the balance only after the corridor sustains the target metrics for another two weeks.
Declare normalized service only when performance is consistent across several sailing cycles and exception rates have returned close to baseline. FreightWaves noted that insurers and underwriters could require as long as six months after hostilities end to clear ship operations. Physical access and commercial confidence recover on different clocks.
Build one shared recovery dashboard
The strongest process combines AIS feeds, carrier communications, insurance quotes, port events, bookings, and shipment milestones in a single control view. Each signal needs an owner, update frequency, baseline, threshold, and escalation rule. Without that discipline, teams tend to select whichever indicator supports the decision they already prefer.
CXTMS gives freight teams a common operating layer for routing, shipment milestones, exceptions, carrier communications, and performance analysis. That makes it easier to test whether a maritime corridor is truly ready for volume—not merely busier than yesterday.
Request a CXTMS demo to build resilient routing and exception workflows around your global freight network.