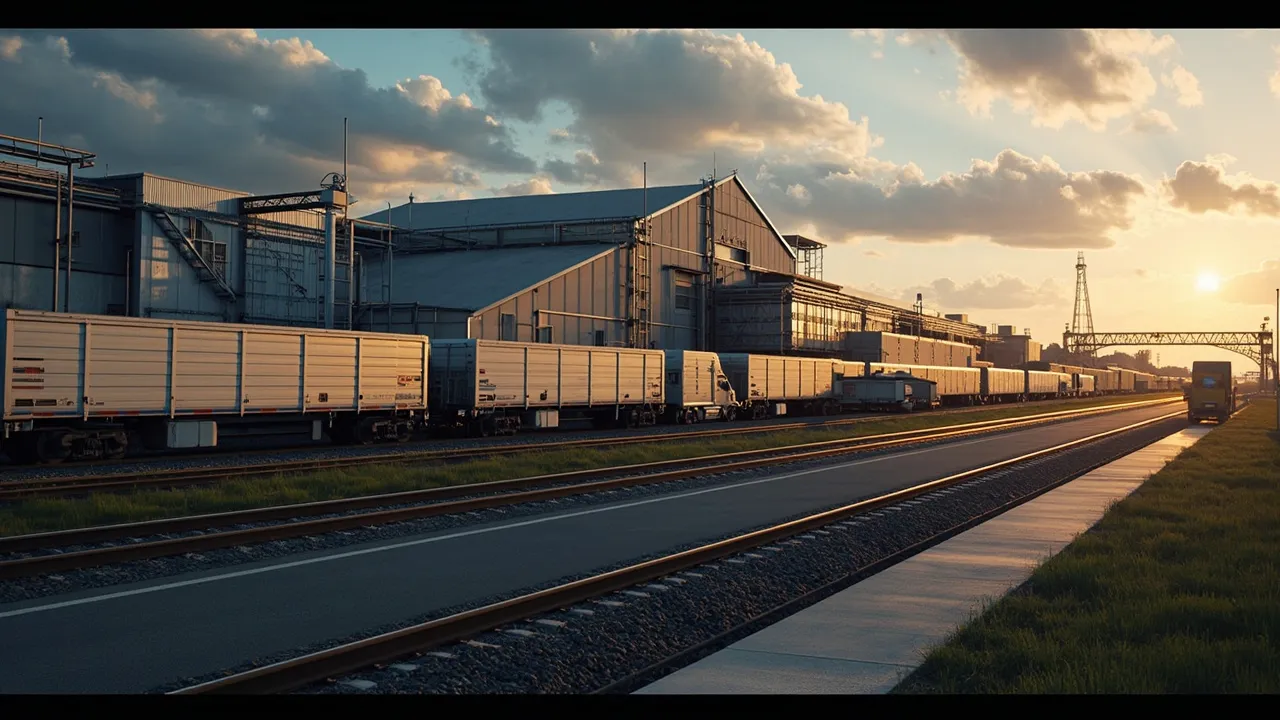
Walmart's $1.3 Billion Georgia Fulfillment Center: Planning the Inbound Capacity Ramp

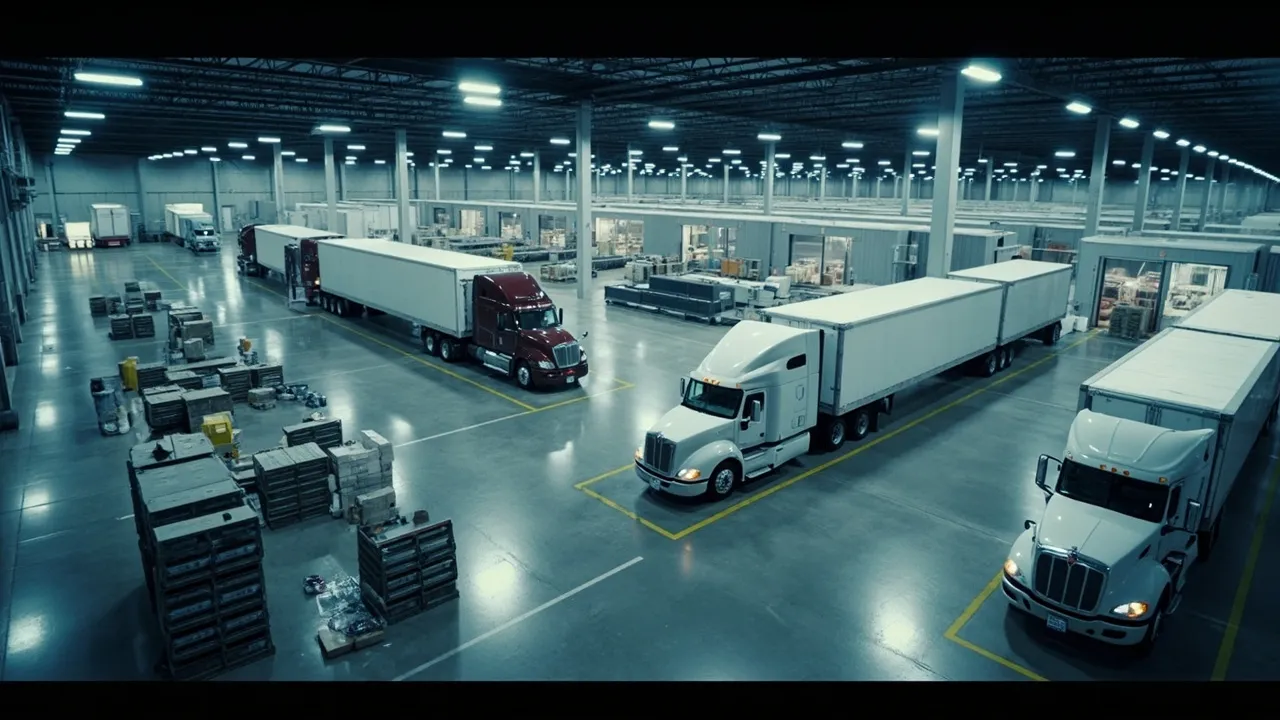
Walmart's planned fulfillment center in Georgia is enormous by almost any measure: a $1.3 billion investment, approximately 1.5 million square feet, and a target of 1,000 new jobs. Yet the number logistics teams should watch most closely is not the building's size. It is the rate at which freight will enter the site during startup.
According to Supply Chain Dive, the next-generation facility represents one of the largest private investments in Georgia's history. A site of that scale will alter supplier routing, carrier demand, trailer pools, appointment patterns, and inventory positions across the surrounding network. If those changes arrive faster than the operation can absorb them, a highly automated building can still develop very human problems: yard congestion, missed appointments, dock imbalances, and inventory stranded in the wrong node.
The launch plan therefore needs to treat inbound capacity as a controlled ramp, not a switch that gets flipped on opening day.
Start with flows, not square footage
A 1.5-million-square-foot footprint says little about daily receiving capacity by itself. Planners need to translate the building design into operating constraints: receiving doors by commodity class, unload minutes per trailer, available receiving labor by shift, putaway capacity, automation induction rates, pallet and case storage, and the maximum trailer count the yard can safely hold.
Automation raises the stakes. SupplyChainBrain reports that Walmart's next-generation fulfillment centers can double storage capacity, make up to 10 times more SKUs available, and improve productivity by more than 50%. Those gains are powerful, but they depend on synchronized input. A receiving surge that overwhelms induction or putaway simply moves the queue from the dock into the building.
Build the ramp model in weekly increments. For each week, forecast inbound purchase orders, pallets, cases, trailers, live unloads, drop trailers, and appointment hours. Then compare demand with three separate capacity ceilings:
- Yard capacity: usable parking positions minus safety buffers, maintenance holds, and outbound requirements.
- Dock capacity: doors multiplied by productive hours, adjusted for commodity-specific unload times and schedule variability.
- Interior capacity: the rate at which freight can be identified, inducted, put away, and made available for orders.
The lowest of the three is the true inbound limit.
Phase suppliers and carriers deliberately
Not every supplier should transition at once. Segment inbound lanes by volume, variability, handling complexity, lead time, and recovery options. Stable, high-volume suppliers with strong advance shipment notice performance are good early candidates because they give teams enough freight to test throughput without introducing excessive exceptions.
Fragile, hazardous, oversized, import-dependent, or promotion-sensitive products should enter later waves. So should suppliers with unreliable label quality or purchase-order accuracy. The goal is to isolate problems while the launch team still has time and physical space to respond.
Carrier plans need the same discipline. Assign expected weekly loads by origin region and carrier, then confirm tractor availability, drop-trailer commitments, driver detention rules, and weekend coverage. A carrier acceptance is not the same as operational readiness. Require named dispatch contacts, escalation paths, geofencing tests, and proof that drivers have the correct gate instructions before the first tender.
This matters because Walmart's broader automation program is already substantial. A separate Supply Chain Dive analysis reported that about 60% of U.S. stores receive at least some freight from automated distribution centers and roughly half of e-commerce fulfillment-center volume is automated. The Georgia launch is joining a live network, so its carrier and inventory changes must be coordinated with existing nodes rather than planned in isolation.
Protect the yard before volume arrives
Yard failures often begin days before dock performance deteriorates. Trailer dwell grows, empty equipment is not removed, exceptions occupy parking spaces, and hostlers spend more time searching than moving.
Create a yard plan with zones for loaded inbound trailers, empties, rejected freight, priority moves, and outbound staging. Reserve a contingency buffer instead of scheduling every position. During early waves, set tighter controls for dwell and require action before a trailer crosses its limit. The transportation management system should connect appointments, arrival events, trailer identity, door assignments, and detention exposure in one record.
Appointment capacity also needs shaping. Avoid filling every early-morning slot while leaving afternoons underused. Offer suppliers defined scheduling windows based on transit reliability and unloading profile. High-variance lanes need wider buffers; predictable regional shuttles can use narrower windows. Measure both on-time arrival and on-time door assignment so carrier performance is not confused with site congestion.
Migrate inventory without starving nearby nodes
Inventory cutover is a balancing act. Moving too slowly leaves the new building underutilized. Moving too quickly can drain incumbent facilities before the Georgia site has proven that inventory is receivable, locatable, and available to promise.
Run dual-node coverage during each migration wave. Set minimum days of supply at the legacy node, cap the percentage of an item's inventory sent to Georgia, and establish rollback rules. Promotional and high-velocity SKUs need especially conservative cutovers because a short receiving delay can quickly become an order-service problem.
The essential data set includes purchase-order status, shipment-level ETA, SKU velocity, inventory by node, receiving exceptions, putaway aging, order demand, and available-to-promise status. Reconcile physical and system inventory daily during launch. Automation can accelerate product flow, but it cannot compensate for incorrect item masters, labels, dimensions, or routing instructions.
Use a launch scorecard that triggers action
A useful scorecard is short enough to review every shift and precise enough to change decisions. Track:
- Appointment fill rate and arrival punctuality
- Gate-to-door and door-to-release time
- Trailers in yard versus safe capacity
- Dock utilization by shift and commodity
- Unload rate and putaway aging
- Advance shipment notice and label accuracy
- Inventory received but unavailable for orders
- Carrier tender acceptance, detention, and rejected loads
- Order fill rate for migrated SKUs
Set green, amber, and red thresholds before startup. An amber result should slow the next supplier wave; a red result should pause it. That prevents launch optimism from overruling operational evidence.
Walmart's Georgia investment illustrates a broader lesson for every shipper opening an automated facility: capital creates potential capacity, but synchronized transportation and inventory decisions convert it into usable throughput. The winners will be the teams that make each ramp step measurable, reversible, and visible across suppliers, carriers, yards, docks, and downstream orders.
Planning a new distribution node or a major volume cutover? Request a CXTMS demo to see how centralized appointments, shipment visibility, carrier workflows, and exception management can support a controlled capacity ramp.