Ocean Freight Rates
Ocean freight rates are among the most significant costs in international supply chains, and they are also among the most complex. A single shipment's total cost comprises a base freight charge plus a stack of surcharges covering fuel, terminal handling, seasonal demand, security, and more. Rates can vary dramatically between trade lanes, seasons, and even weeks — the same container moving on the same route might cost $1,500 one month and $8,000 the next during a capacity crunch.
Understanding how rates are composed, quoted, and negotiated is essential for any logistics professional managing ocean freight budgets.
Base Freight Rate Models
Ocean freight is priced differently depending on whether cargo fills an entire container or shares space with other shipments.
FCL (Full Container Load)
FCL rates are quoted per container, typically by equipment size:
| Equipment | Standard Notation | Typical Use |
|---|---|---|
| 20-foot standard | 20'GP or 1 TEU | Heavy cargo, raw materials |
| 40-foot standard | 40'GP or 2 TEU | General merchandise, consumer goods |
| 40-foot high cube | 40'HC | Voluminous but lighter cargo |
| 45-foot high cube | 45'HC | High-volume retail shipments (less common) |
An FCL rate is charged regardless of whether the container is fully loaded or half-empty — you pay for the box, not the cargo weight (though carriers may impose a maximum payload limit).
LCL (Less than Container Load)
LCL rates are quoted per volume or weight unit, typically in revenue tons:
- 1 revenue ton = 1 cubic meter (CBM) or 1,000 kg, whichever yields the higher charge.
- A shipment of 3 CBM weighing 500 kg would be charged at 3 revenue tons (volume wins).
- A shipment of 2 CBM weighing 4,000 kg would be charged at 4 revenue tons (weight wins).
LCL shipments are consolidated by freight forwarders or NVOCCs (Non-Vessel Operating Common Carriers) into shared containers at a Container Freight Station (CFS).
All-in rates vs. itemized rates: Some carriers and forwarders quote an "all-in" rate that bundles the base freight and all surcharges into a single number. Others itemize each component separately. Always clarify what is and isn't included when comparing quotes — an apparently cheap base rate may become expensive once surcharges are added.
Common Surcharges
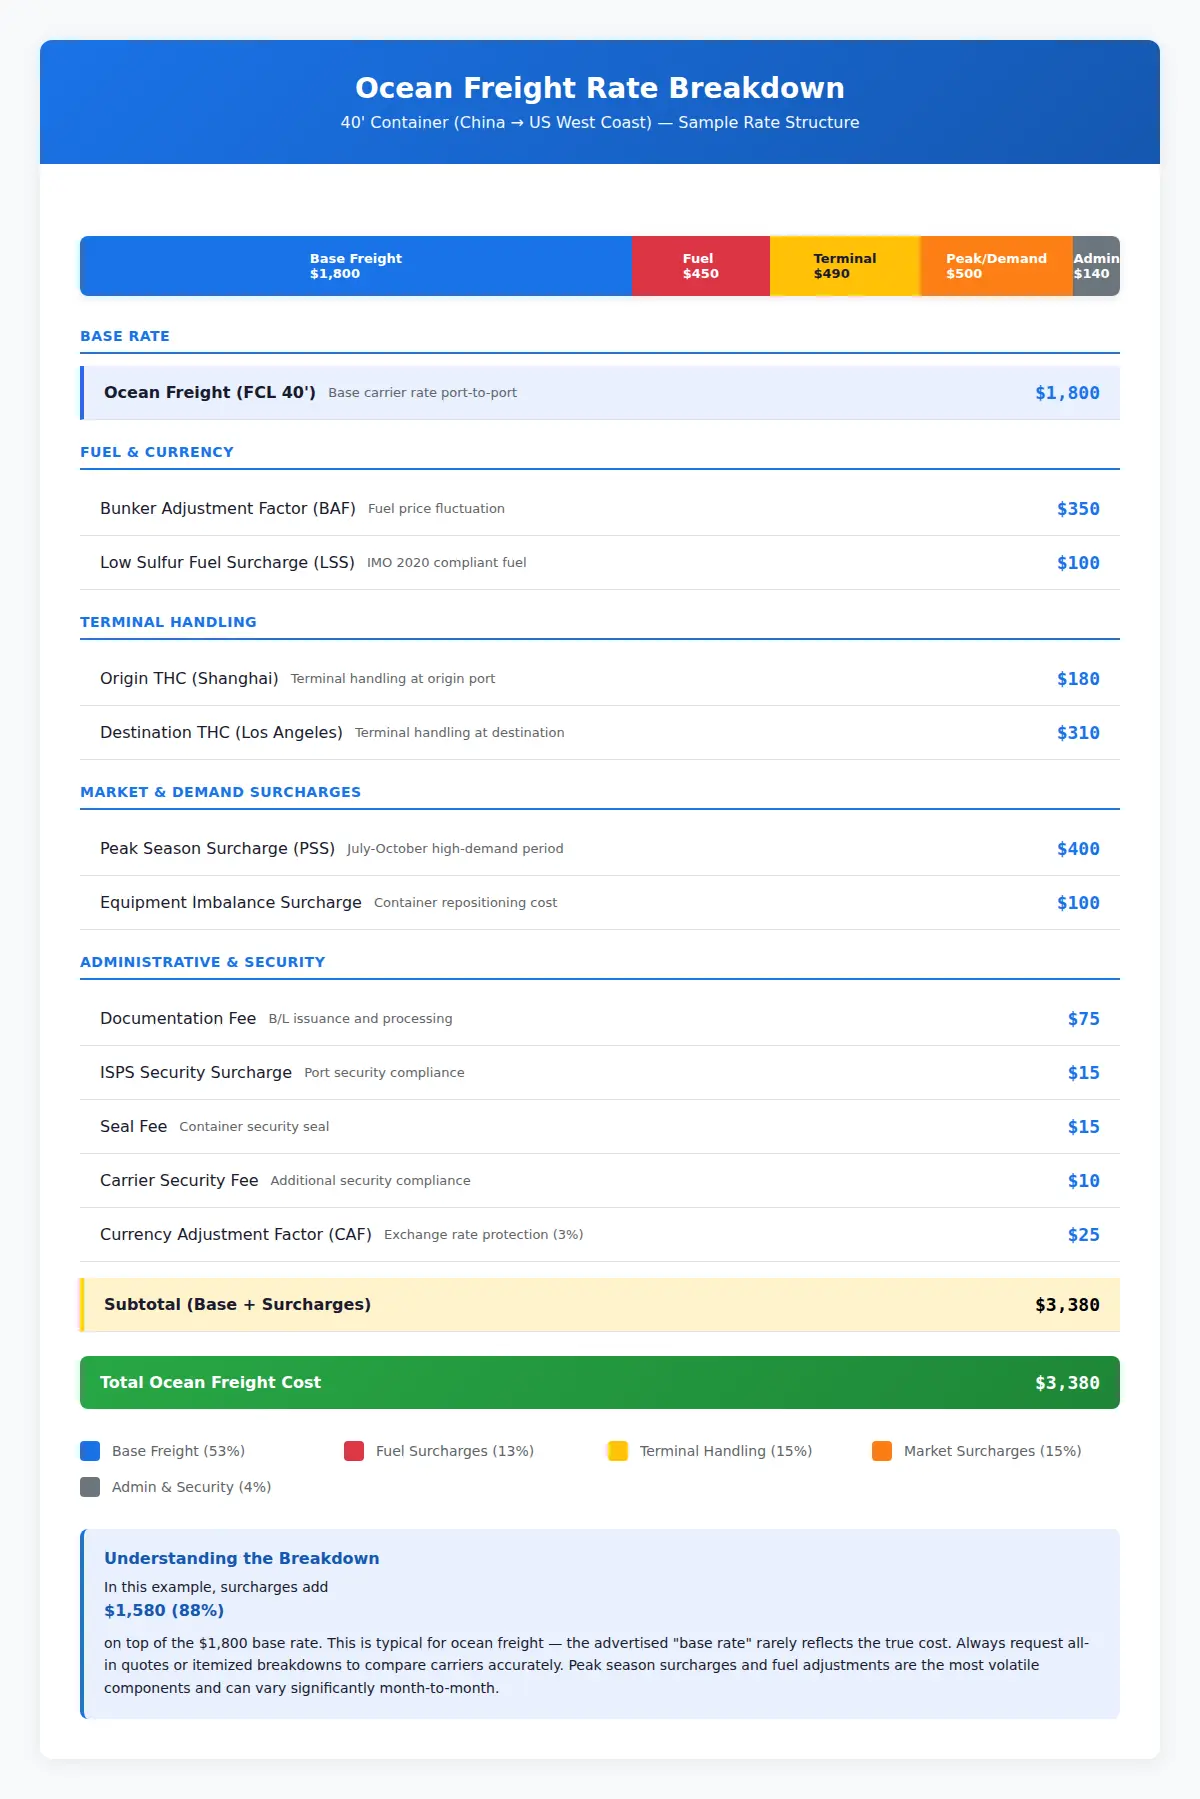
Surcharges can add 30–60% on top of the base freight rate. Understanding what each charge covers helps shippers evaluate quotes accurately and identify areas for negotiation.
| Surcharge | Abbreviation | What It Covers | Typical Range (per 40') |
|---|---|---|---|
| Bunker Adjustment Factor | BAF / BUC / EBS | Fluctuations in marine fuel (bunker) prices. Recalculated monthly or quarterly based on fuel indices | $200–$800 |
| Low Sulfur Fuel Surcharge | LSS / LSF | Additional cost of compliant low-sulfur fuel under IMO 2020 regulations | $150–$300 |
| Currency Adjustment Factor | CAF | Protects the carrier against exchange rate fluctuations between the rate currency and the carrier's cost currency | 2–8% of freight |
| Terminal Handling Charge | THC | Cost of handling the container at origin and destination terminals — crane lifts, yard movements, gate processing | $100–$400 per end |
| Peak Season Surcharge | PSS / PCS | Applied during high-demand periods (typically July–October for Asia-to-West routes ahead of retail season) | $200–$1,000 |
| Port Congestion Surcharge | PCS / CCS | Applied when specific ports experience delays and vessel waiting times increase | $100–$500 |
| War Risk Surcharge | WRS | Applied for transit through high-risk areas (e.g., Gulf of Aden, Red Sea) | $50–$500+ |
| ISPS Security Surcharge | ISPS | Covers costs of compliance with the International Ship and Port Facility Security Code | $5–$15 per container |
| Carrier Security Fee | CSF | Additional carrier-imposed security compliance cost (U.S. and EU trade lanes) | $5–$15 per container |
| Documentation Fee | DOC / BL Fee | Cost of issuing the Bill of Lading and related documentation | $25–$75 per shipment |
| Seal Fee | — | Cost of the security seal applied to the container | $10–$20 |
| Equipment Imbalance Surcharge | EIS / EBS | Covers the cost of repositioning empty containers when trade imbalances leave equipment in the wrong location | $50–$300 |
Contract Rates vs Spot Rates
Ocean freight pricing falls into two broad categories: contract rates negotiated for a fixed period, and spot rates priced per booking at current market levels.
Contract Rates (Service Contracts)
A service contract is an agreement between a shipper (or forwarder/NVOCC) and a carrier, typically covering:
- Duration: 1 year (most common, often aligned with May 1 – April 30 on trans-Pacific trades), though 6-month and multi-year contracts exist.
- Minimum Quantity Commitment (MQC): The shipper commits to tendering a minimum volume (e.g., 500 TEU/year). Failure to meet MQC may result in penalties or rate adjustments.
- Named trade lanes: Rates are specified for each origin-destination pair.
- Rate levels: Typically lower than spot rates in exchange for the volume guarantee and predictability.
- Space and equipment guarantees: Carriers may guarantee equipment availability and vessel space for contract customers.
Many large shippers use a split strategy — committing 60–80% of their volume under contract and leaving 20–40% for the spot market. This provides budget stability while retaining flexibility to capitalize when spot rates drop below contract levels.
Spot Rates
Spot rates reflect current market conditions and are priced per booking, valid for a single shipment. They are:
- Highly volatile — can change weekly or even daily during market disruptions.
- No volume commitment required.
- No guaranteed space — during peak season, spot bookings may be rolled (delayed to the next vessel).
- Best suited for occasional shippers, overflow volumes, or when market rates are significantly below contract levels.
When Each Makes Sense
| Factor | Contract Rate | Spot Rate |
|---|---|---|
| Volume | 1,000+ TEU/year on a lane | Occasional or unpredictable shipments |
| Budget certainty | High — fixed rate for the term | Low — rates change with market |
| Space guarantee | Usually included | None — risk of being rolled |
| Price in rising market | Advantage (locked low) | Disadvantage (paying market peak) |
| Price in falling market | Disadvantage (locked high) | Advantage (pay current low rates) |
Factors That Drive Rate Fluctuations
Ocean freight rates are driven by a complex interplay of supply and demand factors:
Supply-side factors
- Fleet capacity — The total number of vessels and their TEU capacity. Newbuild deliveries increase supply; scrapping and slow-steaming reduce effective capacity.
- Blank sailings — Carriers cancel (blank) scheduled voyages to reduce capacity and support rates during periods of low demand.
- Alliance structure — The three major carrier alliances (2M, THE Alliance, Ocean Alliance — restructuring in 2025) coordinate vessel sharing, which concentrates market power.
- Port congestion — When vessels queue at congested ports, effective capacity decreases as ships spend more time waiting and less time sailing.
Demand-side factors
- Seasonal patterns — Peak shipping seasons (pre-Chinese New Year inventory build, pre-holiday season July–October) drive rate spikes.
- Economic cycles — Consumer demand, GDP growth, and retail inventory levels all influence cargo volumes.
- Trade imbalances — Westbound trans-Pacific (Asia → North America) rates are typically much higher than eastbound rates because of the volume asymmetry. The same applies to Asia → Europe vs. Europe → Asia.
- Geopolitical events — Trade wars, canal disruptions (Suez, Panama), sanctions, and regional conflicts can rapidly reshape trade patterns and rates.
Fuel prices
- Bunker fuel is one of the largest operating costs for carriers. A single large container vessel may consume 150–300 tons of fuel per day. When fuel prices spike, carriers pass costs through via BAF surcharges.
Rate Negotiation Strategies
Shippers and freight forwarders can take several practical steps to secure favorable ocean freight rates:
- Consolidate volume — Aggregate shipments across divisions, subsidiaries, or clients to present larger volumes to carriers. Higher MQC = better rates.
- Multi-carrier strategy — Solicit quotes from at least 3–4 carriers per trade lane. Competition drives better pricing.
- Time your negotiations — Contract negotiations on the trans-Pacific trade typically happen February–April for May 1 start dates. Approach carriers when the market favors buyers (surplus capacity, low utilization).
- Offer flexibility — Carriers value shippers who can flex on sailing dates, accept alternative port pairs, or ship during off-peak windows. Flexibility often earns rate discounts.
- Build relationships — Carriers reward loyalty. Consistent volume over multiple contract years, reliable booking forecasts, and minimal no-shows build trust that translates to priority space and better rates.
- Monitor indices — Track published rate indices (Drewry WCI, Freightos FBX, Shanghai SCFI) to understand market direction and time your spot purchases.
- Negotiate surcharge caps — While base rates get the most attention, surcharges can be negotiated too. Request caps on BAF, or negotiate all-in rates that eliminate surcharge variability.
Focusing only on the base freight rate while ignoring surcharges and origin/destination charges is one of the most common procurement errors. A seemingly low base rate with uncapped surcharges and high THC can easily exceed a slightly higher all-in quote.
Resources
| Resource | Description | Link |
|---|---|---|
| Drewry World Container Index (WCI) | Weekly composite ocean freight rate index across major trade lanes | drewry.co.uk/supply-chain-advisors/supply-chain-expertise/world-container-index |
| Freightos Baltic Index (FBX) | Daily and weekly container freight rate benchmarks | fbx.freightos.com |
| Shanghai Shipping Exchange (SCFI) | Shanghai Containerized Freight Index — key benchmark for Asia-origin rates | en.sse.net.cn |
| Xeneta | Ocean freight rate intelligence platform with contract and spot data | xeneta.com |
| FMC Service Contract Filing | U.S. Federal Maritime Commission's SERVCON system for reviewing filed service contracts | fmc.gov |
Related Topics
- Incoterms — trade terms that determine who pays the freight charges
- Bill of Lading — the document that accompanies rated shipments
- Demurrage & Detention — additional charges beyond freight rates
- Quoting & Rating — how freight forwarders build customer quotes from carrier rates