Rail Volumes Are Sending Mixed Signals: Carloads Edge Up While Domestic Intermodal Carries the Growth


Rail freight looks healthy if you only read the headline number. It looks more cautious if you separate carloads from intermodal. It looks even more complicated if you split intermodal into ISO containers, domestic containers, and trailers.
That is the useful lesson in the latest rail data. The market is not flashing one clean signal. It is showing a mixed operating picture: modest commodity-driven carload growth, stronger weekly intermodal activity, and a deeper split between import-linked international containers and domestic equipment.
For shippers and forwarders, that matters because rail is often treated as a single demand indicator. It is not. A steel carload, a grain carload, an ISO container moving inland from a port, and a domestic 53-foot box competing with truckload capacity all say different things about the economy. Planning teams that blend them into one number risk overreacting to the wrong signal.
The weekly AAR signal: carloads up, intermodal stronger
According to Logistics Management's coverage of Association of American Railroads data, U.S. rail carloads reached 230,497 for the week ending May 16, up 0.6% year over year. That is growth, but barely. It also sat slightly above the prior week’s 229,592 carloads and below the week ending May 2 at 235,049.
The commodity mix tells the better story. Seven of the ten carload commodity groups AAR tracks posted annual gains. Grain rose by 2,066 carloads to 23,173. Metallic ores and metals increased by 1,044 carloads to 22,450. Petroleum and petroleum products gained 1,004 carloads to 11,278. Those are industrial and bulk-market signals, not broad consumer freight signals.
The declining categories matter too. Coal fell by 3,667 carloads to 55,302. Miscellaneous carloads declined by 634 to 9,658, and nonmetallic minerals slipped by 136 to 32,515. So the carload market is not simply expanding across the board. It is rotating by commodity.
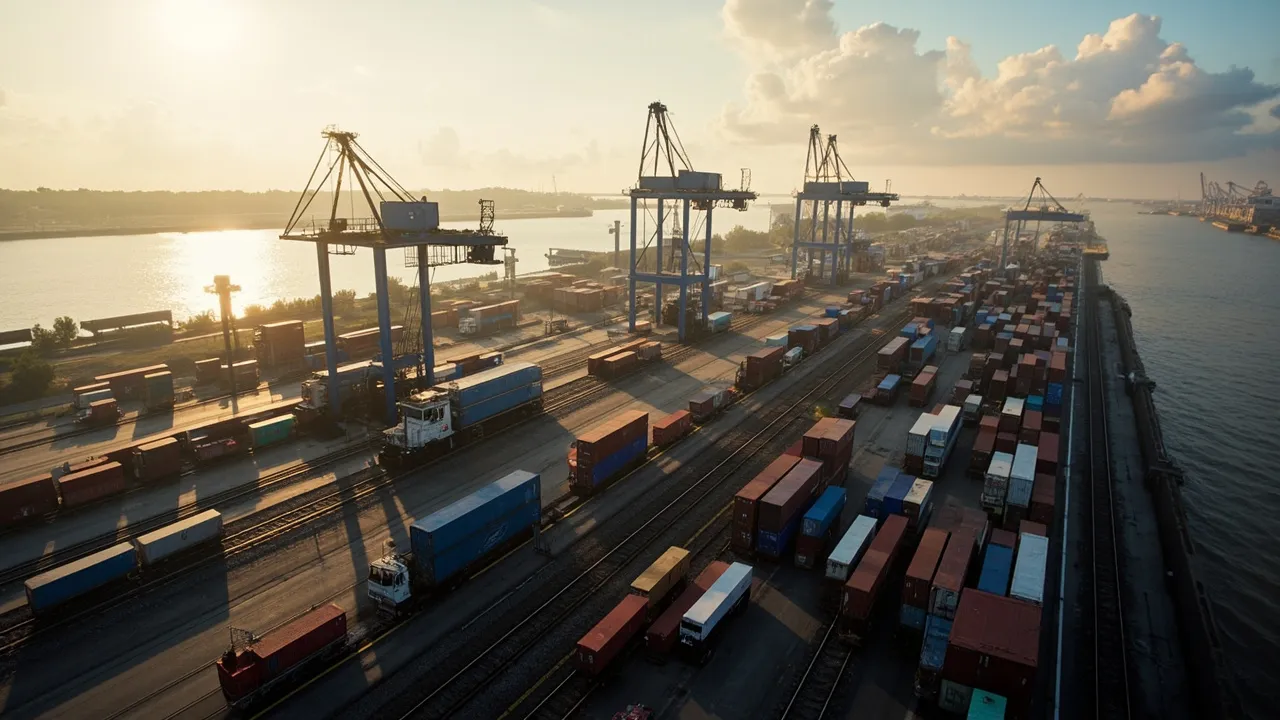
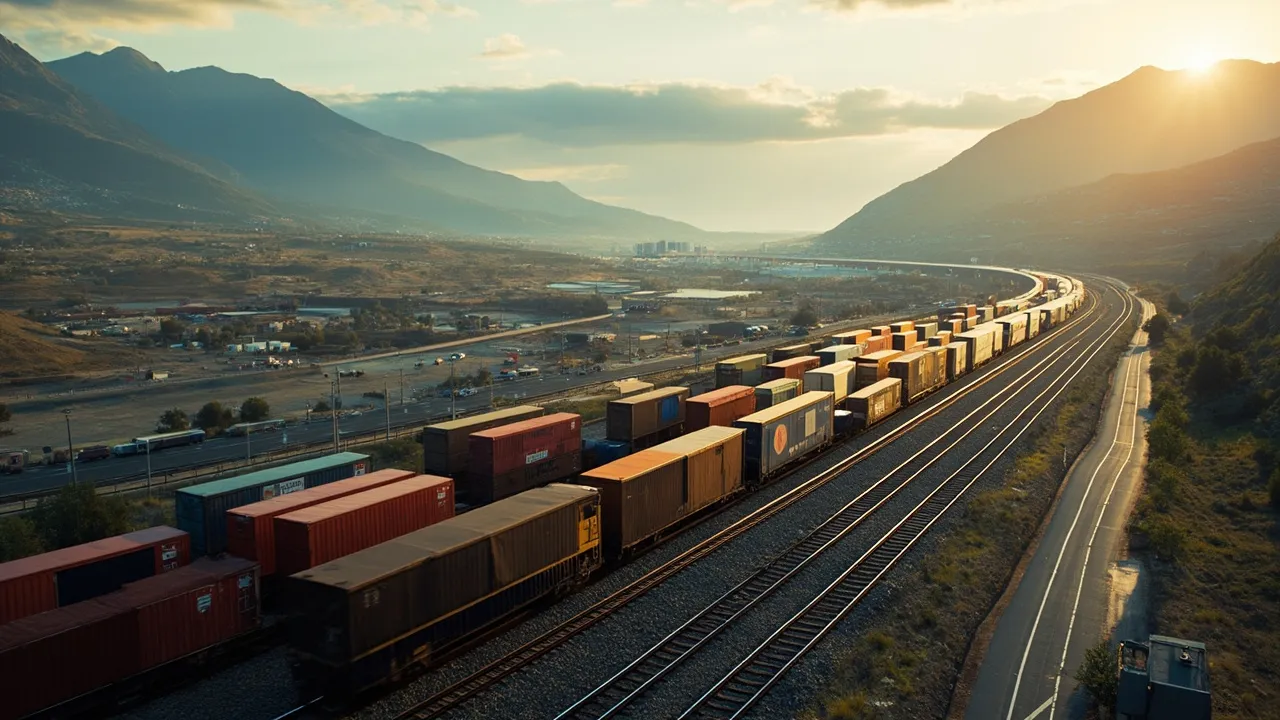
Intermodal looked stronger on the same weekly read. AAR reported 280,719 intermodal containers and trailers for the week ending May 16, up 7.3% annually. Through the first 19 weeks of 2026, U.S. rail carloads totaled 4,297,732, up 3.4%, while intermodal units reached 5,262,810, up 0.9%.
That spread is important. Weekly intermodal strength can make the rail network feel more active, but year-to-date intermodal growth remains much softer than the single-week figure suggests.
The April IANA signal: domestic strength hid ISO weakness
The Intermodal Association of North America data adds the missing context. Logistics Management reported that April intermodal volume totaled 1,568,662 units, down 0.6% year over year. That followed March volume of 1,606,602 units and marked a cooler reading after earlier monthly gains.
The headline decline was small, but the segment split was not. ISO, or international, containers fell 6.4% year over year to 762,874. Domestic containers rose 8.6% to 767,703. Trailers increased 1.9% to 38,085. Combined domestic equipment reached 805,788 units, up 8.2%.
That is the real story: domestic intermodal carried the growth while international containers weakened. A planner looking only at total intermodal could call the market flat. A port-linked importer would see softness. A domestic truckload procurement team might see rail becoming more relevant, especially if highway capacity tightens or fuel volatility changes the rail-versus-truck math.
Year-to-date IANA data shows the same split. Through April, total intermodal volume was 6,106,740 units, down 0.1%. Domestic containers were up 5.1% to 2,957,463, trailers were down 2.1% to 152,139, and ISO containers were down 4.7% to 2,997,138.
In plain English: intermodal is not weak everywhere. It is bifurcated.
Why the split matters for freight forecasting
Rail data often gets pulled into budget reviews as a macro signal. That is fine as a starting point, but dangerous as a planning shortcut. The latest numbers point to at least four separate questions.
First, are bulk commodity lanes improving because demand is rising, because inventories are repositioning, or because specific industrial sectors are moving differently? Grain, metals, petroleum, coal, and minerals have different rate cycles and equipment requirements.
Second, is domestic intermodal gaining because shippers are actively converting truckload freight, or because certain long-haul lanes are temporarily more attractive? Domestic container growth can reflect better rail service, fuel pressure, truck capacity attrition, contract strategy, or inventory positioning.
Third, is ISO container weakness a port and import-demand signal, a tariff-timing signal, or a routing change? A decline in international containers does not automatically mean domestic distribution is slowing. It may mean inbound ocean flows are uneven, delayed, or rerouted.
Fourth, are trailers telling a different story than domestic containers? Trailer-on-flatcar remains a small slice compared with containers, but the difference matters for shippers with equipment constraints, expedited needs, or legacy rail programs.
What shippers should do now
The practical response is not to rewrite the whole transportation plan. It is to make rail forecasting more granular.
Separate commodity carloads from intermodal in internal dashboards. Then split intermodal into ISO containers, domestic containers, and trailers. Map each segment to the lanes, customers, and inventory flows it actually influences. A consumer goods importer should not treat domestic intermodal gains as proof that port-linked flows are recovering. A manufacturer moving long-haul domestic freight should not ignore domestic container growth just because total intermodal was slightly negative in April.
Procurement teams should also test scenarios before bids lock in. If domestic intermodal keeps growing while truck capacity tightens, rail options may deserve more volume commitments on stable long-haul lanes. If ISO weakness persists, drayage, transload, and inland rail schedules may need different assumptions. If commodity carload growth continues in grain, metals, and petroleum, capacity around certain corridors could tighten even while other rail categories remain soft.
This is exactly where a transportation management system has to be more than a tendering tool. CXTMS helps freight teams connect lane history, carrier performance, mode options, shipment status, and exception workflows in one operating view. That makes it easier to see whether a rail signal should change procurement, routing guides, customer promises, or inventory buffers.
The rail market is not sending a simple bullish or bearish message. It is sending a segmented one. The winners will be the teams that read the segments before the averages blur them.
If your team wants to model rail, truckload, and intermodal decisions with cleaner execution data, schedule a CXTMS demo and see how transportation visibility can become practical mode-planning intelligence.