Emerging Trends in Logistics Technology: A 2026 Retrospective

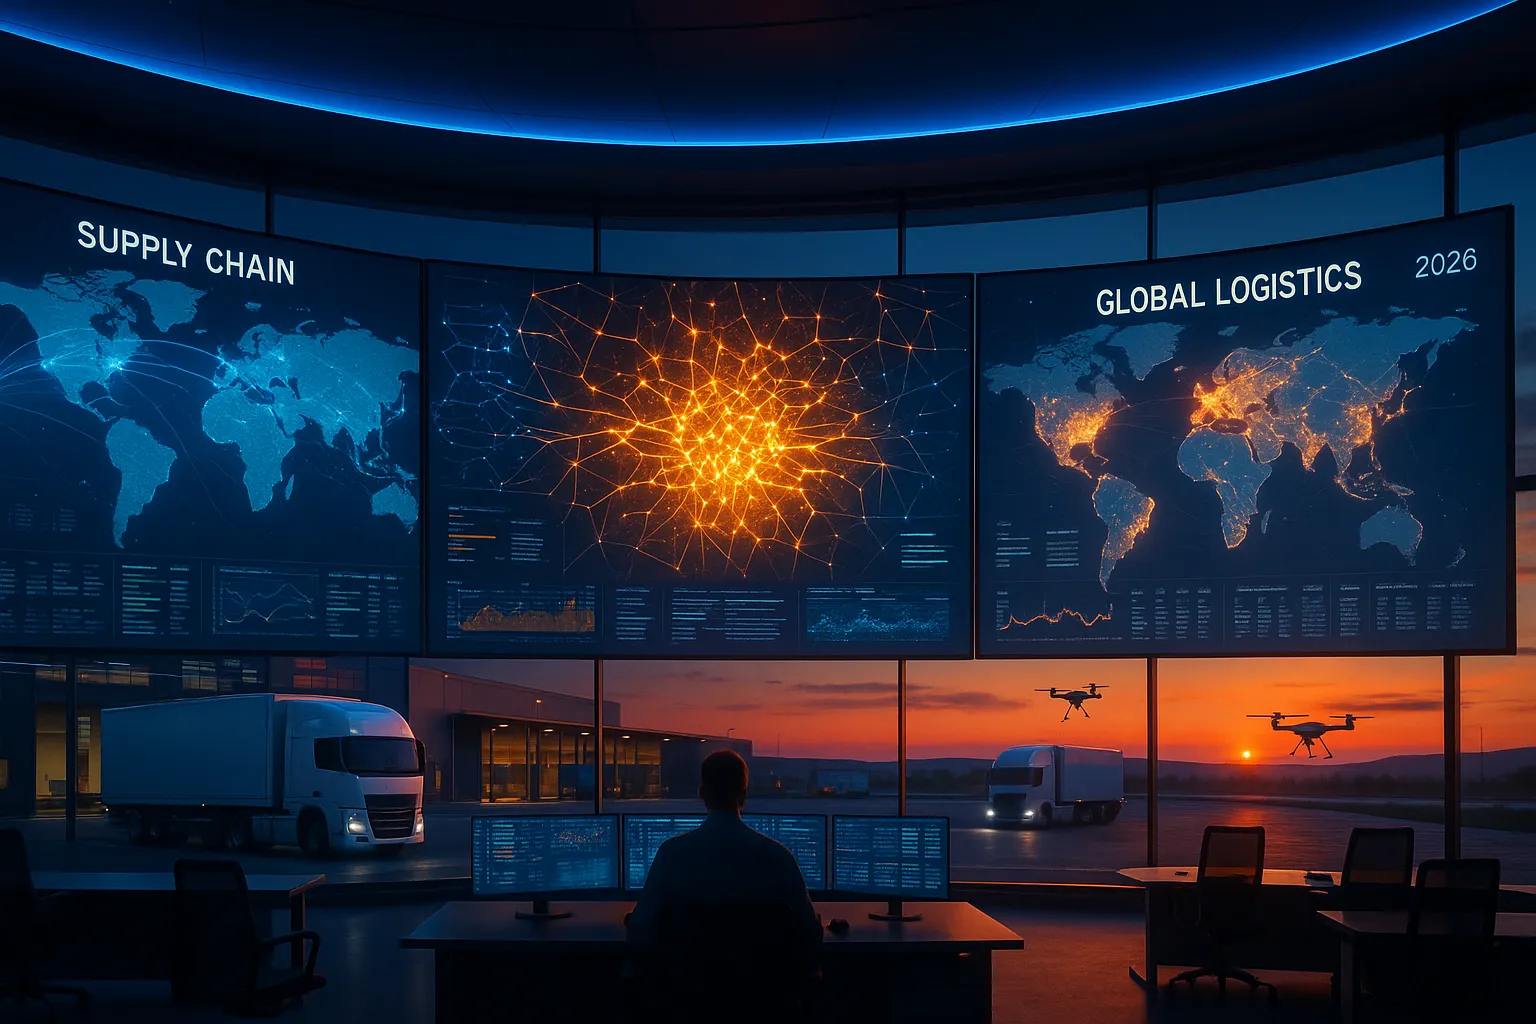
2026 was the year logistics technology stopped auditioning and started running the operation. Across freight, warehousing, trade compliance, and supply chain planning, the biggest winners were not the companies with the flashiest pilots. They were the ones that connected AI, automation, visibility, and workflow execution into systems that actually changed cost, speed, and resilience.
That pattern shows up all across this year's CXTMS coverage. AI moved into narrow, high-value workflows like freight audit, classification, routing, forecasting, tendering, and exception handling. Warehouse automation matured from isolated robots into orchestrated fleets, middleware, machine vision, and adaptable infrastructure. Visibility shifted from track-and-trace dashboards to decision systems fed by IoT, APIs, real-time edge capture, and predictive analytics. At the same time, tariff pressure, geopolitical shocks, labor constraints, and carrier consolidation forced operators to treat technology as operating infrastructure, not digital decoration. Recent analysis from McKinsey and Gartner reinforces the same point: the highest returns are coming from tightly integrated execution workflows, not isolated tech experiments.
Executive Summary
One hundred and four themes defined logistics technology in 2026:
- AI became operational, not experimental. The most valuable deployments were tightly scoped: freight audit, inventory optimization, route selection, demand sensing, customs processing, carrier pricing, and planning.
- Automation capital flooded into the warehouse. Funding, deployment scale, and robotics performance all pointed in one direction: physical operations are becoming software-coordinated systems.
- Visibility matured into execution intelligence. Sensors, APIs, and real-time data capture mattered when they changed routing, labor, or exception decisions, not when they just filled a dashboard.
- Distributed fulfillment became a software orchestration problem. Retailers proved they could unlock faster service by turning stores and local nodes into fulfillment assets when order logic was smart enough.
- Resilience became a technology use case. Tariff modeling, corridor-level design, FTZ strategy, and multimodal planning moved from strategy decks into live workflows.
- Infrastructure got smarter before it got bigger. Operators increasingly looked for hidden capacity through better data sharing, simulation, and orchestration before opening another site or adding more metal.
- Consolidation increased the value of independent data layers. As 3PLs, carriers, and software providers combined, shippers gained more leverage from open APIs, benchmarking, and configurable workflow control.
- Operational basics became strategic again. Packaging, accessorial governance, warehouse design, cyber resilience, and fuel-sensitive routing stopped being back-office details and started shaping margin and service directly.
- Open logistics networks became a new competitive axis. Amazon and UPS both showed that parcel and fulfillment strategy is moving toward portfolio orchestration across private assets, postal handoffs, and externalized platform capacity.
- Operational identity data became a bottleneck. SKU codes, pallet stamps, return disposition records, smart-safe signals, parcel dimensions, and temperature/cash-chain evidence increasingly determined whether automation could act cleanly.
- Facility, carrier, and energy context became planning data. May coverage made the point impossible to miss: renewable electricity claims, inland-port optionality, roadside enforcement grants, truck-stop safety, and fuel-index thresholds now belong in the same decision layer as rates and transit times.
- Security, customs, and physical-flow constraints became execution-system problems. Late-May coverage showed cargo theft, Mexico MVE errors, intermodal split signals, AMR fleet scaling, heavy-haul transformer shortages, and air-cargo shocks all require live workflow controls rather than after-the-fact reporting.
- Execution control expanded into finance, labor, and marketplace governance. May 29 coverage connected active caching, parcel partnerships, freight-spend controls, marketplace product safety, workforce orchestration, supplier quality, autonomous trucking, stockpiling, and rail consolidation into one theme: logistics technology now has to coordinate decisions across inventory, people, carriers, compliance, and cash.
- Fulfillment, rail, and refund data became scorecard infrastructure. May 30 coverage showed e-commerce network redesign, WMS cost leakage, ocean contract delays, procurement AI pilots, OETA/ISP rail reporting, dual-sourced SKU optionality, upstream retail holding capacity, tariff refunds, Mexico air capacity, and 30-minute store fulfillment all depend on cleaner operational evidence.
- Trade proof, fuel exposure, and social traceability moved into live execution. May 31 coverage connected diesel volatility, Taiwan tariff caps, Vietnam Section 301 risk, USMCA rules of origin, food-waste planning, and product-level social impact traceability into one conclusion: freight systems now need proof trails before cost, compliance, or service risk appears.
- Execution records became the control tower baseline. June 1 coverage connected Amazon's externalized logistics network, secure data platforms, clinical trial cold-chain risk, labor continuity, aerospace supplier recovery, critical-minerals chain of custody, and AI ROI discipline into one operating rule: logistics technology has to preserve the trusted record of what changed, who owns it, what it costs, and what proof moves with the freight.
- Capacity signals moved upstream of the freight tender. June 2 coverage showed inland-port rail grants, supplier exits, parcel labor peace, green-yard proof, heavy air cargo, manufacturing PMI, next-day retail facilities, trucking credit metrics, and USPS spending controls all pointing to the same rule: logistics teams need to read production, labor, cash, infrastructure, and sustainability signals before capacity turns visible in rates.
- Execution governance became the June operating theme. June 4 coverage connected 3PL relationship governance, brownfield warehouse modernization, cold-chain map refreshes, forced-labor origin proof, daily freight intelligence, mainstream robotics adoption, Q2 brokerage pricing, steel/aluminum tariff documentation, summer load-density pressure, and automation integration into one rule: technology value now depends on whether evidence, ownership, and exception playbooks live inside execution workflows.
- Interface commoditization pushed advantage into execution control. June 5 coverage connected AI-generated logistics software interfaces, SMB shipping-platform consolidation, data-center flatbed demand, Great Plains fulfillment, India last-mile density, Japan value-added 3PLs, grocery traceability, RFID packaging, Port Houston truck flow, and Latin American automation into one operating rule: the visible screen matters less than the trusted data, integrated workflow, and physical-capacity discipline underneath it.
- Capacity discipline became evidence discipline. June 6 coverage connected agentic AI readiness, capacity tightening, deferred truck maintenance, multi-carrier parcel networks, ocean peak-season surcharges, perishable inventory visibility, rare earth export controls, and UPS Healthcare's acquisition strategy into one rule: rate, service, compliance, and shelf-life decisions now need documented triggers before the exception hits.
- Planning compression exposed governance gaps. June 7 coverage connected AI optimization cycles shrinking from weeks to hours, April LMI cost pressure, same-day LTL, weather-driven operating strain, facility expansion, grant readiness, truck-air network design, service-parts specialization, WMS labor relief, and WTO trade deceleration into one rule: faster planning only creates value when budgets, capacity triggers, inventory timing, infrastructure evidence, and execution owners move just as fast.
- Promise accuracy and operating-budget discipline became technology requirements. June 8 coverage connected alternative parcel AI, Amazon seller handling-time rules, retail delivery reliability, AutoZone mega hubs, Starbucks AI rollback, Walmart AI usage caps, warehouse technician constraints, weight-data governance, and labor turnover into one rule: logistics technology now has to prove reliability, govern cost, and preserve operational confidence before it scales.
- Supplier, packaging, fuel, and dimension data became live logistics constraints. June 9 coverage connected EU supplier-diversification rules, containerboard production resets, India road freight growth, Port Houston breakbulk capacity, procurement AI readiness, Russia sanctions exposure, U.S.-China tariff scenario planning, Vietnam export growth, Wayfair product dimensions, and Yang Ming LNG bunkering into one rule: logistics systems now need to carry origin, package, route, fuel, compliance, and equipment context before freight plans are executable.
- Parcel, cloud TMS, and ocean-risk controls moved into portfolio governance. June 10 coverage connected accessorial recovery limits, AI forecast-replenishment math, Amazon opening its logistics network, cloud TMS growth, freight-forwarder consolidation, multi-carrier parcel routing, ocean peak-season surcharges, and Hormuz war-risk premiums into one rule: transportation platforms must govern carrier portfolios, cost exposure, and disruption choices in real time.
- Digital freight systems became market-specific execution infrastructure. June 11 coverage connected API-native brokerage, ASEAN value-added fulfillment, cross-docking, customs brokerage constraints, fleet management growth, freight layoffs, auditable green freight, project drayage, on-prem control, and smart-container pre-clearance into one rule: logistics technology has to match the geography, regulation, asset class, and timing pressure of each lane.
- Regional growth turned visibility into paperwork, workforce, and corridor discipline. June 12 coverage connected Argentina and Canada freight growth, China cross-border ecommerce paperwork, real-time freight audit RFPs, supply-driven rate recovery, frontline AI upskilling, MEA corridor resilience, Mexico lane control, Saudi bonded-zone parcel speed, and World Cup delivery scheduling into one rule: expansion markets reward operators that can prove status, documents, labor readiness, and exception ownership before freight is late.
- Identity, API discipline, and origin proof became automation prerequisites. June 14 coverage connected deceptive pickup fraud, ETA-triggered compliance workflows, blockchain exception records, driver-first freight apps, freight order tags, load-board APIs, Japan-U.S. port optionality, local-content rules, and truckload-to-LTL downshifts into one rule: automation only scales when the system can prove who is acting, which data controls the decision, where the shipment qualifies, and when mode changes protect the budget.
- Planning slack became the scarce resource. June 15 coverage connected carrier costing, grocery traceability, India cold chain growth, stale network assumptions, May LMI pressure, pallet sourcing, peak-season frontloading, rail intermodal gains, software supply-chain risk, and warehouse process debt into one rule: logistics teams need live cost, risk, inventory, and process evidence before yesterday's network assumptions turn into tomorrow's margin leak.
- Execution readiness moved into role-based data, workforce design, and route economics. June 16 coverage connected continuous-improvement freight AI, defense demand-supply alignment, packaging safety controls, franchise playbooks, rail asset visibility, upstream fuel taxes, maritime labor risk, guided warehouse workflows, regional EV economics, and DOT role-based data into one rule: logistics technology has to prove who sees what, which process owns the next action, and whether the lane, workforce, package, fuel window, or asset record can support the promise.
- Execution control moved closer to ports, stores, plants, and importer identity. June 17 coverage connected Adani Ports' AI terminal software, AI-server component shortages, importer-of-record enforcement, EU farm-cost transparency, Grocery Outlet's AI ordering, highway-bill corridor reliability, industrial robot rebound, Kimberly-Clark simplification, SCaaS build-versus-buy economics, and Tractor Supply rural routing into one rule: logistics systems now need to govern physical flow, identity proof, cost evidence, and local decision support at the point work actually happens.
- Adaptability became the measurable KPI. June 18 coverage connected AI-over-legacy TMS layers, medical-device distribution proximity, forced-labor evidence, Gulf Coast port optionality, Los Angeles import/export imbalance, CSCMP's State of Logistics cost benchmark, and West Coast labor automation risk into one rule: supply chains now need systems that can interpret volatility, preserve proof, and shift execution before static plans break.
- Risk ownership moved into everyday logistics work. June 19 coverage connected animal-welfare governance, AI procurement compression, grocery inflation, committed freight marketplaces, constraint-based planning, circular logistics, fuel surcharge exposure, fertilizer timing, logistics-manager responsibility, and sanctions sense-making into one rule: logistics teams now have to govern supplier risk, working capital, cost exposure, and regulatory ambiguity as live execution workflows.
- Execution systems had to prove adaptability in the physical network. June 20 coverage connected UPS parcel AI, Gartner's AI workforce signal, GNC warehouse drones, Long Beach electric drayage, CPKC rail optionality, FedEx-China Southern air cargo, Walmart brownfield automation, retail demand sensing, committed freight brokerage, and humanoid robotics into one rule: logistics technology now has to convert volatility into executable decisions across parcels, people, ports, warehouses, air lanes, rail nodes, and capital plans.
- Measurement moved from reports into operating triggers. June 21 coverage connected AI barcode scanning, air-freight spot rates, BNSF's Barstow intermodal project, Burlington sortation, FRA automated track inspection, hazmat language compliance, LTL scorecards, Cass cost-per-shipment pressure, and WMS workaround mapping into one rule: logistics teams need measurable triggers for exceptions, mode shifts, infrastructure reliability, compliance exposure, and software readiness before cost or service failures become visible.
- Trust, proof, and fallback design became the automation governor. June 22 coverage connected accepted truckload-volume data, AI hallucination controls, autonomous middle-mile lanes, terminal-based CDL training, Class 8 safety sensors, tech-budget pressure, regional 3PL acquisitions, Hormuz fee exposure, data silos, and nuclear-verdict carrier qualification into one rule: faster systems need trusted signals, auditable decisions, and recovery paths before they earn operating authority.
- Production geography and origin proof became daily freight controls. June 23 coverage connected Harley-Davidson's U.S. production shift with U.K. deforestation evidence rules, showing that where products are made, which supplier evidence travels with them, and how origin proof survives each handoff now belong inside transportation execution rather than upstream strategy files.
- Optionality became a governed asset, not a backup plan. June 24 coverage connected segment-specific 3PL scorecards, premium logistics M&A, apparel labor-risk proof, pharma trade-policy exposure, rail telecom resilience, ISM demand triggers, inventory placement, and Mexico corridor optionality into one operating rule: shippers need to know which provider, lane, document, inventory buffer, and alternate route is executable before disruption forces the decision.
- Execution accountability moved into handoffs, assets, and vendor evidence. June 25 coverage connected air-maintenance capacity risk, cold-chain cross-dock accountability, WMS cutover revenue exposure, Roadcheck compliance behavior, PFAS chain of custody, vendor cybersecurity evidence, pallet-level visibility, retail delivery promise math, procurement-supply chain integration, and Hormuz network recovery into one rule: logistics systems now have to prove who owns each handoff, asset, data connection, promise, and recovery decision before volatility reaches the customer.
- Cost, identity, and dock-flow signals became planning variables. June 26 coverage connected first-mile consolidation, LTL rate timing, detention telemetry, carrier-vetting evidence, parcel trailer unloading robots, interest-rate pressure, importer-of-record controls, warehouse rents, nuclear long-lead procurement, and retail contract optionality into one rule: logistics teams need financial, legal, facility, supplier, and dock-door signals inside execution systems before shipment plans can be trusted.
- Data quality became the operating license for specialized logistics. June 27 coverage connected AI customs enforcement, tariff refunds, USPS dimensional pricing, apparel environmental taxes, vertical LTL service design, vendor distress, port-capacity pauses, quantum-readiness planning, inventory reductions, and trade-deficit signals into one rule: logistics systems now need broker-ready entries, package dimensions, product attributes, provider health, gateway optionality, and constraint data before execution can scale safely.
- Consent, interoperability, and liability became logistics data controls. June 28 coverage connected ELD-linked insurance underwriting, reefer fuel-tax evidence, forwarder export-control liability, driver biometric consent, FMCSA paperless enforcement, grocery supplier flow control, commodity-cost translation, container data standards, AI data-center power logistics, and sanctions-aware marketplace fulfillment into one rule: operational data now has to satisfy insurers, regulators, carriers, platforms, finance teams, and trading partners at the same time.
- Routing guides and carrier portfolios became stress-test objects. July coverage showed dry van spot pressure, DHL-USPS allocation, Maersk rail shifts, and parcel status normalization all pointing to the same rule: freight teams need trigger-based portfolio controls before carrier failure becomes a customer failure.
- Sustainability, tariffs, and product proof became shipment-level ledgers. Carbon-data validation, forced-labor public records, tariff effective dates, McCormick's refund, sustainable packaging, Class 9 batteries, and life-sciences quality events all showed that compliance evidence now has to travel with the freight record.
- Frontline work, warehouse exceptions, and energy dispatch became operating data. July posts on frontline worker technology, connected lift-truck batteries, warehouse exception taxonomies, robotics task evidence, intralogistics M&A, and electric fleet charging showed that automation only scales when physical work produces structured evidence.
- AI infrastructure and industrial freight became strategic chokepoints. Capital goods imports, utility outage-critical freight, AI data center buildouts, aerospace supplier capacity, project logistics, and power-equipment constraints moved specialized freight from occasional exception work into board-level capacity planning.
- Execution feedback became the test of logistics technology. July 13 coverage connected AI-enabled freight fraud, item-level shipment verification, cross-border ecommerce promises, warehouse closures, automotive plant launches, service-parts planning, bulky retail cost-to-serve, and fuel-cost controls into one rule: logistics systems need closed-loop proof from planning through dock, carrier, customs, delivery, and margin.
- Capacity constraints became more granular and more local. July 14 coverage connected AI hardware air-cargo premiums, June's 71.1 LMI reading, Mexico driver shortages, Rhine water levels, Detroit-Windsor crossing optionality, high-altitude damage risk, and warehouse robotics dock constraints into one rule: logistics systems need lane-level trigger records before capacity, labor, infrastructure, or physical-handling limits turn into customer failure.
- Decision governance became the proof layer for orchestration. July 15 coverage connected tariff-date calendars, IANA's intermodal volume signal, renewable safe-harbor project cargo, electrical component origin proof, Savannah drayage infrastructure, end-to-end 3PL event files, last-mile promise economics, import demand sensing, EDI trust, and software-selection proof into one rule: logistics technology now has to prove why each decision was made, which evidence controlled it, and what changed after execution.
- Peak-season, provenance, and rate pressure converged into one control problem. July 16 coverage connected TL/LTL rate highs, mid-sized shipper budget exposure, Amazon holiday fulfillment fees, cross-border ecommerce data quality, product provenance, sanctions/tariff uncertainty, smart conveyors, Transpacific air cargo, auto port choice, and public trend filtering into one rule: logistics systems need shipment-level proof, cost triggers, and exception owners before peak conditions amplify every weak record.
- Handoff governance became the operating layer for always-on logistics. July 17 coverage connected 4PL outcome ownership, rail merger data filings, diesel-emissions evidence, border-aware fulfillment, third-party cyber continuity, order-cycle-time timestamps, manufacturing labor readiness, construction material risk registers, and execution-technology handoff rules into one rule: every alert, partner, node, lane, vendor, and critical material needs an owner, threshold, fallback action, and audit record before systems can safely act.
- Control files became the practical bridge between volatility and execution. July 18 coverage connected semiconductor ramp inputs, packaging commodity exposure, ERP cutover data, food-brand acquisition playbooks, replenishment timing, tariff refunds, emissions reporting, supplier compliance evidence, Singapore hub optionality, and postal air contract rules into one operating lesson: each volatile input needs a live record that ties source data, owner, exception threshold, customer impact, and recovery path to the shipment plan.
- Live trigger discipline became the July 19 operating layer. July 19 coverage connected AI server chip constraints, China infrastructure acceleration, cold-storage energy accountability, elevated freight-rate calendars, Exotec automation support capacity, logistics technology handoffs, ocean bid windows, stronger LMI signals, trade-fraud evidence, and voice load search into one rule: every market signal, project milestone, procurement interaction, compliance proof point, and facility constraint needs a trigger, owner, and release rule before speed becomes risk.
- Outcome proof, evidence rules, and milestone files became the buyer mandate. July 20 coverage connected agentic AI software spend risk, ethanol-powered ocean optionality, fleet camera evidence rules, DDMRP transportation buffers, diesel allocation, finished-vehicle staging, retail supplier-change models, defense shipyard readiness, Saudi project logistics, and governed GenAI delivery answers into one rule: every technology, fuel pathway, vehicle unit, shipment answer, and project milestone needs proof of outcome before it deserves operating authority.
- Physical capacity signals became execution controls. July 21 coverage connected record Southern California port volumes, Prologis leasing, chemical-network regionalization, parcel discounts, reverse-logistics growth, air-cargo liability, dairy cyber risk, and 3PL scope into one rule: capacity is only useful when appointments, eligibility, compliance, recovery, and ownership rules travel with the shipment.
- Shared definitions became the prerequisite for multimodal and AI orchestration. July 22 coverage connected domain-specific language models, Mexico customs data, USMCA certification, store fulfillment, and ocean-carrier air investment into one rule: logistics systems need governed vocabulary, consistent shipment records, valid trade evidence, store-level execution data, and pre-approved mode-switch triggers before they can act reliably.
- Effective capacity became an eligibility-and-trigger problem. July 23 coverage connected inspection-ready dispatch, lane-level rail scorecards, Hormuz-avoiding gateways, chassis control, skilled-trades pipelines, label authority, same-day port diversion, fertilizer allocation, flood triggers, and smart-locker custody into one rule: an asset, lane, node, worker, or handoff only counts as capacity when its condition, permissions, timing, evidence, and fallback action are known.
- Reversible decisions became a control-system requirement. July 24 coverage connected voyage holds, floating LNG schedules, new-lane chain of custody, cross-dock reassignment, acquisition and facility concentration, canal bookings, pharmaceutical tariff gates, recall releases, and store-delivery eligibility into one rule: logistics systems must preserve the evidence behind a decision while making it safe to change that decision as conditions evolve.
- Constraint evidence became the admission ticket for freight execution. July 25 coverage connected semiconductor export authorization, conflict-driven container repositioning, PFAS packaging proof, independent LTL capacity, lithium-battery state of charge, warehouse heat exposure, critical-mineral reserves, circular-product state, and truck parking into one rule: a shipment is not executable until its legal, physical, human, and network constraints are validated against current evidence.
- Eligibility, measured capacity, and continuity became one execution discipline. July 26 coverage connected 3PL scorecards, alcohol licensing, autonomous yards, product-certificate eFiling, broker transparency, LNG dispatch, production-distribution separation, warehouse energy pilots, electronics capacity allocation, and multi-node fulfillment continuity into one rule: operational systems must validate who and what may move, measure the capacity actually available, and preserve a tested fallback when a node, provider, vehicle, or lane fails.
- Decision latency, qualification evidence, and financial signals converged at the physical edge. July 27 coverage connected carrier vetting, cold-chain handoffs, equipment finance, parcel peak fees, forced-labor tariffs, structural capacity barriers, provider distress, ocean procurement, edge orchestration, and supplier sprawl into one rule: logistics systems must shorten the time from signal to governed action without losing the evidence behind qualification, cost, compliance, and continuity decisions.
- Capability proof and escalation rules became the operating contract. July 28 coverage connected crossdock verification, rail-access terms, resilience stage gates, fuel-surcharge audits, parcel-network integration, food-plant intelligence, leadership baselines, SKU-level material allocation, 3PL transitions, and procurement escalation into one rule: a capability, investment, rate change, or recovery option has value only when its evidence, trigger, owner, and service outcome are explicit.
- Event quality became the boundary between insight and safe automation. July 29 coverage connected agentic AI, multi-tier component risk, tariff feeds, port appointments, carrier onboarding, delivery reliability, cold-chain co-loading, reusable assets, regional fulfillment, and sustainability traceability into one rule: technology may recommend or execute only when the underlying event, identity, eligibility, custody, and effective-date evidence is current enough to support the decision.
- Comparable economics and acceptance evidence became the scale gate. July 30 coverage connected AGV ROI, integrated warehouse testing, mixed-fleet telemetry, parcel fuel normalization, omnichannel returns, retail consolidation, commodity-level rail signals, carrier earnings, and freight margin bridges into one rule: technology and capacity choices should scale only after costs are normalized, operating constraints are tested, data remains portable, and shipment-level outcomes reconcile to service and profit.
- Continuity records became the control layer for organizational change. July 31 coverage connected AI value ledgers, private customs AI, automation ownership and rebranding, veteran credential mapping, yard sequencing, campaign capacity, cross-border rail milestones, and mode-level carrier economics into one rule: technology can scale through market, workforce, and vendor change only when identity, evidence, ownership, service, and financial outcomes remain attached to the operating record.
- Recovery clocks and qualification gates became execution controls. August 7 coverage connected autonomous-truck economics, food-withdrawal replenishment, digital quality release, equipment-specific truck capacity, aerospace backlog readiness, critical-mineral qualification, regional airfreight contingencies, tariff-refund settlement, rail mix shifts, and 24-hour store replenishment into one rule: a plan is not executable until its full cost, eligibility, evidence, owner, and recovery deadline are explicit.
- Continuity controls moved from contingency documents into shipment execution. August 8 coverage connected warehouse cyber recovery, soybean export release gates, border-capacity allocation, procurement value realization, retail migration criteria, ocean contract triggers, last-mile labor exposure, VIN-level export screening, port labor recovery, and remediation chain of custody into one rule: disrupted operations need offline records, explicit priorities, measurable gates, and auditable handoffs before capacity can safely restart.
- Eligibility records became financial and physical control infrastructure. August 9 coverage connected TMS migration, pre-dispatch compliance, expiring fuel-routing authority, project-logistics dependencies, polysilicon duties, tariff-refund claims, food-grade custody, cold-chain allocation, parcel pricing, and terminal expansion into one rule: logistics systems must prove that a party, asset, product, route, claim, or capacity option is eligible before releasing freight or assigning value.
- Capacity qualification became a multi-constraint operating discipline. August 10 coverage connected short-term air contracts, customs maker-checker controls, disaster-resource registries, forklift energy planning, retail cost-to-serve, Mexico border growth, gateway velocity, predictive conveyor maintenance, terminal technology debt, and purchase-order resets into one rule: visible capacity is not usable capacity until time, authority, energy, throughput, cost, and recovery conditions are proven.
- Calendars, provenance, and continuity tests became the September 4 control layer. September 4 coverage connected holiday parcel fee windows, new-facility pilots, import evidence, driver-training provenance, cartonization, logistics inflation, technology M&A, local fulfillment, event freight, and revised labor data into one rule: execution systems must attach effective dates, qualification evidence, total cost, ownership, and fallback paths to every operational decision.
- Confidence-adjusted capacity became the September 5 operating metric. September 5 coverage connected nominal container supply, schedule reliability, dry-bulk rates, staged production, fulfillment automation, AI inspection, forced-labor release gates, cold-chain custody, and long-term lane contracts into one rule: capacity and automation claims should be discounted by reliability, evidence quality, handoff readiness, and tested recovery paths before they authorize a shipment or capital decision.
- Operational continuity became a quantified, cross-functional control loop. September 6 coverage connected railcar retirement, Panama Canal delay economics, corridor inspections, predictive warehouse maintenance, forwarder acquisitions, cargo-gateway security, food-packaging release gates, supply chain leadership baselines, routing-guide resets, and UPS's global operating model into one rule: every disruption needs a measurable threshold, a named owner, a durable shipment record, and a tested recovery path.
- Portfolio allocation became the September 7 execution discipline. September 7 coverage connected AI-driven air-cargo premiums, brokerage growth controls, PMI signal decomposition, forced-labour release evidence, European energy exposure, fashion sourcing allocation, factory-ramp milestones, LNG port readiness, gateway-share shifts, and Baltic grain rerouting into one rule: operators must allocate freight, suppliers, capacity, and capital with explicit thresholds, verified constraints, and shipment-level evidence rather than headline averages.
- Decision clocks expanded into end-to-end promise governance. September 8-9 coverage connected tariff versions, routing-guide resets, food traceability, parcel-event normalization, cold-chain sensors, bulky-freight hubs, bunker-fuel allocation, store fulfillment, reshoring ramps, SKU rationalization, and yard moves into one rule: every service promise needs a current signal, an intervention threshold, a named owner, and proof that the action protected cost, compliance, and service.
- Operating authority became conditional on proof. September 14 coverage connected corridor design, dark-vessel confidence, franchise replenishment, technology-partner governance, robotics skills, rail remediation, parcel AI savings, and fertilizer allocation into one rule: a recommendation, asset, route, or partner should act only after the system validates readiness, evidence quality, economics, and fallback ownership.
The Core Technology Trends That Shaped 2026
1. AI shifted from copilots to closed-loop execution
The strongest AI stories of 2026 were not generic chat interfaces. They were domain-specific systems embedded inside freight workflows. C.H. Robinson's freight classification automation, AI-driven route optimization, predictive control towers, UPS's customs automation, and agentic audit workflows all pointed to the same conclusion: logistics AI works best when it is trained on operational context and allowed to trigger action, not just generate text.
That is why freight audit became one of the clearest ROI categories of the year. AI audit systems are now recovering 1% to 5% of total freight spend, catching invoice errors before payment, spotting repeat accessorial issues, and shortening dispute cycles from 90 to 120 days to same-week resolution in some workflows.
2. Warehouse automation became mainstream capital allocation
Warehouse robotics stopped looking like a niche innovation category and started looking like core infrastructure. Startups in warehouse automation captured more than $2.26 billion in Q1 2026 funding, while the U.S. warehouse robotics market was projected to grow from $29.98 billion in 2025 to $34.17 billion in 2026, reaching $65.74 billion by 2031.
Just as important, the architecture changed. The market moved beyond single-purpose robots toward orchestration layers, robot-agnostic middleware, machine vision, depth sensing, adaptive automation, and software-defined control. The signal was clear: the future warehouse is not one robot, it is a coordinated system.
3. Visibility matured into intelligence, then into response
In 2026, visibility alone was table stakes. The meaningful shift was from seeing freight to acting on it. Disposable and cellular IoT sensors, smart labels, API-connected carrier data, and predictive analytics pushed logistics teams beyond simple location awareness toward workflow automation, risk scoring, and real-time exception management.
April coverage sharpened the picture further. Real-time edge data capture in warehouses showed that the next visibility upgrade is not another dashboard. It is faster receiving confirmation, better pick-path correction, and cleaner transportation handoffs at the moment work happens.
4. Multimodal optimization came back in a big way — and diverged sharply
Truckload tightening, intermodal catch-up, rail volume growth, and LTL pricing discipline made modal decisions more strategic in 2026. North American rail traffic posted a 1.8% gain through the first 12 weeks of the year, while trucking spot rates surged and intermodal remained attractive on the right lanes. The March Logistics Managers' Index made the turn harder to ignore, with transportation capacity falling to 39.2 while transportation pricing jumped to 89.4.
By late April, a new wrinkle emerged: a genuine multimodal divergence. Ocean freight was drowning in structural overcapacity — the global fleet grew 3.6% while demand grew only 3%, pushing spot rates 30–40% below 2024 peaks. Trucking, by contrast, was tightening under the weight of driver shortage (now 82,000 and climbing toward 160,000 by 2028), EPA 2027 pre-buy pulling forward equipment demand, and a regulatory confluence actively removing trucks from the road. And air cargo was spiking on Middle East disruption, with some lanes up 70% year over year. This divergence made mode-selection technology and real-time rate benchmarking more valuable than at any point in recent memory.
5. Resilience technology moved into the center of the stack
The best operators in 2026 did not treat resilience as a memo from procurement. They operationalized it through AI scenario modeling, supplier diversification, FTZ and bonded warehouse strategies, predictive inventory, and corridor-aware network design. By late 2025, 30% of CFOs had elevated supply chain resilience to their top strategic priority, and 35% cited risk management and compliance as their primary focus. That mindset carried through 2026.
McKinsey's 2025 Risk Pulse — the most directly relevant benchmark for understanding 2026 conditions — confirmed the shift. 82% of companies reported tariff-driven operational disruptions in 2025. Nine in ten executives encountered at least one significant supply chain disruption in 2024. The response: resilience displaced cost efficiency as the primary driver of network changes. But there was a twist: leading companies were reportedly delaying broader digital transformation initiatives to focus on faster, tactical responses — creating a tech debt risk that will compound as the tariff cycle eventually stabilizes.
Tariff front-loading, trade lane instability, emergency-readiness gaps, and regional disruptions made resilience a daily operating issue. Technology helped absorb the volatility, but only when it was embedded into transportation and inventory workflows.
6. Planning and fulfillment networks became more selective
Retailers and food shippers stopped treating network growth as the only path to better service. Ulta expanded ship-from-store from roughly 500 stores to more than 1,000 while keeping its core fulfillment footprint flat. Hormel rolled out AI planning across 70-plus dry and refrigerated sites. Walmart, by contrast, used automation economics to consolidate volume into stronger NextGen facilities instead of preserving every node.
The common lesson was blunt: smarter orchestration often beats another building.
7. Consolidation increased the value of independent technology
The M&A wave was impossible to ignore. Q1 2026 alone saw $50 billion+ in major logistics deal activity, including Echo Global + ITS and the WWEX-Auctane combination. Carrier structure moved too, with FedEx Freight preparing to spin out as a standalone LTL carrier and rail megamerger scenarios threatening to change procurement leverage lane by lane.
For shippers, that makes independent TMS, open APIs, and cross-provider benchmarking more strategically valuable. In a consolidating market, the shipper who controls the data layer keeps the leverage.
Coverage Snapshot Across 2026 Posts
This retrospective reflects 1,836 CXTMS blog posts published in 2026 through September 18. The latest refresh added 10 posts from September 18, extending the retrospective into tariff-refund entry readiness, hydrogen and zero-emission truck economics, border equipment positioning, cross-border lane qualification, semiconductor allocation, working-capital-aware freight planning, supply chain decision rights, domestic capacity launches, and warehouse cutover governance. Looking across the full corpus, a few themes clearly dominated coverage:
| Theme | Signal from 2026 coverage | Why it matters |
|---|---|---|
| Visibility and data | Present in 1,624 posts | Visibility stayed central, but September coverage pushed it toward durable shipment records, corridor events, asset health, release status, and evidence that can change execution. |
| Network strategy | Present in 1,544 posts | Trade shifts, multimodal planning, gateway continuity, routing-guide allocation, equipment availability, and parcel handoffs kept network strategy in the daily operating conversation. |
| AI | Present in 624 posts | AI became a core execution, planning, pricing, forecasting, inspection, predictive-maintenance, and exception-management theme, with September emphasizing confidence thresholds and human-governed action. |
| Compliance and risk | Present in 1,456 posts | Trade, customs, food safety, security, inspection exposure, origin proof, acquisition cutovers, and cross-border risk kept compliance in the operating core. |
| Automation and robotics | Present in 616 posts | Automation broadened from robotics into autonomous transport, packaging lines, predictive MRO, workflow redesign, orchestration, and measurable release control. |
| Sustainability | Present in 366 posts | Decarbonization, EV dispatch, port incentives, carbon-data validation, circular logistics, energy exposure, and Scope 3 proof remained important, even as resilience dominated urgency. |
| Integration and governance | Present in 1,081 posts | Integration debt, workflow governance, chain of custody, eligibility rules, release gates, decision logs, and data ownership remained limiting factors for AI and execution technology. |
The pattern is pretty clear: 2026 was not driven by one shiny technology. It was driven by the convergence of AI, automation, visibility, connectivity, compliance, and network strategy into operating systems that could survive messy real-world freight conditions. The latest April-May coverage made that even sharper, especially around tariff arbitrage documentation, BCG's operating system framework for AI planning, FedEx's open robotics partnership pivot, the inventory visibility-to-execution gap, the accelerating LTL capacity contraction, accessorial fee leakage, and Cass's clearest Q1 rate-volume divergence signal, Amazon opening its logistics infrastructure to outside shippers, UPS scaling postal handoffs, April's capacity collapse, SMB tariff restructuring, and the shift from visibility toward execution-speed governance. May 9 coverage added another layer: agentic planning tools, logistics IT integration debt, robotics adoption friction, secondary capacity budgeting, fleet safety risk, deferred maintenance, container-aware fulfillment, regionalized manufacturing, and sustainability decision intelligence. May 10 then pushed the retrospective toward execution detail: smart-safe cash logistics, SKU and product-code governance, USPS network redesign, Asia-U.S. air cargo optionality, food-logistics border warehouses, automated value-added cold-chain facilities, reverse-logistics ESG controls, disaster-response readiness, rail/intermodal divergence, and Cass April rate-pressure planning. May 11 added a tougher operating-model layer: Gartner's warning that AI hiring freezes can create future talent premiums, the finding that only 17% of supply chain organizations are pursuing immediate AI-led workflow redesign, AWG/RELEX evidence that AI planning still needs human-governed execution, a proposed 25% EU vehicle tariff turning automotive logistics into a classification workflow, record material-handling equipment demand, ELD/Roadcheck compliance as a capacity risk, small-carrier bankruptcy signals, and Wiliot's Gen3 IoT Pixel pushing visibility closer to item-level sensing. May 12 made the execution message blunter: safety data is now routing-guide intelligence, digital logistics buyers are rejecting dashboards for workflow systems, dock and yard manual work has become a transportation risk, mid-year budget reforecasting is unavoidable, P&G's Supply Chain 3.0 rollout validated integration-first automation, Section 232 derivative tariffs turned classification into cost control, SCM software buyers are demanding orchestration, Target's receive-center model moved inventory buffers upstream, and trans-Pacific blank sailings proved capacity management can raise rates even when demand is soft. May 13 added the next layer: agentic AI cannot safely automate customs without classification governance and audit trails, air cargo's demand decline exposed capacity-trust risk, April's LMI showed storage tightening alongside freight tightening, cold-chain capacity growth exposed the gap between cubic feet and usable resilience, cobot growth confirmed practical automation is beating vague automation, modular ecommerce warehouse tools raised the bar for WMS/TMS integration, and sustainable fleets shifted from single-fuel bets to lane-specific energy portfolios. May 15 tightened the operating-model argument again: Gartner's AI warning showed most teams are still incremental, Penske's Supply Chain Insight reframed visibility as an AI execution layer, public-sector and retail logistics market data exposed large service-growth pools, parcel carriers' volume-to-value pivot made continuous contract optimization mandatory, USPS financial pressure turned postal dependency into contingency risk, EV launch issues proved part-level supplier visibility matters, and self-funding AI programs linked early savings directly to transformation budgets. May 16 pushed that argument from platforms into operating control: cross-border parcel status text became customs evidence, control towers were judged by decision latency, procurement integrations turned freight data into source-to-pay signals, India growth forced lane-by-lane forwarder strategy, industrial leasing became a transportation-footprint decision, Port Tracker import softness demanded scenario planning, risk management moved from alerts to action, Trojan Driver fraud exposed the limits of static carrier checks, and Walmart/Sam's Club made stores into hour-level speed nodes. May 17 added a practical infrastructure layer: air cargo rates showed capacity scarcity rather than simple fuel pass-throughs, tariff-and-fuel playbooks became importer operating discipline, medical device disruption exposed multi-tier healthcare risk, industrial production turned macro data into freight triggers, conveyor and packaging investments proved physical flow still matters, yard gates became machine-vision data capture points, broker liability raised carrier-vetting stakes, Ulta's Utah DC showed regionalization and automation reinforcing each other, and USPS sub-pound pricing pressure made lightweight parcel economics a TMS problem. May 18 added a network-edge layer: Alaska coverage treated remote logistics as strategic air, port, fuel, and community-service infrastructure; asset-based carrier procurement showed reliability beating pure rate shopping as capacity tightened; Canada's grid buildout turned electrification into heavy-haul corridor planning; the CPKC-CSX Southeast Mexico route made nearshoring execution measurable; Cuba's fuel shortage exposed political-energy risk; Dollar Tree's Arizona DC proved retail resilience is a transit-time problem; EPR reporting shifted sustainability into product-data traceability; FedEx Network 2.0 closures made carrier redesign a shipper planning issue; seaport densification elevated predictive analytics over endless physical expansion; and USPS peak-season performance turned postal contingency planning into parcel operating discipline. May 19 added the governance layer around physical and regulatory constraints: Baltimore's bridge settlement turned maritime liability into planning evidence; Brunswick's RoRo berth showed finished-vehicle capacity depends on port, rail, dredging, and yard data; drayage best practices moved customer experience to the gate; EU van rules turned last-mile procurement into compliance strategy; fleet-leadership turnover became a capacity risk signal; Japan Airlines pushed humanoid robotics toward airside labor gaps; seismic warehouse rules made facility engineering part of automation readiness; tariff-adjusted landed cost replaced unit price as the sourcing metric; Turkey's Europe-Gulf corridor reinforced Middle Corridor optionality; and Union Pacific's domestic rail-steel contract tied infrastructure sourcing to network reliability. May 20 added a cost-control and documentation layer: flat ATA truck tonnage confirmed capacity planning should watch supply tightness rather than wait for volume spikes; Averitt's Louisville campus showed regional freight networks being rebuilt around integrated cross-dock, fulfillment, maintenance, and trailer capacity; DOJ container price-fixing charges turned ocean procurement into an auditable compliance workflow; FMC cargo-protection messaging raised the value of claims-ready booking and handoff records; billing-error automation reframed invoice accuracy as margin protection; Mondelēz's in-house distribution and AI program linked CPG cost control to WMS/TMS integration; producer-price inflation made transportation cost sensing a mid-cycle budget requirement; C.H. Robinson's South Texas produce center reinforced border cold-chain specialization; sustainable packaging moved deeper into cube, damage, automation, and EPR engineering; and UPS cargo-jet safety hearings made air-freight contingency planning start before cargo reaches the airport. May 21 added a sharper decision-layer theme: DAT truckload data separated fuel-driven rate pressure from weaker van and reefer volume; a record 17.8-million-barrel crude inventory draw made export pull a freight-planning signal; the EU-U.S. trade deal turned customs teams into scenario planners; the federal freight plan connected bottlenecks, cargo theft, infrastructure funding, and emerging technology in one resilience map; fill rate and Target's leadership change reframed retail logistics around in-stock reliability; Locus buying Nexera pushed warehouse robotics from movement into manipulation; O'Reilly's private-label push made supplier diversification an inventory-control capability; Roadcheck Week proved compliance events can remove capacity before inspections begin; and a U.S.-China agriculture board showed how policy commitments become reefer, port, rail, documentation, and equipment signals. May 22 tightened the operational-data argument: FMCSA's $217 million grant package pushed roadside enforcement toward connected carrier governance; Georgia Ports showed inland ports are resilience infrastructure even when Savannah TEUs fell 14%; GM turned renewable power procurement into supplier and freight-planning data; integrated lift-truck screens reframed autonomous forklift ROI around worker adoption; truck-stop safety became carrier-scorecard evidence; FTR's -18.9 Shippers Conditions Index made fuel-sensitive budgeting a workflow trigger; and tariff optimization moved from emergency workaround to permanent operating model. May 23 added a fresh simplification-and-evidence layer: Albertsons turned produce inspection into AI-readable quality data; Canada's trade diversification exposed port productivity as a corridor constraint; contactless big-and-bulky delivery, fuel-sensitive furniture delivery, and J&J Snack Foods' distribution savings all pointed to service segmentation and surcharge governance; Starbucks cup trackers proved sustainability claims need reverse-flow chain-of-custody evidence; trucking legal risk reduced usable capacity; and Under Armour's 25% SKU cut confirmed SKU rationalization is an execution-system problem, not just merchandising cleanup. May 24-26 added the newest operating layer: Brazil direct-entry parcel lanes showed cross-border e-commerce now depends on customs-cost-final-mile control; cargo theft shifted from security incident to execution risk as deceptive pickups rose; cold storage growth exposed the difference between capacity and orchestration; data-center and transformer logistics made packaging, heavy-haul staging, and milestone visibility board-level concerns; warehouse labor AI reframed productivity around fewer firefighting loops; a proposed 91,000-pound truck pilot and split April intermodal data complicated rail-versus-truck planning; FedEx Freight's standalone launch pushed LTL pricing toward dimensional data quality; Mexico's MVE deadline turned customs declarations into a live audit workflow; AMR and flexible intralogistics coverage proved scaled robotics now needs orchestration discipline; and supply chain AI pilot purgatory reinforced the central thesis that technology only scales when the operating model changes with it. May 27 extended that operating layer into recovery finance, supplier readiness, and physical-flow governance: CBP tariff refunds turned customs history into an $85 billion workflow opportunity; Prologis-style real estate tightening forced warehouse footprint decisions back into transportation models; Walmart inbound simplification made PO, ASN, appointment, carrier, and receipt data a supplier-readiness test; robot diversification exposed automation vendor lock-in; and pedestrian safety plus unitizing coverage showed that throughput, damage prevention, and worker protection now depend on better sensor, packaging, and execution data. May 28 added the documentation-and-corridor layer: a $200 million maritime modernization fund, de minimis refund limits, Maersk detention-charge settlement, Germany-Canada LNG corridor planning, Cargill beef cold-chain labor risk, and Novelis aluminum recovery all pointed to the same operational rule — resilience now depends on auditable records, trigger-based mode decisions, and network plans that connect ports, plants, energy, customs, and finance before disruption hits. May 29 added the execution-control layer: active caching for demand surges, DHL-USPS final-mile network design, Hub Group freight-spend controls, Temu marketplace import compliance, Boeing supplier-quality logistics, workforce orchestration, critical-goods stockpiling, autonomous-truck physical AI, Europe export productivity risk, and UP-NS intermodal planning all showed that inventory, labor, compliance, quality, and carrier strategy now have to be governed as connected operating data. May 30 added the scorecard-and-optionality layer: e-commerce fulfillment redesign, WMS-to-freight cost leakage, ocean spot exposure, procurement AI pilots, OETA and ISP rail metrics, dual-sourced SKU transportation optionality, upstream Target holding capacity, tariff-refund evidence, UPS Mexico air freight, and Walmart 30-minute store fulfillment all pointed to the same conclusion — operational data now has to explain not just where freight is, but why each network, sourcing, mode, finance, and service decision is economically defensible. May 31 added the proof-before-movement layer: diesel above $5.50 made fuel surcharge logic a routing-guide control, Taiwan's retroactive 15% tariff cap turned entry correction into classification work, Vietnam's Section 301 probe made IP exposure a sourcing-data risk, renewed USMCA talks moved rules of origin into lane planning, food waste became a store/SKU/shelf-life data problem, and social impact traceability pushed product-level proof into procurement and logistics workflows. June 1 added the execution-record layer: Amazon's external logistics stack turned freight, fulfillment, parcel, customs, and inventory into one benchmarkable network; Penske-style secure control towers made trusted access and auditability part of service; clinical-trial, aerospace, cobalt, and Samsung coverage showed supplier, labor, customs, temperature, and chain-of-custody risk must be governed before disruption; and the AI ROI story made workflow ownership the difference between technology spend and measurable operating improvement. June 2 added the upstream-signal layer: inland-port rail rebuilds, Autoliv's Turkey wind-down, Canada Post labor peace, green-yard proof, Asia-U.S. heavy air cargo, May PMI expansion, Target's receive-center model, trucking credit metrics, and USPS spending controls all showed that capacity risk starts in infrastructure, labor, production, cash, and compliance data before it appears in a tender rejection rate. June 4 added the execution-governance layer: 3PL outsourcing works only when shipment, inventory, appointment, accessorial, POD, and exception data remain under shipper control; brownfield automation and robotics now require workflow fit, data quality, integration depth, operating ownership, and execution visibility; cold-chain maps need live dwell, reefer, inspection, and partner-performance data; forced-labor and Section 232 tariff relief require origin and supplier proof inside shipment workflows; daily market intelligence has to trigger routing-guide, budget, and customer-communication changes; and summer volatility is forcing dynamic consolidation, cutoffs, and mode-switch playbooks. June 5 added the interface-and-capacity layer: AI can make logistics software screens easier to copy, so advantage shifts to execution data quality; ShipStation Global shows SMB parcel, LTL, truckload, and international shipping converging into enterprise-grade stacks; data-center construction is pulling flatbed and heavy-haul capacity into milestone-driven project logistics; Great Plains fulfillment nodes are becoming parcel-zone pressure valves; adaptive grocery traceability, RFID cartons, and shelf-ready packaging are turning product identity into labor strategy; India and Japan show last-mile density and value-added 3PL services becoming market-specific operating capabilities; and Port Houston plus EXPO PACK México show physical infrastructure and automation readiness still decide whether digital plans survive the dock. June 6 added the capacity-evidence layer: agentic AI needs process discipline before autonomy; truckload pricing is tightening before broad demand returns; deferred maintenance can turn nominal capacity into unreliable capacity; parcel networks require carrier diversification and accessorial math; ocean surcharges need quote-level governance; perishable inventory visibility ties waste, shelf life, and recalls to freight execution; rare earth controls make small components a lane-planning risk; and UPS Healthcare shows cold-chain specialization becoming acquisition strategy. June 7 added the planning-compression layer: AI optimization shortened planning cycles, April LMI readings forced budget reforecasting, weather pressure became a planning metric, same-day LTL became a design requirement, public freight funding turned into grant-readiness work, facility expansion moved ahead of full market recovery, FedEx linked European truck hubs to premium air strategy, UPS highlighted service-parts specialization, WMS buyers prioritized labor relief, and WTO trade warnings put inventory timing under tighter scrutiny. June 8 added the reliability-and-governance layer: alternative parcel providers used AI to improve support and POD checks, Amazon made handling-time data a service-level contract, AutoStore localized automation components, AutoZone showed mega hubs as inventory-availability infrastructure, retailers favored certainty over raw speed, workforce churn and maintenance technicians became service and ROI constraints, weight records became enforcement data, and Starbucks plus Walmart proved AI programs need kill switches, usage caps, and operating-budget ownership. June 9 added the supplier-package-fuel layer: EU diversification proposals made origin and landed-cost records execution data, containerboard and Wayfair coverage showed package dimensions and corrugated availability drive freight cost, India road freight and Vietnam export growth turned domestic linehaul and lane design into scaling risks, Port Houston reinforced equipment-aware breakbulk planning, procurement AI exposed handoff ambiguity, Russia sanctions made partner records shipment records, U.S.-China tariff comments required SKU-level customs scenarios, and Yang Ming showed LNG bunkering is now a scheduling and emissions-documentation workflow. June 10-12 added the portfolio-and-corridor layer: accessorial charge recovery limits, forecast-driven inventory reductions, Amazon logistics platformization, cloud TMS market growth, freight-forwarder consolidation, parcel carrier diversification, ocean/Hormuz surcharge governance, API brokerage compression, ASEAN fulfillment, customs brokerage capacity, fleet digitization, smart-container pre-clearance, Argentina/Canada/Mexico/MEA regional freight growth, China ecommerce paperwork, frontline AI upskilling, and World Cup event logistics all reinforced one practical point — execution systems now need to manage cost, documents, workforce readiness, and corridor risk together. June 15 added the planning-slack layer: carrier costing, recall scope, cold-chain nodes, stale assumptions, LMI signals, pallet availability, frontloaded imports, rail-intermodal optionality, software vendor risk, and warehouse process debt all showed that margin now depends on catching weak assumptions before they become freight exceptions. June 16 added the readiness-and-permission layer: freight-engineering AI, defense logistics alignment, packaging safety controls, franchise standardization, asset-level rail visibility, fuel-policy triggers, maritime workforce risk, guided warehouse work, EV route economics, and role-based freight data all showed that the next execution advantage is proving which data, role, asset, route, worker, and package condition makes a logistics promise safe to automate. June 17 added the point-of-execution-control layer: Adani's Kaleris deployment moved AI into terminal operating software across ports; Dell/HPE memory pressure turned AI infrastructure into an inbound logistics constraint; importer identity, EU farm-cost rules, and highway funding made evidence and corridor planning daily controls; Grocery Outlet and Tractor Supply showed AI has to work with store-level and rural-local judgment; and Kimberly-Clark plus SCaaS coverage reinforced that simplification, platform economics, and workflow ownership beat tool sprawl. June 18 added the adaptability-and-proof layer: AI/TMS integration showed legacy systems increasingly need intelligent orchestration rather than rip-and-replace projects; Boston Scientific's Indiana DC tied regulated distribution closer to manufacturing, traceability, and service execution; Canada's forced-labor watchdog shift made supplier and origin evidence a standing import-control requirement; DP World's Corpus Christi bid highlighted Gulf Coast optionality as a resilience safety valve; Port of Los Angeles volumes exposed import/export imbalance as a peak-season planning risk; CSCMP's State of Logistics benchmark made adaptability a measurable KPI; and West Coast labor coverage pushed automation trust into the 2028 risk dashboard. June 19 added the risk-ownership layer: animal-welfare penalties made supplier governance operational; Bristol Myers' AI procurement result showed workflow compression can beat perfect-data paralysis; Canada's grocery probe and fertilizer bottlenecks tied food inflation to logistics capacity; committed freight marketplaces shifted truckload coverage from spot recovery to lane commitments; constraint-based planning challenged buffer inventory; EU unsold-goods rules made circular logistics a margin strategy; FedEx fuel-table changes exposed surcharge governance; logistics-manager salary data showed the role expanding into tech, risk, and finance; and sanctions uncertainty made sense-making a live execution discipline. June 20 added the execution-adaptability layer: UPS parcel AI, Gartner's AI workforce data, GNC drone cycle counting, Long Beach electric drayage, International Paper's rail-served packaging plant, FedEx-China Southern air-cargo cooperation, Walmart brownfield automation, May retail sales, BidBoardX reliability metrics, and Automate 2026 humanoid robotics all showed the same thing — technology has to turn volatile physical constraints into governed action before exceptions pile up. June 21 added the measurement-trigger layer: AI scanning, air-freight rate spikes, inland rail projects, retail sortation, automated track inspection, hazmat compliance, LTL KPIs, Cass cost-per-shipment data, and WMS selection all need to become operating triggers that tell teams when to intervene, shift modes, audit carriers, redesign flow, or stop a software purchase before the failure becomes expensive. June 22 added the trust-and-fallback layer: accepted-volume indexes, hallucination controls, autonomous freight playbooks, CDL pipelines, safety-sensor evidence, vendor-budget scrutiny, regional 3PL optionality, Hormuz cost codes, consolidated data governance, and carrier-qualification audit trails all have to prove reliability before automation can safely act. June 23 added the geography-and-origin-proof layer: Harley-Davidson's reshoring plan made production location a freight-planning input across suppliers, plants, packaging loops, and dealer replenishment, while U.K. deforestation rules made origin evidence a shipment-level procurement, customs, warehouse, and transportation control rather than a static sustainability document. June 24 added the governed-optionality layer: 3PL rebound data, PwC deal premiums, apparel wage-pressure signals, Germany pharma trade risk, rail telecom outages, ISM growth forecasts, manufacturer inventory-placement pressure, and Mexico corridor pilots all showed that optional providers, alternate lanes, compliance evidence, and inventory buffers only create resilience when they are pre-modeled, scored, and connected to live execution workflows.
New Insights from September 7, 2026 Posts
The September 7 posts moved the retrospective from continuity economics to constraint-aware portfolio allocation. AI hardware made a modest global air-cargo forecast irrelevant on the lanes that matter, where Northeast and Southeast Asia-to-North America rates were more than 40% above late-February levels. Manufacturing data told the same story: an expanding headline coexisted with low customer inventories and softer backlogs. Gateway shifts, Baltic grain diversions, and LNG vessel deployment all showed that nominal capacity must be adjusted for inland connections, fuel availability, terminal readiness, congestion, and recovery variability before it becomes a usable routing option.
Allocation discipline also moved upstream. Fashion companies are consolidating supplier counts while retaining geographic diversity; the winning model is governed volume shares with minimum viable commitments and transfer tests. GE Appliances' $1 billion Louisville ramp showed why supplier, production, warehouse, and carrier milestones belong in one control tower. European energy costs and forced-labour rules added margin and release evidence to the same network model, while brokerage investment reinforced continuous carrier identity, fraud, credit, and service controls as volume grows.
For technology buyers, the practical conclusion is direct: dashboards should not merely display market averages. They should decompose signals, qualify constraints, preserve product and supplier evidence, and execute staged allocation changes with predefined review and stop conditions.
Key Statistics and Sources from 2026 Coverage
| Trend | Statistic | Why it mattered | Source |
|---|---|---|---|
| AI-driven air-cargo mix | Global air-cargo growth was forecast at 2%-3%, while late-June Northeast and Southeast Asia-to-North America rates were 41% and 42% higher than late February; U.S. air imports were up 17% YoY | Lane- and commodity-level demand signals matter more than the global average when AI hardware competes for premium capacity | Supply Chain Dive / CXTMS September 7 analysis |
| Manufacturing signal decomposition | August PMI remained above 50 for an eighth consecutive month; customer inventories were 42.8, while backlogs were 51.8, down 3.2 points | Freight forecasts should separate replenishment demand from constraint noise and slowing backlog momentum | FreightWaves / Supply Chain Dive / CXTMS September 7 analysis |
| European energy exposure | 42% of European companies said energy costs hurt profitability and investment decisions in the two years through March 2026 | Energy scenarios belong in node, lane, landed-cost, and production-allocation models | Deloitte / CXTMS September 7 analysis |
| Fashion sourcing allocation | Nearly half of surveyed fashion companies planned to use fewer suppliers; tariffs lifted apparel and leather-goods first costs about 35%, and 55% of executives expected further retail price increases | Geographic diversity needs order-level allocation rules, transferable capacity, and current duty assumptions | Supply Chain Dive / McKinsey / CXTMS September 7 analysis |
| Factory-ramp synchronization | GE Appliances announced a $1B Louisville investment after awarding $150M+ to 22 suppliers in 10 states; the company works with 6,500+ U.S. suppliers | Factory ramps need one milestone chain linking components, production readiness, storage, carrier capacity, and customer commitments | SupplyChainBrain / Supply Chain Dive / CXTMS September 7 analysis |
| Baltic grain rerouting | Baltic rail requests reached 5M metric tons by August 18 against about 7M tons of estimated annual terminal capacity; Black Sea requests were about 6M tons | Diversion plans must compare corridor ceilings, queue risk, rail slots, storage, vessel windows, and variability—not distance alone | Reuters / CXTMS September 7 analysis |
| Transportation capacity reset | August LMI capacity was 40, utilization 70.6, and prices 90; respondents expected 12-month readings of 43, 71.9, and 86.1 respectively | Routing guides need lane-level acceptance, spot-premium, lead-time, and allocation triggers while capacity remains in contraction | FreightWaves / CXTMS September 6 analysis |
| Corridor inspection exposure | Texas inspectors recorded 1,935 violations across 351 inspections, placing 167 vehicles and 34 drivers out of service; 2025 Roadcheck sidelined 10,148 vehicles and 3,342 drivers | Inspection risk belongs in corridor selection, carrier qualification, recovery ETAs, and customer-promise buffers | FreightWaves / CXTMS September 6 analysis |
| Predictive MRO value | One cited program saved $5M annually; another reduced unplanned downtime 80% and saved about $300,000 per asset | Equipment-health signals create value only when linked to order waves, carrier cutoffs, maintenance windows, and avoided shipment disruption | Deloitte / CXTMS September 6 analysis |
| Prepared-food packaging automation | A line supporting about 36M pounds annually cut staffing from as many as 12 people to two or three and reached full production in 10 days | Automation throughput must stay connected to lot identity, quality holds, cold-chain evidence, and transportation release status | Modern Materials Handling / CXTMS September 6 analysis |
| Air-cargo gateway concentration | Leipzig's hub was designed for 50+ aircraft per weekday and initially 1,500 metric tons daily, with 2,000 tons projected | Security disruption at a concentrated hub requires prequalified diversions, custody-preserving milestones, and clock-based recovery drills | FreightWaves / CXTMS September 6 analysis |
| Integrated global operating model | UPS Supply Chain Solutions generated $8.77B in 2025 3PL revenue; Q2 2026 revenue rose 7.8% to $2.86B | Global standardization needs one durable record for modes, milestones, documents, costs, exceptions, and local execution decisions | FreightWaves / CXTMS September 6 analysis |
| Autonomous-truck commercial models | Aurora targets more than $2/mile for TaaS and more than $0.85/mile for DaaS, with 200+ trucks targeted by year-end | Buyers must normalize terminal, local-move, empty-mile, equipment, insurance, and fallback costs before comparing autonomous and conventional bids | FreightWaves / CXTMS August 7 analysis |
| Flatbed capacity pressure | Spot rates reached $4.32/mile and tender rejections remained above 38% | Equipment-specific routing guides and rejection triggers are more useful than a blended truckload forecast | FreightWaves / CXTMS August 7 analysis |
| Regional freighter contingency | Lufthansa Cargo's four grounded A321 freighters represented about 210 metric tons of daily capacity | Airfreight plans need shipment-level gateway, belly-capacity, road-feeder, security, and recovery-time alternatives | FreightWaves / CXTMS August 7 analysis |
| Tariff-refund settlement | More than $175B was potentially refundable; 56,497 importers had completed steps for $127B in electronic refunds | Buyers need entry-to-SKU evidence and supplier settlement rules when the supplier is importer of record | Reuters / CXTMS August 7 analysis |
| Rail traffic mix shift | Weekly U.S. rail traffic rose 2.4%, while carloads fell 0.4% and implied intermodal volume rose about 4.8% | Mode decisions should follow carload and intermodal streams separately instead of the aggregate headline | FreightWaves / AAR / CXTMS August 7 analysis |
| Store replenishment recovery | Starbucks targets 24-hour replenishment after retiring an unreliable vision pilot and cutting menu SKUs 30% | Fast replenishment needs a defined recovery clock, dependable item data, cutoff rules, and exception ownership | Supply Chain Dive / CXTMS August 7 analysis |
| 3PL crossdocking availability | 81% of surveyed 3PLs offer crossdocking; fulfillment was 77%, value-added services 74%, transloading 73%, and ecommerce support 70% | Buyers need facility-level dwell, scan, damage, throughput, and recovery proof because a service-menu checkbox no longer differentiates providers | Inbound Logistics 2026 3PL Market Research Report / Logistics Management |
| Proposed transcontinental rail footprint | Proposed $85B UP-NS transaction would connect 50,000+ route miles across 43 states and about 100 ports | Rail optionality should be valued with lane-level access rights, reliability, facility fit, data rights, and remedies—not network maps alone | Logistics Management |
| Conagra resilience investment | $125M incremental fiscal-2027 supply chain investment; about 5,500 SKUs under review; capex expected at 4%-5% of net sales | Release capital against measurable constraint relief, reliability, inventory, transportation, and recovery outcomes | Supply Chain Dive |
| DHL Express fuel-table change | Two-percentage-point reduction; at $3.51/gal, export falls from 33.75% to 31.75% and import from 37.5% to 35.5% | Recalculate the eligible charge base shipment by shipment and audit the net invoice rather than assuming a uniform 2% saving | DHL / Supply Chain Dive |
| Food-plant industrial intelligence | 16B+ industrial data points processed annually; predictive maintenance can reduce downtime about 30% and labor cost up to 15% | Join equipment-health alerts to food-safety holds, production plans, inventory status, transport priorities, and human approvals | Food Logistics |
| Plastic-resin supply shock | North American polyethylene exports down 9.1M metric tons annualized; polypropylene production down about 3M metric tons; local resin prices up 30% YoY | Translate commodity disruption into material-to-SKU maps, controlled substitutions, allocation rules, and customer-specific freight escalation | Supply Chain Dive |
| Conflict-driven recovery cost | Ocean freight costs up 150%, air cargo up 40%, and supplier delivery performance weakest since 2022 | Procurement and logistics need shared thresholds for mitigation, allocation, premium freight, and executive intervention | SupplyChainBrain |
| 3PL technology and service benchmark | 87% offer TMS, 83% visibility, and 73% ERP integration; 78% of shippers prioritize service over price | Acquisition and outsourcing transitions need pre/post integration scorecards for data continuity, service, inventory, and exceptions | Inbound Logistics 2026 3PL Market Research Report |
| Inspection-ready trucking capacity | The 2025 International Roadcheck grounded 10,148 trucks and 3,342 drivers, producing out-of-service rates of 18.1% and 5.9%; brake-related OOS events can create four-to-eight-hour delays | Made vehicle condition, credentials, hours, and document validity pre-dispatch eligibility controls | FreightWaves / CVSA coverage / CXTMS July 23 analysis |
| Intermodal chassis control | ITE added 20,000 chassis for a 60,000-unit platform representing about 30% of cooperative-pool equipment; normal chassis dwell of six to seven days rose two-to-four times during the pandemic | Showed that location, dwell, condition, repair status, and repositioning rules determine usable intermodal capacity more than fleet totals | FreightWaves / CXTMS July 23 analysis |
| Fujairah gateway optionality | Planned terminals provide 2.5M TEUs, 190,000 vehicles, and 5.3M tons of annual general-cargo capacity outside Hormuz; early-2026 disruption backed up 700+ vessels and affected about 10% of the global container fleet | Turned chokepoint avoidance into a total-landed-cost, inland-capacity, customs, and activation-trigger workflow | SupplyChainBrain / Supply Chain Dive / CXTMS July 23 analysis |
| Skilled-trades automation constraint | An estimated 2.1M skilled-trades jobs could go unfilled by 2030; 52% of surveyed supply-chain leaders cited talent shortages while 82% expected robotics adoption and 84% expected AI adoption within five years | Made technician capability, training evidence, and shared workforce pipelines prerequisites for automation uptime | Modern Materials Handling / MHI / Deloitte / CXTMS July 23 analysis |
| Shipping-label authority | A federal indictment alleged diversion of at least $2M in Nike products; North American cargo theft incidents rose 49% in the first half of 2024 | Made label creation, reprint, destination change, approval, and scan reconciliation warehouse security controls | FreightWaves / Food Logistics / CXTMS July 23 analysis |
| USPS smart-locker network | Local XChange costs $5.51 per package across roughly 700 post-office locker locations; buyers have five days for locker pickup and 15 days before return, while only 6% of U.S. shoppers prefer lockers versus 12% globally | Showed last-meter capacity depends on custody events, compartment dwell, pickup clocks, eligibility, and customer-exception integration | Supply Chain Dive / CXTMS July 23 analysis |
| Domain-specific supply chain AI | 89% of operations and supply chain leaders said technology investments had not fully delivered expected results | Reinforced that specialized models still need governed logistics vocabulary, source authority, and human escalation rules | PwC survey cited by FreightWaves / Gartner / CXTMS July 22 analysis |
| North American trade volatility | 91% of 348 surveyed decision-makers were concerned about trade-policy shifts; tariffs affected revenue by an average 23%; 74% reported moderate-to-significant planning impact | Made shared shipment definitions, origin evidence, and certification readiness live transportation controls | SupplyChainBrain / CXTMS July 22 analysis |
| Ocean-to-air optionality | MSC ordered five 777-8 freighters; the aircraft promises 30% better fuel efficiency and 25% lower operating cost per ton; Boeing forecasts 2,930 freighter deliveries through 2045 | Showed why mode conversion needs shipment-level triggers, cost ceilings, and approval owners before disruption | FreightWaves / Boeing / CXTMS July 22 analysis |
| Southern California port flow | Los Angeles handled 1,002,734 TEUs in June, up 12% YoY; Long Beach handled 779,331 TEUs, up 10.6% | Turned drayage appointments, chassis availability, and receiving windows into the control points behind record throughput | Logistics Management / CXTMS July 21 analysis |
| Reverse logistics | U.S. market projected from $199.71B in 2026 to $275.79B by 2031 at 6.67% CAGR; recovery values can reach 40%-60% of original retail price | Made pre-dock disposition rules essential to protect resale value and avoid unnecessary handling | Mordor Intelligence / CXTMS July 21 analysis |
| Warehouse demand | Prologis signed 67M square feet of leases in Q2; commencements reached 61.7M square feet, up 21% YoY | Made leasing activity a forward signal for labor, carrier access, inventory placement, and facility-network decisions | FreightWaves / CXTMS July 21 analysis |
| Cross-border ecommerce logistics | U.S. cross-border ecommerce logistics estimated at $17.51B in 2026 and $26.15B by 2031 at 8.35% CAGR; transportation held 68.39% of 2025 market share, while value-added services are forecast at 13.48% CAGR | Made customs-first delivery promises a growth requirement across entry data, landed cost, mode choice, carrier allocation, and exception handling | Mordor Intelligence / Reuters / Supply Chain Dive / CXTMS July 13 analysis |
| Freight fraud and carrier onboarding | Overhaul recorded 574 U.S. cargo theft events in Q1 2026, down 23% YoY, while strategic cargo theft rose 22% | Shifted carrier onboarding from static vetting toward live identity, authority, insurance, tender, geofence, and pickup-control records | FreightWaves / SupplyChainBrain / CXTMS July 13 analysis |
| Furniture network redesign | La-Z-Boy is consolidating 15 regional centers into three centralized hubs, targeting a 30% square-footage reduction and 20% mileage reduction | Proved bulky distribution savings need SKU-level cost-to-serve, damage, appointment, return, accessorial, and carrier-performance evidence | Supply Chain Dive / Mordor Intelligence / CXTMS July 13 analysis |
| Item-level verification | Macy's RFID-supported cycle counting maintained inventory accuracy of 97% or better | Turned ASNs from pre-receipt messages into control records that need item, carton, PO, shipment, exception, and receiving proof | Modern Materials Handling / CXTMS July 13 analysis |
| Automotive launch logistics | Toyota plans a $3.6B San Antonio expansion, creating more than 2,000 jobs and shifting some U.S.-market Tacoma production from Baja California to Texas by 2030 | Made launch readiness a logistics workflow across inbound sequencing, packaging loops, yard design, rail access, supplier timing, and dealer replenishment | Supply Chain Dive / Reuters / CXTMS July 13 analysis |
| Services and spare-parts planning | June Services PMI reached 54, the 24th straight month of services growth; more than 80% of service-parts study respondents rated accurate planning and forecasting as challenging or extremely challenging | Showed services growth still creates freight volatility through parts criticality, install windows, returns, field inventory, and emergency transportation | Logistics Management / Inbound Logistics / CXTMS July 13 analysis |
| AI infrastructure logistics | Deloitte said AI data center spending accounted for almost all U.S. GDP growth in the first half of 2026; McKinsey framed the AI data-center buildout as a $7T infrastructure race; Reuters Breakingviews estimated Big Tech AI spending could reach $630B, with roughly 70% flowing to chips | Moved AI supply chain risk beyond chips into power gear, land, buildings, long-lead components, export controls, site readiness, and project freight visibility | Deloitte / McKinsey / Reuters Breakingviews / CXTMS July 12 analysis |
| Capital goods import signal | May U.S. merchandise deficit widened 27.4% to $105.8B; goods imports rose 3.6%; goods exports fell 5.4%; capital goods imports were nearly 42% higher YoY | Turned macro import data into a planning trigger for heavy handling, staging, drayage, permits, production milestones, and industrial freight capacity | Reuters / CXTMS July 11 analysis |
| Project logistics market | Project logistics estimated at $464.30B in 2025, $487.62B in 2026, and $624.06B by 2031 at 5.06% CAGR; oversized cargo held 32.61% of 2025 market share | Showed industrial and infrastructure freight requires equipment, crew, route, permit, storage, and appointment controls long before tender | Mordor Intelligence / CXTMS July 11 analysis |
| Frontline worker technology | North America frontline worker technology projected from $6.09B in 2026 to $15.36B by 2031 at 20.32% CAGR; transportation and logistics forecast at 24.87% CAGR | Reframed frontline tools as control layers for task state, safety checks, exception proof, dock handoffs, and transportation decisions | Mordor Intelligence / CXTMS July 9 analysis |
| Warehouse AI and software adoption | 42% of surveyed companies increased materials-handling software usage; 26% are actively using AI, up from 19% one year earlier; another 29% are evaluating AI | Made shared exception taxonomies and human-in-the-loop workflows prerequisites for reliable warehouse automation | Modern Materials Handling / CXTMS July 9-10 analysis |
| MEA freight optionality | MEA freight and logistics market estimated at $321.36B in 2026 and $416.75B by 2031 at 5.34% CAGR; Saudi Arabia earmarked $133.3B for ports, airports, and railways through 2030 | Made road-water-port optionality a formal network-design problem rather than emergency mode switching | Mordor Intelligence / Logistics Management / CXTMS July 9 analysis |
| China supplier diversification | 58% of surveyed Chinese supply chain executives plan to diversify sourcing in 2026; 38% plan near-shoring, 36% friend-shoring, and 32% inventory increases | Turned flexibility into a data problem across supplier qualification, lane design, buffer placement, mode choice, and landed-cost control | SupplyChainBrain / DP World survey / CXTMS July 8 analysis |
| India 3PL warehousing | India's 3PL warehousing market estimated at $12.04B in 2026 and $16.76B by 2031 at 6.84% CAGR | Shifted warehousing advantage from space alone toward value-added execution control, kitting, labeling, marketplace work, carrier handoffs, and transport-ready evidence | Mordor Intelligence / CXTMS July 8 analysis |
| Mexico cargo theft severity | Mexico opened 2,099 cargo theft investigations from January-May 2026, down 21% from 2,653 a year earlier; Canacar reported at least 14 driver deaths and nearly 13,000 violent cargo robberies in the period | Showed lane risk can worsen even when incident counts improve, requiring route, stop, escort, carrier, insurance, and driver-safety controls | FreightWaves / Canacar / CXTMS July 6 analysis |
| Food traceability gap | 75% of food shippers said they were investing in supply chain visibility technology, while 26% were not monitoring temperature-controlled shipments at all | Exposed the gap between traceability ambition and live temperature, custody, delay, release, and recall evidence | Food Logistics / Food Shippers of America / CXTMS July 6 analysis |
| Event logistics market | Global event logistics market estimated at $79.33B in 2026 and $103.89B by 2031 at 5.55% CAGR; transportation services held 77.60% of 2025 revenue | Made venue deadlines, marshaling yards, install crews, reverse moves, and penalty exposure a milestone-control use case for freight data | Mordor Intelligence / Inbound Logistics / CXTMS July 5 analysis |
| Big-and-bulky final mile | U.S. 3PL big-and-bulky market estimated at $9.3B with 11.8% CAGR from 2022-2025; final-mile delivery can represent up to 40% of total transportation cost | Showed appointment discipline, damage control, returns, density, and cost-to-serve analytics are central to bulky delivery economics | Inbound Logistics / Armstrong & Associates / CXTMS July 3 analysis |
| China-origin parcel air shift | Elimination of de minimis treatment for China-origin parcels reduced daily air cargo volumes by roughly 85%; broader U.S. business logistics costs stood at $2.4T, or 7.8% of GDP | Forced ecommerce shippers to choose among direct parcel, bonded storage, cross-dock flow, and domestic fulfillment with trigger-based economics | Logistics Management / CXTMS July 3 analysis |
| Intermodal service design | Maersk shifted about 1,000 weekly Southern California TEUs to Union Pacific, which now handles 77% of its regional volume; U.S. intermodal volume reached 5,820,002 units through May, up 1.8% YoY | Made rail-ramp choice a service-design decision affecting drayage, appointments, demurrage, downstream recovery, and customer promises | FreightWaves / Logistics Management / CXTMS July 3 analysis |
| Electric fleet dispatch | Electric truck market estimated at $89.37B in 2025 and $226.75B by 2029 at 26.21% CAGR; North America expected to grow from $22.74B to $64.65B at 29.86% CAGR | Turned charging windows, demand charges, battery health, route variability, grid limits, and dwell into transportation execution data | Mordor Intelligence / FreightWaves / CXTMS July 3 analysis |
| Contract logistics consolidation | CMA CGM agreed to acquire FedEx Supply Chain for $1.4B, nearly tripling CEVA's North American contract logistics operations; global freight and logistics market estimated at $6.68T in 2026 | Raised the value of independent shipper-side execution records as providers bundle warehouses, air, ocean, fulfillment, and returns | FreightWaves / Logistics Management / Mordor Intelligence / CXTMS July 2 analysis |
| Supplier carbon-data gap | Four out of five EcoVadis-rated companies have no documented process for deeper supply chain sustainability risks; 73% lack Scope 3 upstream emissions reporting; fewer than 1% report granular decision-grade sustainability data | Made carbon claims a shipment-evidence workflow across supplier records, emissions data, route choices, audit trails, and exception review | SupplyChainBrain / EcoVadis / CXTMS July 2 analysis |
| Dry van routing-guide stress | Dry van spot rates were up 31% YoY while volumes were sliding in the July 1 coverage signal | Proved routing guides need primary acceptance, tender depth, spot exposure, dwell, appointment, and budget triggers before invoices reveal the damage | FreightWaves / CXTMS July 1 analysis |
| Mandatory ELD insurance data | Progressive's Smart Haul requirement applies to a subset of small trucking applicants, while 2026 CVSA coverage showed one-in-three inspected trucks failed in the reported blitz signal | Turned ELD choice, telematics compatibility, driver data, safety files, and insurance renewal evidence into shipper-facing carrier qualification inputs | FreightWaves / CXTMS June 28 analysis |
| Reefer diesel tax recovery | Prime sued the IRS for $11M over reefer diesel fuel tax, highlighting credits smaller carriers can also pursue when documentation separates refrigeration fuel from propulsion fuel | Made fuel source, equipment assignment, temperature requirement, invoice detail, and tax status part of cold-chain freight-finance evidence | FreightWaves / CXTMS June 28 analysis |
| Export-control personal liability | A freight forwarding manager was sentenced for U.S. export-control violations | Raised denied-party screening, commodity classification, destination checks, escalation records, and document retention from back-office compliance to personal-liability controls | FreightWaves / CXTMS June 28 analysis |
| Fleet biometric consent exposure | A driver biometrics case against a ULH subsidiary expanded to class-action status | Made consent, retention, vendor access, jurisdictional rules, and audit trails core governance requirements for gate access, dashcams, safety coaching, timekeeping, and telematics programs | FreightWaves / CXTMS June 28 analysis |
| Paperless enforcement readiness | FMCSA's less-paper, more-enforcement push increased the value of digital carrier records covering driver qualification files, inspections, authority, insurance, ELD records, and roadside documentation | Shifted carrier compliance from document storage toward audit-ready exception queues and expiry alerts | FreightWaves / CXTMS June 28 analysis |
| Grocery supplier flow control | Kroger's supplier cost-optimization work linked direct sourcing to order cadence, consolidation, inbound appointments, packaging, dwell, and freight attribution | Proved supplier cost programs only protect margin when they control inbound flow, not just unit price | Supply Chain Dive / CXTMS June 28 analysis |
| Commodity-cost translation | J.M. Smucker tied temporary pricing relief to lower green coffee costs | Showed commodity relief still needs purchase timing, lot movement, inventory valuation, freight commitments, and landed-cost comparison before customer pricing changes are reliable | Supply Chain Dive / CXTMS June 28 analysis |
| Container data exchange standards | DNV joined DCSA+ Container Shipping Data Exchange | Confirmed ocean visibility is becoming an interoperability and data-contract problem across bookings, container events, documents, emissions records, and exception handoffs | SupplyChainBrain / DCSA coverage / CXTMS June 28 analysis |
| AI data-center power logistics | Chevron's Texas power deal for a Microsoft data center and turbine scarcity coverage showed AI infrastructure is creating heavy-equipment queues around power generation | Moved turbines, transformers, permits, cranes, route surveys, construction sequencing, and milestone visibility into AI supply-chain planning | SupplyChainBrain / CXTMS June 28 analysis |
| Sanctions-aware marketplace fulfillment | Alibaba's lawsuit over a U.S. military blacklist showed marketplace logistics exposure can begin at platform, seller, restricted-party, product-origin, and route-hold levels | Made sanctions screening, vendor status, shipment holds, route controls, and compliance exception review part of cross-border ecommerce fulfillment | SupplyChainBrain / CXTMS June 28 analysis |
| AI customs enforcement | CBP recovered about $35B in fiscal 2025 through entry summary reviews versus $667.6M the prior year; about $3.5B in new technology and enforcement funding is moving into the agency | Raised the standard for broker-ready commercial invoices, HTS support, supplier identity, origin evidence, and customs audit trails before freight moves | SupplyChainBrain / CXTMS June 27 analysis |
| Tariff refund workflows | FedEx has $800M in IEEPA tariff refunds slated for customers across more than 20M entries and hundreds of thousands of accounts; UPS is pursuing just under $500M across 2.5M eligible entries | Turned duty recovery into a shipment-level data, permission, broker-coordination, and finance reconciliation workflow | Supply Chain Dive / CXTMS June 27 analysis |
| USPS dimensional data reset | USPS lowers the dimensional divisor from 166 to 139 on July 12, rounds fractional measurements up, expands dimensional reporting, and can apply a $3 noncompliance fee; some sub-pound Ground Advantage changes rise as much as $2.04 | Made carton dimensions, WMS measurement capture, manifest quality, zone modeling, and parcel invoice audits immediate cost controls | Supply Chain Dive / USPS filings / CXTMS June 27 analysis |
| Fashion circularity data | Textile recycling market estimated at $6.62B in 2025, $7.25B in 2026, and $11.39B by 2031 at 9.48% CAGR; post-consumer waste represented 60.40% of the market and apparel 39.85% of demand | Made material composition, repairability, resale eligibility, disposal restrictions, packaging, and market-specific environmental taxes shipment attributes | SupplyChainBrain / Mordor Intelligence / CXTMS June 27 analysis |
| FedEx Freight vertical LTL strategy | Q4 revenue reached $2.4B, up 4.8% YoY, while average daily shipments fell 5.9%; revenue per shipment rose 11.5%, weight per shipment rose 3%, and revenue per hundredweight climbed 8.2% | Confirmed LTL carriers are optimizing around higher-margin vertical freight, forcing shippers to score service by healthcare, grocery, technology, appointment, claims, and accessorial profiles | Supply Chain Dive / CXTMS June 27 analysis |
| Freight vendor distress | Humano WARN notice affected 586 employees at an Avon, Indiana facility; SIMOS listed 574 affected employees at the same address; recent filings included trucking, warehouse, cold-storage, and contract-logistics providers | Made bankruptcies, WARN notices, tender acceptance drift, dwell, claims, invoice disputes, and communication gaps early-warning signals for carrier and warehouse partner risk | FreightWaves / CXTMS June 27 analysis |
| U.S. goods deficit freight signal | May U.S. merchandise-trade deficit widened 27.4% to $105.8B; goods exports fell 5.4%; imports rose 3.6%; capital goods imports were nearly 42% higher YoY; retail inventories rose 0.6% and wholesale inventories rose 4.3% YoY | Turned macro trade data into lane, drayage, warehouse labor, empty-container, inventory-placement, and contract-timing assumptions | SupplyChainBrain / Bloomberg / CXTMS June 27 analysis |
| South Carolina terminal pause | Leatherman Terminal operations pause Aug. 1; initial capacity is 700,000 TEUs with long-term expansion planned to 2.4M TEUs; Far East-U.S. West Coast spot rates rose 192% from late February to June 19 and East Coast rates rose 158% | Showed port capacity can become a flexible operating variable under trade uncertainty, requiring terminal-level gateway scenarios and drayage appointment monitoring | FreightWaves / Xeneta / Supply Chain Dive / CXTMS June 27 analysis |
| Retail inventory reduction | Duluth Trading cut total inventory 25% YoY in Q1, cut spring/summer seasonal inventory 42%, and improved store in-stock levels by 900 basis points | Proved SKU rationalization needs receipt calendars, DC throughput planning, carrier capacity, consolidation logic, and store replenishment controls to protect availability | Supply Chain Dive / CXTMS June 27 analysis |
| Quantum optimization readiness | Five cities create 120 possible routes, 10 cities create more than 3.6M possible routes, and 100-city complete search moves beyond practical classical evaluation | Reframed quantum as a constraint-density planning issue: teams need clean appointment, cost, capacity, routing, maintenance, and inventory data before future solvers can help | SupplyChainBrain / CXTMS June 27 analysis |
| Walmart first-mile consolidation | Walmart's Prepaid Consolidation Program lets suppliers ship under one national purchase order to one location, with Walmart distributing inventory across 42 regional distribution centers | Turned supplier readiness, case accuracy, appointment timing, SKU visibility, and price-per-case handling into a first-mile scorecard | Supply Chain Dive / CXTMS June 26 analysis |
| LTL repricing before peak | ABF announced a 5.9% general LTL rate increase effective June 22; ArcBest's asset-based tonnage rose 5% YoY while shipments declined 2% per day; long-distance LTL PPI was up 20% YoY in April | Showed LTL cost pressure is arriving through freight mix, density, terminal labor, and mode-shift behavior before broad demand recovery is obvious | Supply Chain Dive / Inbound Logistics / CXTMS June 26 analysis |
| Driver detention measurement | EdgeTrack signed a $600,000+ three-year deployment across seven hubs; platform records one-second GNSS telemetry and AI-classified detention events; ATRI estimates U.S. driver detention costs around $15.1B annually | Reframed detention from yard frustration into auditable accessorial, facility, carrier, and appointment evidence | Inbound Logistics / ATRI / CXTMS June 26 analysis |
| Freight broker liability evidence | More than 90% of motor carriers lack a formal FMCSA safety rating, and deeper reviews have reached only about 8% of the industry; some estimates put broker insurance cost exposure at 3x-5x for weaker risk profiles | Made carrier qualification, insurance, safety history, tender rationale, and exception approvals legal evidence rather than onboarding paperwork | Supply Chain Dive / CXTMS June 26 analysis |
| Parcel trailer-unloading robotics | FedEx expects first Berkshire Grey Scoop production units in 2026; robotics adoption rose to 48% of surveyed plants and warehouses in 2025 from 23% three years earlier; 64% used RaaS or SaaS robotics models | Moved automation upstream to the dock-door bottleneck where trailer unload pace controls induction timing, labor planning, detention, and parcel network flow | Supply Chain Dive / MHI / Peerless Research Group / CXTMS June 26 analysis |
| Interest-rate planning pressure | May inflation accelerated to 4.2% YoY while the Federal Reserve held rates steady at its June meeting | Turned capital cost into a supply chain planning variable across safety stock, warehouse commitments, supplier terms, mode mix, and expedite exposure | Supply Chain Dive / SupplyChainBrain / CXTMS June 26 analysis |
| Importer-of-record enforcement | June 3 order requires new restrictions within 180 days, including ownership disclosures, anticipated volumes, production-method information, broker due diligence, and tangible U.S. asset or bond requirements; informal Type 11 entry below $2,500 is restricted for foreign IORs | Made importer identity, entry method, broker file status, bond adequacy, and document completeness shipment-level visibility controls | Supply Chain Dive / CBP coverage / CXTMS June 26 analysis |
| Warehouse-rent network trigger | U.S. logistics real estate rents fell 4.5% YoY in 2025, coastal rents fell 7.6%, inland rents fell 3%, and Q4 vacancy fell to 7.4%; e-commerce represented about 20% of Prologis new leasing activity | Put rent, vacancy, parcel zones, drayage, labor, and service promise data into the same network-design model | Supply Chain Dive / Prologis / CXTMS June 26 analysis |
| Nuclear long-lead logistics | DOE earmarked $17.5B in low-interest loans for long-lead nuclear components across five SPV projects, each contributing $1B in private capital; early procurement could compress commercial operation timelines by up to three years | Moved project logistics risk upstream into purchase orders, supplier milestones, route surveys, permits, staging, inspections, and site readiness | Inbound Logistics / CXTMS June 26 analysis |
| Retail contracted optionality | Dollar Tree opened a 1M-square-foot Arizona DC serving about 700 stores and secured multi-year freight contracts covering about three-quarters of freight volumes; NRF/Hackett forecast June imports up 14.3% YoY and ocean booking cycles stretching from two to five weeks | Reframed freight contracts as governed optionality across ocean, domestic, DC placement, cube utilization, import timing, and spot-market exposure | Supply Chain Dive / NRF / Hackett Associates / CXTMS June 26 analysis |
| Air-capacity maintenance risk | EU regulators grounded five Airbus A380 jets on June 22 and ordered inspections for another 11 within 25 flight cycles; 173 A380 passenger jets were in service worldwide | Showed passenger-fleet maintenance advisories can become belly-cargo, premium-air, and time-critical freight planning signals at lane level | Supply Chain Brain / CXTMS June 25 analysis |
| Healthcare cold-chain control towers | UPS invested $48M in 27 temperature-controlled freight cross-dock facilities supporting 2-to-8 C, 15-to-25 C, and frozen conditions; temperature-sensitive biologics are projected to grow 8.3% CAGR to $39.1B by 2033 | Moved cold chain from static storage capacity toward handoff accountability, intervention speed, temperature proof, and custody evidence | Logistics Management / PharmaSource / CXTMS June 25 analysis |
| WMS cutover revenue exposure | Lands' End reported a Manhattan WMS implementation caused a one-week backlog; Q1 revenue fell 9% YoY and U.S. ecommerce net revenue fell 10%, even as the new system later cut standard-order delivery time roughly 20%-25% | Reframed WMS launches as order-to-delivery revenue events requiring transportation buffers, backlog thresholds, and executive launch controls | Supply Chain Dive / CXTMS June 25 analysis |
| Roadcheck compliance behavior | International Roadcheck runs about 60,000 inspections, roughly 20,000 per day; 2021 inspections put 16.5% of vehicles and 5.3% of drivers out of service, while research found a 1.8% reduction in vehicle violations around the event | Turned announced inspection blitzes into capacity, carrier-readiness, tender-timing, and lane-risk planning inputs | FreightWaves / University of Arkansas / University of Tennessee / CXTMS June 25 analysis |
| PFAS chain-of-custody exposure | Chemours agreed to a $450M federal PFAS settlement, including a $22.5M civil penalty, $90M over 15 years for discharge management, $60M for pollution controls, and $280M for drinking water | Made chemical logistics records part of environmental proof across sites, tanks, totes, waste streams, storage, carriers, transfers, and exceptions | Supply Chain Brain / CXTMS June 25 analysis |
| Pallet infrastructure shift | Global pallet market estimated above $77B and growing just under 6% annually; plastic pallets expected to grow from $7.1B in 2024 to $10.5B by 2033; plastic pallets can make 100+ trips versus about 25 for average wood-block pallets | Elevated pallets from disposable packaging to automation, reusable-pooling, asset-recovery, food/pharma traceability, and transportation exception infrastructure | Inbound Logistics / iGPS Logistics / Modern Materials Handling / CXTMS June 25 analysis |
| Free-delivery promise math | Consumers now expect free delivery in 2.7 days, down from 3.5+ days; more than 20% of demand is at risk when timing expectations are missed; 83% of retailers said home-delivery costs rose YoY and 64% said home delivery is not accretive to profitability | Made segmented promise logic, carrier diversification, minimum-order thresholds, and ETA accuracy a margin-preservation workflow | Logistics Management / AlixPartners / CXTMS June 25 analysis |
| Multi-carrier retail delivery | More than 90% of retailers use a carrier mix; about one-third work with four or more carriers; 55% use carriers outside FedEx, UPS, and USPS | Confirmed parcel execution has moved from national-carrier dependency toward portfolio orchestration with normalized tracking, claims, surcharges, and exception rules | Logistics Management / AlixPartners / CXTMS June 25 analysis |
| Hormuz ocean recovery window | Roughly 10% of global container shipping capacity was affected by the Strait of Hormuz blockade; Far East-U.S. West Coast spot rates rose 192% and Far East-U.S. East Coast rates rose 158% from late February to June 19 | Showed geopolitical recovery must be managed in network weeks through surcharge tracking, booking lead times, transshipment choices, and weekly freight forecasts | Supply Chain Dive / Xeneta / CXTMS June 25 analysis |
| Vendor-vetting evidence gap | Gartner forecast that 45% of organizations worldwide would experience software supply-chain attacks by 2025, a threefold increase from 2021 | Pushed logistics vendor risk from questionnaire collection toward access-tier mapping, SOC evidence, least privilege, recovery testing, and operational-continuity controls | Inbound Logistics / Gartner / CXTMS June 25 analysis |
| U.S. 3PL rebound | U.S. 3PL net revenue rose 5.1% in 2025 to $138.2B, while gross revenue increased 5.0% to $323.4B | Showed logistics outsourcing is recovering unevenly by segment, requiring DTM, ITM, dedicated carriage, and warehousing scorecards rather than one generic provider dashboard | Logistics Management / Armstrong & Associates / CXTMS June 24 analysis |
| Premium logistics M&A | Average transportation and logistics deal size increased 321% since 2023, from $340M to $1.43B; median deal values rose from 9.5x to 10.2x EBITDA in early 2026 | Proved scarce control points such as cold chain, cross-border infrastructure, reverse logistics, dedicated fleet, port access, and AI-enabled visibility are becoming strategic infrastructure | Logistics Management / PwC / CXTMS June 24 analysis |
| Apparel labor-risk pressure | EU cotton T-shirt import prices rose only from $2.15 to $2.67 from 2001 to 2024, implying a 3.1% annual real decline and roughly 50% real-price drop; Bangladesh supplied 61% of EU cotton T-shirt imports | Turned low unit price into a supplier-risk, documentation, milestone-volatility, and expedite-spend signal for apparel logistics teams | Supply Chain Dive / Public Eye / Clean Clothes Campaign / CXTMS June 24 analysis |
| Pharma trade-policy exposure | U.S. consumers pay about 3.9x German consumers for brand-name drugs; Germany's draft law would add a 3.5% rebate in early 2027, with a dynamic rebate potentially reaching 20% by 2030 | Made Section 301 trade-policy risk a cold-chain, customs, inventory-placement, and qualified-lane readiness problem | Supply Chain Dive / Federal Register / CXTMS June 24 analysis |
| Healthcare cold-chain complexity | UPS invested $48M in 27 temperature-controlled cross-dock facilities; about one in three newly approved drugs is a biologic, and 85%+ of biologics need temperature control | Reinforced that pharma contingency routing requires validated temperature capability, custody evidence, and inventory triggers before policy or customs shocks hit | Logistics Management / CXTMS June 24 analysis |
| Manufacturing demand rebound | ISM expects manufacturing revenue up 8.4% in 2026 and services revenue up 8.6%; 82% of manufacturing respondents expect higher revenue, while production capacity is projected up 9.7% | Showed freight demand recovery is likely to return unevenly by sector, lane, commodity, and supplier rather than as a smooth market-wide volume wave | Logistics Management / ISM / CXTMS June 24 analysis |
| Mexico Interoceanic Corridor | A 2025 Hyundai/Glovis pilot moved 900 vehicles through the route; the rail leg crossed the isthmus in roughly nine hours and the ocean-to-ocean transfer was benchmarked around 72 hours | Made Mexico's corridor a serious optionality layer for selected automotive, industrial, and Asia-to-U.S. East Coast flows if execution reliability catches up | Supply Chain Brain / CXTMS June 24 analysis |
| Harley-Davidson reshoring | 100,000+ motorcycles expected at York, Pennsylvania, in 2027, with Revolution Max engine and related model production shifting to U.S. facilities before model year 2028 | Showed production geography is now a freight-planning variable across inbound sequencing, domestic carrier capacity, packaging loops, and dealer replenishment | Supply Chain Dive; Harley-Davidson coverage |
| U.S. manufacturing reshoring context | $500B+ in private-sector U.S. chipmaking commitments by July 2025, with domestic capacity projected to triple by 2032 | Reinforced that reshoring waves compete for industrial real estate, skilled labor, project freight, and regional warehousing capacity | Deloitte 2026 Manufacturing Industry Outlook |
| U.K. deforestation compliance | Roughly 13,500 hectares of deforestation tied to U.K.-linked cattle products, soy, oil palm, cocoa, coffee, and rubber in 2024; footprint up 39,300+ hectares since the 2021 Environment Act | Turned origin proof into shipment-level procurement, customs, and logistics evidence rather than annual-report sustainability text | SupplyChainBrain / Global Witness |
| AI freight audit | 1% to 5% freight spend recoverable | Turned audit into a direct margin lever | SupplyChainBrain analysis, covered by CXTMS |
| Customs AI straight-through processing | 21% of 13,000 daily packages in March 2025, then 90% of 112,000 daily packages by September 2025 | Proved agentic AI could remove manual touches in formal-entry workflows | Supply Chain Dive, Reuters, UPS coverage |
| Accessorial exposure | 20% to 30% of total parcel spend, up to 40% in peak | Made line-item audit and exception handling critical | SmartKargo / IndexBox |
| AI inventory optimization | 20% to 30% inventory reduction | Proved AI could improve service and working capital at once | McKinsey |
| AI-driven logistics savings | 5% to 20% logistics cost reduction | Showed operational AI was paying for itself | McKinsey |
| AI planning adoption | 70% of large organizations expected to adopt AI-based supply chain forecasting by 2030 | Showed planning AI is moving mainstream | Gartner |
| Agentic AI in SCM software | 60% adoption by 2030, up from 5% in 2025 | Confirmed closed-loop AI is moving beyond pilots | Gartner |
| AI in logistics market | $307B by 2032 | Confirmed scale of investment and vendor momentum | Market analysis cited in CXTMS coverage |
| Supply chain AI urgency | 24% of leaders now call AI transformational, while 48% say its impact will be significant or greater, up 25 points year over year | Showed AI has moved from hype to board-level operating priority | MHI and Deloitte, via Modern Materials Handling |
| Transportation AI maturity | 96% of transportation leaders using AI, but mostly in analytics (77%), route/load optimization (63%), and forecasting (56%) | Showed AI is mainstream, but often still trapped in support workflows instead of execution | SupplyChainBrain |
| Warehouse automation funding | $2.26B+ in Q1 2026 | Marked a major capital shift toward physical ops automation | Standard Bots, Ellty |
| Human-optional warehouse forecast | 50% of new warehouses in developed markets will be human-optional by 2030 | Confirmed automation is becoming a facility-design assumption, not a pilot project | Gartner |
| Installed warehouse robot base | 4.7M robots across 50,000+ facilities globally | Showed automation has moved from pilots into installed operating infrastructure | DHL / SVT Robotics coverage, Mordor Intelligence |
| U.S. warehouse robotics market | $34.17B in 2026, $65.74B by 2031 | Showed automation is a long-term infrastructure buildout | Mordor Intelligence |
| Robotics integration speed | Middleware cut robot integration from weeks to hours, about 12x faster in DHL coverage | Reinforced that orchestration and middleware are now strategic bottlenecks | SVT Robotics / DHL coverage |
| Robotics execution gap | 44% of operators deployed robotics, but only 34% of senior leaders were fully satisfied | Proved workflow redesign and change management are now bigger bottlenecks than hardware access | DHL Supply Chain survey, cited by Modern Materials Handling |
| 3PL robotics investment share | 63% of warehouse robotics investment | Put 3PLs at the center of automation adoption | 360 Research Reports |
| Fulfillment improvement from robotics | 33% faster fulfillment, 41% accuracy improvement | Quantified warehouse automation ROI | 360 Research Reports |
| Practical depalletizing ROI | 45M+ pounds of annual manual handling removed, 9+ cases per minute, ROI in about 18 months | Showed warehouse automation value is shifting toward ugly, high-friction inbound tasks | Modern Materials Handling |
| Warehouse digital twin payoff | Inventory accuracy doubled from a 50% bin baseline, while cycle counting speed improved 40% | Confirmed digital twins are finally earning their keep as practical warehouse tools | Modern Materials Handling |
| Food network AI planning | 70+ dry and refrigerated sites connected in one rollout | Showed AI planning is moving from pilot mode into network-scale execution | Supply Chain Dive, Hormel coverage |
| Hershey supply chain tech targets | $50M productivity gains and $100M inventory reduction over two years | Proved decision intelligence can hit both working capital and execution speed | Supply Chain Dive |
| Rail market momentum | 1.8% volume gain in first 12 weeks of 2026 | Signaled intermodal and rail re-entry into shipper strategy | AAR |
| LMI inversion | Capacity at 39.2, pricing at 89.4, utilization at 62.9 in March 2026 | Showed freight tightening was no longer theoretical | FreightWaves / Logistics Managers' Index |
| Future freight pressure | Capacity expected at 34.9, pricing at 93.0 | Suggested volatility will continue through contract cycles | FreightWaves / Logistics Managers' Index |
| LTL pricing May 2026 | 7.2% YoY PPI increase March 2026; mid-single-digit May 2026 GRI; TRAFFIX treating current rates as new floor | Confirmed LTL entered new rate discipline phase with structural capacity headwinds | Cass, C.H. Robinson, TRAFFIX / CXTMS coverage |
| Digital logistics market | $55.57B in 2026, projected to $150.79B by 2031 at 22.1% CAGR | Confirmed buyers are funding execution platforms, not passive visibility dashboards | Mordor Intelligence / CXTMS May 12 coverage |
| SCM software market | $36.39B in 2026, projected to $56.01B by 2031 at 9.01% CAGR | Showed platform growth is shifting RFPs toward integration depth, exception handling, and workflow ownership | Mordor Intelligence / CXTMS May 12 coverage |
| Dock and yard manual-risk signal | 40.3% of facilities still cite manual processes as a leading dock bottleneck; 59.1% report dock scheduling or staging issues; 55.7% report yard visibility gaps | Elevated dock and yard management from warehouse housekeeping to transportation execution risk | Logistics Management / SupplyChainBrain / CXTMS May 12 coverage |
| Carrier safety execution signal | Roadcheck's 72-hour enforcement window and 21.6% historical vehicle out-of-service rate make safety data a routing-guide input | Turned CSA, maintenance, and inspection risk into capacity-reliability scoring | CVSA / FMCSA / CXTMS May 12 coverage |
| P&G Supply Chain 3.0 economics | $1.5B productivity target, 50% forecast-error reduction, and 15% inventory reduction tied to integrated rollout | Validated integration-first automation over disconnected robotics theater | Supply Chain Dive / CXTMS May 12 coverage |
| Adani Ports terminal software | Up to $100M for the first two Kaleris AI terminal-operating-software phases across 15 container terminals and nine ports; part of an $850M technology and decarbonization allocation | Shows port automation is shifting from equipment automation into berth, yard, gate, drayage, and exception execution control | SupplyChainBrain / CXTMS June 17 coverage |
| Grocery Outlet AI ordering | Afresh rollout across roughly 550 stores in 16 states; users average 3% sales lift, 25% shrink reduction, and 94% adherence to targets | Proved AI replenishment value depends on store-level assortment volatility, freshness windows, and execution follow-through | Supply Chain Dive / CXTMS June 17 coverage |
| Kimberly-Clark simplification | Five-year $3B productivity program, including a $1B automated distribution center; California DC disruption expected to create a 70-to-80-basis-point shipment headwind | Reinforced that supply-chain productivity comes from value-stream simplification, density discipline, and automation tied to network design | Supply Chain Dive / CXTMS June 17 coverage |
| TMS market growth | $9.71B in 2025 to $14.89B by 2030 at 8.93% CAGR; cloud deployment cited at 61.23% share with 9.96% CAGR | Reinforced that AI-over-legacy orchestration is becoming the practical upgrade path for transportation teams | Mordor Intelligence / CXTMS June 18 coverage |
| Medical-device logistics proximity | Boston Scientific's planned $138M, 500,000-square-foot Indiana DC near major manufacturing operations | Showed regulated distribution is moving closer to manufacturing, traceability, and service-execution control | Supply Chain Dive / CXTMS June 18 coverage |
| Port of Los Angeles imbalance | May volume of 840,165 TEUs, imports up 26% while exports fell 10%; year-to-date volume up 1.4% to 4,119,869 TEUs | Made import/export imbalance and empty-equipment flow a peak-season planning issue, not just a port statistic | Port of Los Angeles / SupplyChainBrain / CXTMS June 18 coverage |
| U.S. logistics cost benchmark | $2.4T in U.S. logistics costs, equal to 7.8% of GDP, after $2.6T and 8.7% in the prior benchmark | Put adaptability on the KPI dashboard because volatility is now large enough to move national cost structure | CSCMP State of Logistics / Logistics Management / CXTMS June 18 coverage |
| West Coast port labor exposure | 22,000 ILWU workers under a contract running through 2028 | Pulled automation trust, labor continuity, and terminal-ownership risk into long-range supply chain scenario planning | SupplyChainBrain / CXTMS June 18 coverage |
| Animal-welfare supplier risk | USDA enforcement actions in fiscal 2024 produced more than $1M in penalties across dozens of facilities | Turned animal-welfare standards into supplier governance, transportation evidence, and exception-workflow risk | SupplyChainBrain / CXTMS June 19 coverage |
| AI procurement compression | Bristol Myers Squibb cut RFP cycle time from six-to-nine months to less than 30 days; only 10% of CFOs fully trust their data quality | Showed AI value can start with governed workflows and imperfect-but-centralized data rather than waiting for perfect records | Supply Chain Dive / RGP / CXTMS June 19 coverage |
| Committed freight marketplace adoption | More than 13,000 committed-freight bids from over 3,000 carriers, with carriers bidding twice as often after BidBoardX launched | Signaled that truckload coverage is moving from reactive spot recovery toward structured lane commitments | Logistics Management / CXTMS June 19 coverage |
| EU unsold-goods pressure | Large companies barred from destroying unsold clothes, shoes, and fashion accessories from July 2026; smaller firms follow in 2030; 4%-9% of European clothes are estimated to be destroyed before use | Made circular logistics, disposition routing, and inventory classification a margin and compliance workflow | SupplyChainBrain / CXTMS June 19 coverage |
| FedEx export fuel surcharge change | At $3.31/gallon jet fuel, export surcharge moves from 34.25% to 37.75%, roughly $35 more per $1,000 in fuel-applicable charges | Proved surcharge tables need active modeling, not post-invoice surprise management | Supply Chain Dive / ShipScience / CXTMS June 19 coverage |
| Logistics leadership scope creep | Average logistics salary reached $126,400; 76% say functions performed increased over two-to-three years; 38% plan continuing education | Confirmed logistics managers are becoming technology, risk, finance, and capital-planning operators at once | Logistics Management / CXTMS June 19 coverage |
| Fertilizer timing exposure | Fertilizer accounts for 33%-44% of corn operating costs and 34%-45% of wheat operating costs | Connected food-price pressure to port, rail, barge, storage, cooperative, and rural trucking execution windows | Inbound Logistics / USDA ERS / CXTMS June 19 coverage |
| UPS parcel AI scale | FedEx benchmark cited in parcel-AI coverage: 100,000 first-mile and last-mile routes optimized daily, more than 50% of core workflows targeted for AI by 2028, 17,000 potential downtime hours prevented, and $10M saved annually | Reframed parcel visibility as exception prevention, returns prioritization, and avoidable-touch reduction | Logistics Management / Supply Chain Dive / CXTMS June 20 coverage |
| AI workforce demand | Supply chain jobs requiring AI skills rose 387% from Q1 2023 to Q1 2026; Gartner analyzed 35M+ postings and nearly 600,000 supply chain roles; 58% of AI-skill roles were mid-senior level | Confirmed AI adoption is now a workforce design and decision-rights problem, not just a software purchase | Gartner / Modern Materials Handling / CXTMS June 20 coverage |
| Continuous inventory drones | GNC moved from twice-yearly audits of 40,000 locations to drones flying seven-to-eight times daily; Indianapolis counts nearly 31,000 locations per month; inventory control staffing shifted from 20 to 13 people | Showed cycle counting is becoming continuous operational control for replenishment, promise accuracy, and exception prevention | Logistics Management / CXTMS June 20 coverage |
| Electric drayage corridor density | Long Beach-Central Valley corridor spans about 150 miles and moves 300,000+ containers annually; Lincoln ordered 300 Tesla Semis; Long Beach has 102 charging stations with 92 more expected | Turned drayage decarbonization into a route-design, appointment, charging, and container-flow orchestration problem | Supply Chain Dive / Logistics Management / CXTMS June 20 coverage |
| Rail-served packaging optionality | International Paper's Rankin County facility is planned at 468,000 square feet with CPKC single-line North American access; AAR reported 230,959 carloads and 289,447 intermodal units for the week ending June 13 | Reinforced that packaging plants need rail, truck, raw-material, outbound, and cross-border optionality designed in from the start | Supply Chain Dive / AAR / Logistics Management / CXTMS June 20 coverage |
| Southeast Asia air-cargo volatility | FedEx's Guangzhou Asia hub sorts 36,000 packages per hour; May global air cargo spot rates rose 41% YoY to $3.40/kg while volumes rose only 4%; Northeast Asia-North America spot rates rose 39% and Southeast Asia-North America rose 33% | Made gateway diversification and corridor-level air-cargo pricing a forwarder planning requirement | Supply Chain Dive / Xeneta / CXTMS June 20 coverage |
| Brownfield automation capex | Walmart's New Braunfels phase covers 96,715 square feet and $8M; Walmart is retrofitting 23 of 42 U.S. regional DCs and more than 60% of U.S. stores receive some freight from automated DCs | Showed warehouse modernization is increasingly phased capex inside existing network nodes, not only new greenfield facilities | Supply Chain Dive / Inbound Logistics / CXTMS June 20 coverage |
| Retail demand sensing | May retail sales reached $763.7B, up 0.9% MoM and 6.9% YoY; non-store retailers rose 12.2% YoY; electronics rose 11.59%, clothing 10.25%, and health/personal care 8.87% | Converted sales growth into SKU, node, labor, carrier, parcel-zone, and service-promise planning pressure | Logistics Management / CNBC-NRF Retail Monitor / CXTMS June 20 coverage |
| Humanoid robotics readiness | Automate 2026 expects 50,000+ attendees and 1,000 exhibitors; IFR estimates advanced gripping and digital integration can reduce engineering time by up to 30% | Kept robotics evaluation grounded in safety, dexterity, integration effort, exception recovery, and ROI rather than spectacle | Modern Materials Handling / IFR / CXTMS June 20 coverage |
| AI barcode-scanning exception control | Warehouse automation market projected from $34.17B in 2026 to $65.74B by 2031 at 13.98% CAGR; automation software projected at 14.87% CAGR; legacy integration complexity can overrun budgets by 30% and timelines by up to 12 months | Turned barcode reads into exception prevention, inventory confidence, receiving proof, and freight-documentation quality | Modern Materials Handling / Mordor Intelligence / CXTMS June 21 coverage |
| Air-freight mode-shift trigger | Global air cargo spot rates rose 41% YoY to $3.40/kg in May; volumes rose 4%; dynamic load factor reached 61%; Northeast Asia-North America spot rates rose 39% and Southeast Asia-North America rose 33% | Showed premium freight decisions need shipment-level triggers rather than broad panic buying | Supply Chain Dive / Xeneta / CXTMS June 21 coverage |
| Inland intermodal capacity | BNSF Barstow International Gateway approved as a $1.5B-$4B private investment across 4,500 acres with capacity for 60 trains; projected to eliminate 205M truck miles in 2028, 269M in 2033, and 312M in 2048 | Made inland rail capacity a long-cycle distribution-network design choice for West Coast import flows | FreightWaves / BNSF / CXTMS June 21 coverage |
| Retail sortation discipline | Burlington's Georgia DC covers 2M square feet, includes 25+ miles of conveyor and automation, and is expected to create 1,500 jobs; the retailer plans about 115 new stores and another 2M-square-foot Arizona DC for 2028 | Showed retail speed depends on sortation logic, yard-to-store visibility, software discipline, and throughput control | Supply Chain Dive / CXTMS June 21 coverage |
| Automated rail-track inspection | FRA approved a five-year ATI waiver; CSX plans July 1, 2026 use across 3,000+ route miles and 4,500+ track miles; AAR says ATI can reduce track geometry defects by up to 90% in some cases | Moved rail reliability from after-the-fact service metrics toward infrastructure-health signals in shipper scorecards | FreightWaves / FRA / AAR / CXTMS June 21 coverage |
| Hazmat language compliance exposure | FreightWaves found 200 carriers cited for both English-language proficiency and hazmat violations, totaling 3,000+ English proficiency citations and 600+ hazmat out-of-service orders; one cited tank carrier had 98 English proficiency and 86 hazmat violations | Made hazmat carrier qualification, emergency documents, tender controls, and audit trails a shipment-level compliance requirement | FreightWaves / FMCSA inspection-record review / CXTMS June 21 coverage |
| LTL scorecard expansion | Transportation spend typically consumes 7%-10% of sales revenue; Q1 2026 LTL shipment weight rose 3.8% QoQ while cost per shipment rose 3.0%; LTL rate-per-pound index projected at 68.4% above January 2018 baseline | Proved rate per hundredweight is too narrow without damage, density, delay, reclass, accessorial, and appointment metrics | Inbound Logistics / Logistics Management / FreightWaves / CXTMS June 21 coverage |
| Cass cost-per-shipment pressure | May shipments fell only 1.2% YoY and rose 3.0% sequentially; expenditures rose 7.5% YoY and 5.3% sequentially; Cass reflects $37B in paid freight expenses across large shippers | Reframed market recovery around cost per shipment, charge mix, carrier behavior, and preventable exceptions | Logistics Management / Cass Freight Index / CXTMS June 21 coverage |
| WMS selection discipline | 49% of surveyed firms use WMS or inventory management; 27% plan to evaluate, buy, or upgrade within 24 months; 75% are cautious or late adopters; expected software spend fell to $512,500 from $544,450; user acceptance was the top challenge at 55% | Made workaround mapping, integration testing, user adoption, and transportation impact the real pre-RFP work | SupplyChainBrain / Modern Materials Handling / Inbound Logistics / CXTMS June 21 coverage |
| Accepted truckload volume signal | May DAT TVI fell across van, reefer, and flatbed while spot rates rose; Cass shipments rose 3.0% sequentially and expenditures rose 7.5% YoY | Showed procurement teams need accepted-volume, tender, spot, and paid-invoice signals together before calling a market turn | FreightWaves / Logistics Management / Cass / CXTMS June 22 coverage |
| AI hallucination control pressure | Supply chain AI-skill job postings rose 387% from Q1 2023 to Q1 2026; 58% of AI-skill roles were mid-senior level | Made source verification, confidence scoring, internal knowledge grounding, and human oversight mandatory before logistics AI gains authority | SupplyChainBrain / Inbound Logistics / Gartner / CXTMS June 22 coverage |
| Autonomous freight operating envelope | PepsiCo/Gatik operates 41 autonomous trucks across Texas, Arizona, and Arkansas; DHL Singapore autonomous shuttles run about 40 trips and 28 km per day with up to three pallets or 1.5 tons per vehicle | Shifted autonomous freight evaluation from demo miles to lane design, payload fit, dock timing, fallback capacity, and exception logic | Supply Chain Dive / FreightWaves / CXTMS June 22 coverage |
| Carrier qualification liability | $52.1M California nuclear verdict after freight was subcontracted twice; alleged hours-of-service violation became part of trial record | Raised carrier selection from a pass-fail authority check to an auditable workflow covering safety, subcontracting, insurance, and tender controls | FreightWaves / CXTMS June 22 coverage |
| Strait of Hormuz cost exposure | 12.5M barrels of oil moved through Hormuz after June 17, but roughly 80 mines still needed clearance; the strait handles about 20% of world petroleum and LNG flows | Turned maritime disruption into surcharge governance, energy exposure, and contract-trigger design rather than a one-time routing issue | SupplyChainBrain / Logistics Management / CXTMS June 22 coverage |
| SCaaS market | $71.5B global market in 2026, projected at 21% CAGR through 2033; cloud-native TMS implementation costs roughly 70% below comparable 2019 on-prem deployments | Shifted the build-versus-buy decision toward platform outsourcing for mid-market shippers that need speed, integrations, and lower IT drag | Mordor Intelligence / CXTMS June 17 coverage |
| AI factory logistics | Industrial robot cells can run near 24/7 with 98% uptime, while software-driven deployment timelines are compressing from 6-9 months to 8-12 weeks | Showed AI factories still fail on physical-flow basics when parts, packaging, maintenance, and inbound milestones are not governed | Modern Materials Handling / CXTMS June 17 coverage |
| Section 232 derivative tariff pressure | 25% steel and 50% aluminum derivative tariffs, with shipment-timing volatility visible in import flows | Made HS classification, supplier declarations, and landed-cost modeling freight cost controls | U.S. trade policy coverage / CXTMS May 12 analysis |
| Upstream inventory buffer strategy | Target's Houston receive center represents a $265M, 1.2M-square-foot node designed to process millions of cartons upstream | Showed retail resilience is moving from store-level safety stock to regional inventory-buffer orchestration | Supply Chain Dive / CXTMS May 12 coverage |
| Trans-Pacific capacity management | Rates rose despite soft demand as blank sailings removed effective capacity; some rate moves reached high-single-digit weekly changes | Proved carrier capacity discipline can overpower weak volume signals | FreightWaves / CXTMS May 12 coverage |
| Truckload pricing | 20%+ year-over-year spot increase, NTI at $2.89/mile; 16–17% YoY projected for 2026 | Forced reevaluation of modal breakpoints | ACT Research, FreightWaves, C.H. Robinson |
| Multimodal divergence — ocean | Global fleet +3.6% vs. demand +3% in 2026; spot rates 30–40% below 2024 peaks | Created a buyer's window for ocean procurement in Q2 | Xeneta, C.H. Robinson |
| Multimodal divergence — trucking | Spot rates 20%+ above year-ago; tender rejections rising; EPA 2027 pre-buy tightening equipment supply | Forced early tender and relationship-first carrier strategy | ACT Research, DAT |
| Multimodal divergence — air cargo | Some routes up 70% year over year; Middle East capacity down 50%+; Asia-Europe +30% recently | Made air a crisis tool again on specific lanes | Reuters, Air Cargo Week, WorldACD |
| Tariff rerouting scale | $300B in goods annually rerouted through Southeast Asia and Mexico to avoid US tariffs | Confirmed rerouting as a structural feature of the tariff environment, not a temporary workaround | Bloomberg, April 2026 |
| CBP penalty collections | $216B+ in duties, taxes, and fees collected in fiscal year 2025 | Showed CBP's enforcement capacity and scale | CBP |
| EAPA sector duty differentials | Antidumping duties of 119–478% and countervailing duties of 31–679% on specific Chinese goods | Explained why rerouting economic incentives will persist until enforcement catches up | CBP EAPA actions |
| IEEPA criminal exposure | Up to 20 years for willful tariff evasion under IEEPA | Escalated compliance risk from civil to criminal territory | Dynamis LLP, via CXTMS coverage |
| US goods/services deficit | $57.3B in February 2026, up $2.7B from January | Confirmed trade flows redirecting rather than collapsing | US Census Bureau |
| Connected worker platforms | $8.62B in 2025, $20.18B by 2030 at 18.5% CAGR; $24.81B 2030 alternate estimate; 1,500+ DHL operators on voice picking; 25-40% task time reduction; 35% error reduction; 99.9% voice picking accuracy | Confirmed frontline task orchestration over hardware is where value has shifted | MarketsandMarkets, DHL, Raymond West / CXTMS coverage |
| Visibility platform market | $3.08B in 2026, $25–40B by mid-decade | Marked unified platforms replacing siloed point tools | Business Research Insights, FutureMarketInsights |
| WMS market size | $4.77B in 2026, $10.89B by 2031 at 17.98% CAGR; $4.57B in 2025 to $10.04B by 2030 (M&M); 23.2% CAGR through 2033 for T&L segment | Confirmed WMS as fastest-growing supply chain execution category | Mordor Intelligence, Markets and Markets / CXTMS coverage |
| WMS e-commerce search signal | "warehouse management system for ecommerce" trending at 300 on Google Trends | Confirmed e-commerce complexity has outpaced legacy WMS capabilities | Google Trends / CXTMS coverage |
| WMS returns cost exposure | 15–30% of total fulfillment cost for some e-commerce categories | Elevated returns workflow automation from back-office concern to WMS priority | Industry analysis / CXTMS coverage |
| Predictive ETA accuracy | Predictive ETA models can materially outperform carrier-provided ETAs when trained on lane, mode, and exception history | Showed predictive accuracy is the real visibility differentiator | CXTMS coverage |
| Empty container repositioning cost | $15B to $20B annually | Highlighted a huge structural inefficiency in ocean freight | Container Trades Statistics, industry analysis |
| Avoidable repositioning cost | Roughly 30% avoidable | Created a case for interchange marketplaces and optimization | BCG |
| Interchange savings | $200 to $400 per container swap | Quantified value of digital coordination | Industry data |
| Trade imbalance | 3.3:1 by end of 2025 | Showed why equipment imbalance worsened | Container Trades Statistics |
| Logistics M&A | $50B+ in Q1 2026 deal activity | Redrew the competitive map for shippers | PwC, FreightWaves, deal coverage |
| Echo + ITS platform | $5.2B annualized revenue | Exemplified platform-scale 3PL consolidation | PR Newswire, CXTMS coverage |
| WWEX + Auctane | 70M annual shipments, 130,000 customers | Showed software plus freight platform convergence | FreightWaves |
| FedEx Freight spin-off | $8.9B revenue, 15.8% margin, 355 terminals, 26,000 dock doors | Highlighted structural change in LTL carrier strategy | Supply Chain Dive, FedEx reporting |
| Rail merger scale | 50,000+ route miles across 43 states | Showed how infrastructure concentration could reshape shipper leverage | Logistics Management |
| Truck-to-rail conversion claim | 2M truckloads removed annually, 350 trucks per day in Chicago | Quantified why rail operators are selling network consolidation as efficiency tech | SupplyChainBrain |
| Trucking capacity cliff | ATA driver shortage at 82,000, projected 160,000 by 2028 | Showed structural supply contraction, not a temporary cycle | ATA |
| Driver regulatory removal | ~34,000 net drivers lost annually from FMCSA non-domiciled CDL restrictions | Confirmed regulatory changes are now a primary capacity removal mechanism | FMCSA, J.B. Hunt analysis |
| EPA 2027 pre-buy impact | $8,000–$25,000 per truck in incremental costs | Pulled 2026 equipment demand forward, tightening supply | FleetOwner, ACT Research |
| Class 8 orders surge | 156% year-over-year in February 2026, 46,200 units | New equipment takes 12–18 months to translate into operational capacity | ACT Research |
| Supply chain talent gap | 1.2M executive roles unfilled across G7 | Made augmentation tech more important | JRG Partners |
| Heavy-duty repair understaffing | 54% of shops understaffed | Turned maintenance capacity into a supply chain risk | Fullbay |
| Heavy-duty labor rates | $149/hour median, wages up 14.1% to $36.50/hour | Showed fleet uptime risk was becoming more expensive | Fullbay |
| One-hour delivery pressure | 80% expect same-day, 61% expect delivery in 1 to 3 hours | Raised the fulfillment speed bar for e-commerce | NRF and industry research cited in CXTMS |
| Distributed fulfillment scale-up | Ulta expanded ship-from-store from about 500 stores to 1,000+ in one year | Showed stores can become execution-grade fulfillment nodes without major DC expansion | Supply Chain Dive, Ulta coverage |
| Retail growth under orchestration | Ulta Q4 sales up 11.8% to $3.9B, full year up 9.7% to $12.4B | Showed why retailers are investing in smarter order-routing logic | Supply Chain Dive |
| Walmart automation savings | 20% lower unit costs year over year, 30%+ network cost reduction target | Proved automation concentration can justify network rationalization | Supply Chain Dive |
| NextGen transfer economics | $7,500 transfer incentive in Walmart network redesign | Showed labor mobility is part of automation-era network design | Supply Chain Dive |
| Global supply chain pressure | NY Fed GSCPI rose to 0.68 in March 2026 from 0.54 in February | Showed normalization is fragile and volatility can return quickly | Reuters, New York Fed |
| Corridor rewiring | $165B+ in trade shifted away from the US-China corridor in 2025 | Confirmed network design is now corridor-specific, not country-level | McKinsey |
| Rare earth concentration | China accounts for 60%+ of extraction and about 90% of refining | Explained why diplomatic hotlines now matter to freight planning | McKinsey, Reuters |
| Critical minerals policy response | South Korea designated 17 critical minerals and committed 250B won ($172M) | Showed governments are building logistics resilience around material bottlenecks | Reuters |
| Humanitarian funding gap | U.N. sought $45B, received only 5%, after releasing $110M from emergency reserves | Reinforced the cost of reactive logistics under constrained resources | Reuters, ALAN coverage |
| Resilience priority | 30% of CFOs made resilience top priority | Elevated risk tech from optional to essential | PYMNTS |
| Risk/compliance priority | 35% cited risk management and compliance as top focus | Reinforced compliance-tech demand | PYMNTS |
| Tariff disruption prevalence | 82% of companies reported tariff-driven operational disruptions in 2025 | Confirmed tariffs as the defining supply chain shock of the era | McKinsey 2025 Risk Pulse |
| Executive disruption exposure | 9 in 10 executives encountered at least one significant supply chain disruption in 2024 | Showed disruption had become the operating environment, not an exception | McKinsey 2025 Risk Pulse |
| Tariff front-loading | China's exports up 21.8%, surplus at $213.6B | Illustrated how trade policy distorted freight demand | Reuters |
| Air cargo compliance | Nearly 100 IATA manual changes in 2026 cycle | Showed regulation complexity is rising fast | IATA |
| Lithium battery air cargo | 25% year-over-year increase | Explained why battery compliance became a major workflow | IATA CargoIS |
| Semiconductor logistics specialization | UPS invested $100M in its Taiwan hub, with 80% of traffic tied to high-tech freight | Showed premium, verticalized logistics capabilities are becoming strategic | Supply Chain Dive |
| First Sale customs valuation leverage | Duty could be based on a $20 upstream sale instead of an $80 middleman resale in qualifying imports | Showed tariff mitigation now depends on document integrity and transaction-chain visibility | Supply Chain Dive |
| Forwarder technology gap | 38% of shippers are only slightly satisfied or not satisfied with forwarder technology; only 45% of forwarders automate documentation, compliance, and invoicing | Showed digital immaturity is turning into a commercial disadvantage in forwarding | SupplyChainBrain |
| Forwarder cyber blind spot | 44% prioritize forecasting and visibility, but only 11% prioritize cybersecurity and compliance | Proved connectivity is expanding faster than governance in forwarding operations | Inbound Logistics |
| Air cargo emergency flexibility | 71.6M tonnes and $158B revenue forecast for 2026 | Confirmed air freight remains the system's shock absorber during disruption | IATA / Logistics Management |
| Air cargo disruption premium | Middle East capacity down 50%+, Vietnam-Europe rates at $6.27/kg | Proved disruption now changes routing architecture, not just rate cards | Reuters / WorldACD |
| Tanker squeeze volatility | U.S. Gulf Coast vessel availability fell 41%; Suezmax and Aframax earnings surged above $300,000/day from about $60,000 | Showed energy logistics can transmit route shocks into broader freight economics very fast | Reuters / The Signal Group |
| FMCSA safety grant package | $217M in 2026 grants, including about $89.4M for CDL program modernization; applications close June 17, 2026 | Shows roadside enforcement, CDL data, and carrier governance are becoming connected compliance infrastructure | FreightWaves / FMCSA, CXTMS May 22 coverage |
| Highway reauthorization | Five-year surface transportation bill worth roughly $580B, including $376B for FHWA, $64.7B for FRA, $5B for FMCSA, and $150M for truck parking | Made corridor reliability, planned closures, truck parking, bridge work, and drayage access core inputs to transportation planning | Logistics Management / CXTMS June 17 coverage |
| Georgia Ports inland-port strategy | Savannah handled 443,650 TEUs in April, down 14% YoY; Gainesville Inland Port is a $134M project designed to shift 26,000 containers from truck to rail in year one and up to 200,000 annually at full build-out | Proved inland ports are resilience infrastructure, not just volume-growth bets | FreightWaves / Georgia Ports Authority, CXTMS May 22 coverage |
| GM renewable-energy planning signal | GM says U.S. sites now use 100% renewable electricity; global electricity matching reached 70%; Scope 1 and 2 emissions are down 52% since 2018 while revenue rose 26% | Turned facility energy sourcing into procurement, supplier-risk, and freight-planning data | Supply Chain Dive / GM, CXTMS May 22 coverage |
| Autonomous forklift adoption economics | Market grows from $3.21B in 2026 to $5.72B by 2031 at 12.23% CAGR; logistics and warehousing held 49.05% share; annual maintenance can reach $15,000 per truck | Showed lift-truck automation ROI depends on operator workflow, integration, and uptime governance | Mordor Intelligence / Modern Materials Handling, CXTMS May 22 coverage |
| Truck-stop safety and driver retention | Truck stops account for 23% to 30% of reported harassment incidents against women drivers; 42% of affected women do not report incidents; WIM amenities are listed at 12,000+ truck stops, with nearly 250 offering all seven | Made facility safety a carrier-scorecard and service-reliability metric | Inbound Logistics / Women In Motion / FMCSA, CXTMS May 22 coverage |
| Shippers Conditions Index fuel trigger | FTR SCI fell to -18.9 in March from -11.9 in February, weakest since March 2022; wholesale diesel jumped more than 30% in one week and retail diesel more than 14% | Turned fuel volatility into a formal transportation-budget reforecast trigger | Logistics Management / FreightWaves / FTR, CXTMS May 22 coverage |
| Tariff operating-model pressure | Infios analyzed 1M+ U.S. customs entries; Gartner says tariff volatility is a multiyear dynamic event; 92% of surveyed supply chain leaders cite increased costs as the top tariff concern | Confirmed tariff response has become a permanent origin, mode, customs-data, and finance workflow | Logistics Management / Infios / Gartner, CXTMS May 22 coverage |
| AI produce inspection | Albertsons deployed AI-powered produce inspection while food surplus is valued at $382B | Turned fresh quality into structured warehouse data that can feed supplier scorecards, shrink analysis, and replenishment decisions | Supply Chain Dive / SupplyChainBrain, CXTMS May 23 coverage |
| Canada trade diversification | Diversification targets imply roughly $220B in new non-U.S. orders | Showed port productivity, inland links, and corridor execution can bottleneck trade strategy before demand does | SupplyChainBrain / McKinsey, CXTMS May 23 coverage |
| Food plant consolidation savings | J&J Snack Foods targets $20M in annual Project Apollo savings, including $15M from plant consolidation, $5M from administrative and distribution costs, and about $3M from distribution efficiencies in Q3-Q4 | Proved manufacturing consolidation only pays if transportation, cold-chain handling, and regional distribution redesign preserve the savings | Supply Chain Dive, CXTMS May 23 coverage |
| Retail SKU simplification | Under Armour cut SKUs 25%; inventory ended at $915M, down 3% YoY; Dollar General cut 1,500+ SKUs and improved in-stocks about 250 bps | Confirmed SKU rationalization is a warehouse, replenishment, slotting, and transportation-noise reduction lever | Supply Chain Dive, CXTMS May 23 coverage |
| Trucking usable-capacity risk | Roughly 1.2M trucks operate with no FMCSA safety rating and about 300,000 have conditional ratings | Made legal liability and carrier-vetting discipline part of routing-guide capacity planning | Logistics Management / FreightWaves, CXTMS May 23 coverage |
| Packaging chain-of-custody gap | Starbucks cup tracking showed recyclable packaging can still move to landfill without recovery evidence | Shifted packaging sustainability from material claims to auditable reverse-flow data, EPR reporting, and disposition proof | SupplyChainBrain / McKinsey, CXTMS May 23 coverage |
| Brazil e-commerce logistics | $69.21B market in 2026, projected to $150.91B by 2031 at 16.87% CAGR; logistics absorbs 12.6% of Brazil GDP vs. 8% global mean | Showed direct-entry growth depends on lane-specific customs, cost, and final-mile control | Mordor Intelligence / CXTMS May 24 coverage |
| Cargo theft execution risk | Trucking loses more than $18M per day; deceptive pickup schemes up 31% YoY; 73.5% of stolen cargo never recovered | Moved freight security into carrier identity, appointment, and release-control workflows | ATA / ATRI / CXTMS May 24 coverage |
| Cold-chain orchestration | Cold-chain logistics market grows from $383.46B in 2026 to $515.79B by 2031 at 6.12% CAGR | Proved temperature-controlled growth needs appointment, proof-of-condition, and exception orchestration, not just more cubic feet | Mordor Intelligence / CXTMS May 24 coverage |
| Power transformer constraint | Generator step-up transformer demand up 274% from 2019 to 2025; prices up about 80% over five years | Turned heavy-haul staging and import milestone visibility into industrial-growth prerequisites | Wood Mackenzie / Reuters / CXTMS May 24 coverage |
| Warehouse firefighting cost | New hires are 33% more likely to commit errors; firefighting can consume 8% to 15% of facility operating expenses; AI engines have supported 112B+ picks | Reframed labor AI around overload prevention and pickup-window protection, not productivity surveillance alone | SupplyChainBrain / CXTMS May 24 coverage |
| 91,000-pound truck pilot | Proposed 10-year pilot would raise selected truck limits from 80,000 to 91,000 pounds; congestion costs the economy $109B+ | Could reset rail-versus-truck breakpoints, sustainability claims, and routing assumptions | Logistics Management / ATA / CXTMS May 25 coverage |
| Air cargo capacity shock | March global CTKs down 4.8%; Middle East carrier CTKs down 54.3% YoY; capacity fell 9% instead of expected 5.5% growth | Forced a new air-to-ocean conversion playbook for premium and time-sensitive freight | SupplyChainBrain / IATA context / CXTMS May 25 coverage |
| Mexico MVE customs quality | 37% of MVE declarations contain errors; automation can cut preparation from more than an hour to under five minutes per declaration | Made customs value declaration quality a cross-border freight-risk workflow | Desteia / CXTMS May 25 coverage |
| FedEx Freight dimensional-pricing signal | Standalone FedEx Freight expects $8.7B revenue and about $1.1B adjusted operating income; operates 365 terminals and 26,000 terminal doors | Confirmed LTL pricing is moving toward dimensions, density, and cleaner shipper master data | Logistics Management / FedEx / CXTMS May 25 coverage |
| AMR fleet orchestration | AMR market at $5.18B in 2026, projected to $10.56B by 2031 at 15.31% CAGR; warehouse/logistics holds 32.94% share | Showed robot pilots are giving way to multi-fleet orchestration and workflow control | Mordor Intelligence / CXTMS May 26 coverage |
| Intermodal split signal | April intermodal volume down 0.6% YoY overall, but domestic containers up 8.6% while ISO containers fell 6.4% | Proved rail planning must separate domestic intermodal strength from international container softness | IANA / Logistics Management / CXTMS May 26 coverage |
| AI pilot purgatory | 74% of organizations have not moved beyond planning or created a roadmap; embedded decision intelligence can reduce logistics costs up to 15% | Reinforced that AI value depends on operating-model redesign, governance, and execution ownership | Industry report coverage / CXTMS May 26 analysis |
| Source-to-pay AI shift | 40% of enterprise apps expected to integrate task-specific AI agents by end of 2026, up from under 5% | Showed procurement orchestration is becoming part of the logistics tech stack | Deloitte |
| Procurement efficiency gap | 10% workload increase projected vs. 1% budget growth — a 9% efficiency gap only technology can close | Quantified why AI implementation speed is now a procurement survival metric | The Hackett Group |
| Manufacturing flow friction | PMI at 52.7, supplier deliveries at 58.9, prices at 78.3 | Showed growth is returning with volatility, not stability | Reuters / ISM |
| Fuel shock in trucking | $5.401 national diesel average, $5.52 fleet average, up $1.89 since Hormuz disruption | Made fuel-aware routing and surcharge governance urgent again | Logistics Management, Reuters, Samsara |
| Small-carrier fuel stress | 18% of surveyed trucking firms halted operations, 44% became more selective on load weights, 45% drove fewer miles | Showed fuel volatility can tighten capacity before contract markets fully react | DAT / Reuters |
| Retail demand outlook | U.S. retail sales projected up 4.4% to $5.6T in 2026, versus a 3.6% 10-year average | Reinforced the need for better regional inventory placement and parcel readiness | NRF / Logistics Management |
| Supply chain visibility gap | 95% visibility to tier-one supplier risk, but only 42% to tier-two and beyond | Proved many resilience programs still lose depth where disruption actually starts | McKinsey |
| Manufacturing AI governance gap | 85% expect to customize AI agents, but only 21% planning agentic AI have mature governance | Showed cyber risk is becoming an operational continuity issue, not just an IT issue | Deloitte / SupplyChainBrain |
| Workforce access to AI | Sanctioned AI access rose 50% year over year to about 60% of workers | Confirmed AI expansion is outrunning governance in industrial environments | Deloitte |
| Packaging right-sizing impact | Throughput tripled, total parcel impact around $1.10 per order, corrugate cut to one-third, damage down about 12% | Turned packaging into a measurable cost and service lever | Modern Materials Handling / Packsize / Helly Hansen |
| Alternative parcel AI governance | SpeedX said its AI chatbot handles more than 80% of initial customer-service inquiries, while ML verifies proof-of-delivery photos against GPS coordinates | Showed alternative carrier diversification now needs control-tower governance so cheaper final-mile options do not fragment exception recovery | Supply Chain Dive / CXTMS June 8 coverage |
| Marketplace handling-time data | More than 87% of U.S. seller-fulfilled orders received in a recent Amazon measurement window shipped earlier than promised; each one-day promised-delivery improvement can lift sales 5% on average | Turned seller handling-time settings into a service-level contract tied to conversion, late-shipment protection, and SKU-level execution evidence | Supply Chain Dive / Amazon seller policy coverage / CXTMS June 8 coverage |
| AutoZone mega-hub replenishment | AutoZone reported 8.4% YoY sales growth, is investing nearly $1.6B in capex, and uses mega hubs carrying 100,000+ SKUs | Proved store replenishment is becoming a network-design and inventory-availability problem rather than a simple DC-to-store cadence | Supply Chain Dive / CXTMS June 8 coverage |
| Delivery promise reliability | Roughly 50% of consumers are unwilling to pay anything for shipping regardless of speed; a three-day promise at 97% reliability can beat a two-day promise at 82% reliability | Reframed last-mile design around certainty, communication, and promise governance rather than speed theater | McKinsey / Supply Chain Dive / CXTMS June 8 coverage |
| Weight-data enforcement | BQE weigh-in-motion enforcement reduced overweight trucks 64%, from 7,777 to 2,769 per month; violations carry a $650 fine against an 80,000-pound limit | Made net, tare, and gross weight fields direct freight-cost, routing, and compliance controls | FreightWaves / Inbound Logistics / CXTMS June 8 coverage |
| Supply chain workforce shortage | 76% of supply chain and logistics leaders reported notable workforce shortages; 58% said shortages hurt service levels; transportation operations were hit hardest at 61% and warehouse operations at 56% | Proved labor stability is a service-level and exception-management KPI, not only an HR metric | MMH / SupplyChainBrain / CXTMS June 8 coverage |
| AI usage cost discipline | 72% of U.S. employees use AI tools for research, 64% for email efficiency, and 37% for content creation; one transportation AI platform reportedly boosted productivity more than 40% since 2022 | Showed AI has entered the operating-budget phase, where usage caps, workflow ownership, and ROI gates matter as much as adoption | SupplyChainBrain / McKinsey / CXTMS June 8 coverage |
| Warehouse maintenance constraint | 47% of respondents say finding capable maintenance technicians is somewhat of an issue; 52% use robots today, 32% plan robotics within three years, and ROI is the top evaluation factor at 63% | Confirmed automation ROI now depends on serviceability, technician capability, spare-parts readiness, and uptime governance | Modern Materials Handling / CXTMS June 8 coverage |
| Containerboard production reset | North American containerboard production fell 8% YoY in Q1 2026; the market is projected at $29.05B in 2026 and $33.64B by 2031 | Made corrugated availability, right-sizing, and packaging data part of transportation cost control | Mordor Intelligence / CXTMS June 9 coverage |
| India road freight scale | India road freight is estimated at $168.51B in 2026, growing 8.72% CAGR to $255.92B by 2031; the market faces a 2.2M skilled-driver shortage | Showed domestic linehaul growth needs appointment discipline, exception handling, and multimodal coordination before scale overwhelms manual dispatch | Mordor Intelligence / Deloitte / CXTMS June 9 coverage |
| Vietnam export lane design | Vietnam exports are forecast to grow 39.8% in 2026; container imbalance can add $85 per 20-foot box and $170 per 40-foot unit | Turned sourcing growth into port-pair, empty-container, customs, and lane-modeling work | Deloitte / Mordor Intelligence / CXTMS June 9 coverage |
| Big-and-bulky dimensions | 3PL big-and-bulky last-mile revenue is projected at $11.66B in 2026; appliances and furniture represented 40.6% and 30.2% of 2024 commodity mix | Proved product dimensions, cube, damage rules, and consolidated delivery logic are freight execution data, not catalog trivia | Armstrong & Associates / Logistics Management / Mordor Intelligence / CXTMS June 9 coverage |
| LNG bunkering capacity | Global LNG bunkering capacity is projected at 13.68M metric tons in 2026 and 56.29M by 2031, a 32.70% CAGR | Made maritime fuel availability, bunker windows, and emissions documentation part of ocean schedule reliability | Mordor Intelligence / Inbound Logistics / CXTMS June 9 coverage |
| Procurement AI readiness gap | Only 36% of CPOs are very confident in their ability to redesign procurement for AI; 56% of CSCOs cite legacy integration as a major AI challenge | Showed AI sourcing gains can leak away unless supplier, bid, pallet, PO, and logistics handoff data move into execution workflows | Gartner / Supply Chain Dive / CXTMS June 9 coverage |
| Russia freight sanctions premium | Russia freight and logistics is valued at $74.87B in 2026 and $85.17B by 2031; marine insurance for Russian-flagged vessels jumped 38% in 2024, with 15-20% Arctic surcharges and $200-$300 per TEU Black Sea premiums | Reframed sanctions and insurance exposure as shipment-level execution constraints | Mordor Intelligence / CXTMS June 9 coverage |
| Port Houston breakbulk capability | Port Houston handled 4.3M TEUs in 2025, public-facility tonnage rose 3% to 54.5M tons, and March steel imports rose 26% YoY to 436,256 short tons | Showed heavy, steel, and project cargo still need equipment-aware routing alongside container visibility | FreightWaves / Logistics Management / CXTMS June 9 coverage |
| Parcel refund ceiling | Late-delivery refunds recover only about 3.5% of parcel spend, leaving the remaining 96.5% dependent on accessorial, dimensional, address, residential, and surcharge governance | Shifted parcel audit from refund chasing toward line-item cost control | CXTMS June 10 accessorial coverage |
| Cloud TMS market | Cloud TMS market estimated near $16B in 2026 and projected around $40.3B by 2031 at 8.93% CAGR | Confirmed transportation execution is moving toward cloud-native workflow platforms, not spreadsheet dispatch | CXTMS June 10 cloud TMS coverage |
| Multi-carrier parcel portfolio | National carriers' share pressures, 23.9B parcel volume, and 5-15% potential shipping-cost reductions from carrier diversification | Made allocation logic, service scoring, and surcharge analytics the default ecommerce parcel stack | Logistics Management / Retail Exec / CXTMS June 10 coverage |
| API-native brokerage | U.S. freight brokerage market estimated at $21.28B, growing to $30.17B by 2031 at 7.23% CAGR | Showed tender cycles are compressing from phone-and-email workflows into API-mediated execution | Mordor Intelligence / CXTMS June 11 coverage |
| Freight fraud identity workflow | Fraud-prevention coverage cited 25%+ fraud pressure, deceptive pickup growth around 31%, and cyber-risk escalation that makes release authorization a verification event | Turned carrier identity, appointment changes, seal checks, and ETA exceptions into auditable TMS workflows | Inbound Logistics / Logistics Management / Gartner / CXTMS June 14 coverage |
| Blockchain exception proof | Blockchain-in-logistics market references around $2.23B in 2022 with high-growth forecasts, but June 14 coverage narrowed the useful case to exception proof rather than document theater | Showed distributed records only matter when TMS events, identity, handoffs, and exception ownership are clean enough to prove | Inbound Logistics / Logistics Management / CXTMS June 14 coverage |
| Driver-first freight apps | Trucking still moves roughly 3.5M drivers across an $800B market, while tighter carrier economics and a 6.3% market signal raised retention stakes | Reframed driver UX as milestone quality, dwell reduction, and carrier-reliability infrastructure | FreightWaves / Logistics Management / CXTMS June 14 coverage |
| Local-content origin data | European local-content discussions referenced 60-70% regional-content thresholds and sourcing shifts already reshaping freight networks | Made origin data a live planning input for sourcing, customs, port choice, and lane design | Reuters / Inbound Logistics / Logistics Management / CXTMS June 14 coverage |
| Truckload-to-LTL downshift signal | June 14 coverage connected mode downshifts with 2026 budget pressure, 6.3% freight-market signals, and high service reliability requirements | Showed LTL is not just a cheaper mode; it requires promise logic, dimensional quality, accessorial controls, and TMS-level budget triggers | Logistics Management / SupplyChainBrain / CXTMS June 14 coverage |
| ASEAN ecommerce logistics | ASEAN e-commerce logistics market estimated at $11.49B, growing to $20.37B by 2031 at 12.12% CAGR | Reframed Southeast Asian growth around value-added fulfillment, returns, and inventory services rather than delivery capacity alone | Mordor Intelligence / CXTMS June 11 coverage |
| Customs brokerage capacity | Customs brokerage market estimated at $5.48B, while Texas freight and logistics reached $144.23B | Made broker bandwidth, document quality, and pre-clearance execution central to nearshoring scale | Mordor Intelligence / Reuters / CXTMS June 11 coverage |
| Smart container pre-clearance | Smart container market estimated at $6.13B, growing to $14.08B by 2031 at 18.13% CAGR | Turned container telemetry into customs, insurance, dwell, and release evidence rather than simple location visibility | Mordor Intelligence / CXTMS June 11 coverage |
| Mexico lane-control scale | Mexico freight and logistics market estimated at $131.06B, growing to $170.39B by 2031 at 5.39% CAGR | Proved nearshoring advantage now depends on lane control, customs records, and cross-border exception ownership | Mordor Intelligence / CXTMS June 12 coverage |
| MEA corridor resilience | Middle East and Africa freight/logistics market estimated at $321.36B, growing to $416.75B by 2031 at 5.34% CAGR | Made corridor optionality and disruption playbooks prerequisites for regional growth | Mordor Intelligence / CXTMS June 12 coverage |
| Frontline AI adoption gap | 70% of transformations fail without workforce adoption; frontline AI success depends on training, trust, and change management | Confirmed logistics AI ROI is constrained by operating discipline and people enablement, not model availability | CXTMS June 12 AI upskilling coverage |
| Carrier costing pressure | J.B. Hunt cited truckload operating expense lines up roughly 30% to 50% over five years while rates declined | Made lane-level carrier costing a margin-control workflow instead of a back-office accounting exercise | FreightWaves / Inbound Logistics / CXTMS June 15 carrier-costing coverage |
| Grocery recall scope | Effective traceability can reduce recall scope by 50% to 95% when lot, pallet, container, shipment, and temperature records stay connected | Turned grocery traceability from compliance recordkeeping into disruption containment | International Trade Centre / Food Logistics / CXTMS June 15 traceability coverage |
| India cold chain node planning | India's cold chain logistics market is projected from $24.85B in 2026 to $33.12B by 2031 at 5.91% CAGR; India's road freight market is projected from $168.51B to $255.92B at 8.72% CAGR | Showed cold-chain growth needs regional node, reefer, handoff, and exception planning rather than national capacity assumptions | Mordor Intelligence / CXTMS June 15 cold-chain coverage |
| May LMI planning slack | May LMI came in at 69.5; inventory costs jumped 9.4% to 84.1, warehousing prices held at 70.7, and transportation prices grew faster than any point in the LMI's nearly 10-year history | Made external market indicators actionable triggers for lane reviews, storage rules, and budget updates | Logistics Management / CXTMS June 15 LMI coverage |
| Peak-season frontloading | Asia-U.S. West Coast prices rose 51% in one week to $4,836/FEU; East Coast prices rose 25% to $6,336/FEU; June retail imports were projected at 2.25M TEU, up 14.3% YoY | Reframed import timing as a finance decision requiring landed-cost, storage, tariff, and cash-flow scenarios | FreightWaves / Global Port Tracker / Supply Chain Dive / CXTMS June 15 frontloading coverage |
| Rail intermodal pressure valve | U.S. May rail carloads rose 2.5% YoY and intermodal rose 8.1% YoY; average truckload haul length fell from roughly 607 miles to just above 500 miles while intermodal contract savings averaged 10% to 20% | Put rail-intermodal conversion back into truckload budget planning, especially on long-haul lanes | Logistics Management / FreightWaves / CXTMS June 15 intermodal coverage |
| Pallet continuity risk | North America's white-wood pallet market is estimated around $7B with more than 500M one-way pallets and 1,500+ depots | Elevated pallet availability, repair, export compliance, and reusable-asset visibility into shipment-readiness controls | Modern Materials Handling / CXTMS June 15 pallet coverage |
| Warehouse process debt | 52% of respondents use one or more robot types, 32% plan deployment within three years, 58% use or are considering broader intralogistics automation, and top robot targets include order/case picking at 57% | Confirmed automation budgets fail when old exception processes and dock workarounds survive underneath new systems | Modern Materials Handling / Inbound Logistics / CXTMS June 15 warehouse coverage |
| Software supply-chain risk | Supply chain attacks through outside vendors exceeded malware-linked compromises in 2022, and early-2023 supply-chain attacks reached 40% of the prior year's total within two months | Made vendor due diligence, API governance, data portability, and incident continuity core logistics-platform selection criteria | Supply Chain Dive / Gartner / CXTMS June 15 software-risk coverage |
| Freight decision latency | Organizations lose more than 5 cents on every dollar from slow response between demand signals and action; a $1B company faces a $55M faster-decision opportunity | Turned freight AI from planning automation into continuous network engineering and demand-supply alignment | SupplyChainBrain / Incisiv / CXTMS June 16 AI coverage |
| C.H. Robinson autonomous planning benchmark | Lean AI Planner drives 92% of Managed Solutions shipments autonomously for 4PL customers | Set a practical benchmark for closed-loop freight planning and the next move toward continuous-improvement freight engineering | FreightWaves / C.H. Robinson / CXTMS June 16 coverage |
| Defense and supply chain AI execution gap | Over 80% of supply chain leaders expect funding increases, but only 20% of warehousing and transportation AI initiatives achieve their goals | Reinforced that AI needs execution data, ownership, and approval thresholds before it improves readiness or logistics cost | Gartner / CXTMS June 16 defense logistics coverage |
| Rail freight growth | Global rail freight transport market estimated at $340.5B in 2026, reaching $423.87B by 2031 at 4.48% CAGR; intermodal grows 6.23% and cross-border 6.68% | Shifted rail strategy from route-mileage comparisons toward asset-level visibility, terminal dwell, security events, and truck-rail transfer control | Mordor Intelligence / CXTMS June 16 rail coverage |
| East Edge rail corridor | $64M double-stack corridor expected to cut Chicago-Ayer transit times by up to 10 hours and unlock capacity for 60,000+ annual loads | Showed rail infrastructure value is measured in cycle time, capacity, and service design, not miles alone | Inbound Logistics / CXTMS June 16 rail coverage |
| U.S. freight network scale | Nearly 7M freight-network miles move 54M+ tons of goods worth over $68B each day | Made role-based data sharing and exception ownership national freight infrastructure issues | U.S. DOT / Logistics Management / CXTMS June 16 coverage |
| Container pre-screening opportunity | U.S. ports processed nearly 52M containers in 2025; CBP physically inspects only 3% to 5% at ports | Framed role-based freight data as a way to speed cargo without exposing every participant's full operating data | FreightWaves / CBP / CXTMS June 16 DOT dashboard coverage |
| Fuel policy trigger | India raised diesel export tax to 14 rupees/liter and aviation turbine fuel export tax to 12.5 rupees/liter for the June 16 fortnight | Proved upstream fuel policy belongs in lane-level surcharge, air-cargo, and budget-trigger workflows | Reuters / CXTMS June 16 fuel coverage |
| Diesel volatility | U.S. diesel rose above $5/gallon; 44% of surveyed shippers expected freight rate increases as the largest conflict-driven supply chain impact | Turned fuel exposure into a lane-level operating trigger instead of a monthly budget surprise | Inbound Logistics / CXTMS June 16 fuel coverage |
| Regional EV route economics | Toronto EV truck pilot reported 44.7% diesel savings, while NACFE modeled regional return-to-base BEV cost at $0.42/mile with infrastructure versus $0.35/mile for diesel | Showed EV pilots need route density, charging utilization, dwell visibility, and exception recovery rather than sustainability slogans | Supply Chain Dive / NACFE / CXTMS June 16 EV coverage |
| EV deployment operating limits | Four Class 8 BEVs running 90,000 km annually over six years could have an $856,486 cost advantage, consume 60% less energy, and cut GHG emissions by at least 80%; some units still ran only 150-200 km/day due to charging limits | Confirmed electrification value depends on infrastructure, training, weather, and dispatch fit | FPInnovations / Transport Canada / CXTMS June 16 EV coverage |
| Franchise logistics scale | Gong cha acquired 170 U.S. master-franchise stores, plans 1,000 more units, operates five U.S. warehouses, and manages some import lead times near three months | Showed franchise growth needs standardized item data, regional replenishment rules, and one supply chain playbook | Supply Chain Dive / CXTMS June 16 franchise coverage |
| Maritime workforce risk | Commercial maritime shipping relies on roughly 2M seafarers; about 20,000 were stuck in the Persian Gulf during conflict disruption | Elevated crew availability, labor mobility, and shore-side expertise into shipper-facing schedule-reliability risks | FreightWaves / BIMCO / CXTMS June 16 ocean coverage |
| Forwarder volatility baseline | Global freight forwarding market expected to grow 2.9% in real terms in 2025 while 2026 remained uncertain | Reinforced that forwarders are becoming risk, contingency, carbon, visibility, and compliance partners rather than pure movement vendors | Logistics Management / Transport Intelligence / CXTMS June 16 maritime coverage |
| Warehouse workforce pressure | Operators are asking a less experienced warehouse workforce to do better work faster with less margin for error | Made guided workflows, scan validation, exception prompts, and TMS/WMS status sharing prerequisites for next-gen warehouse performance | Inbound Logistics / CXTMS June 16 warehouse coverage |
| Warehouse labor pressure | 74% of transportation and logistics companies report talent shortages; 166,000 workers quit in Dec. 2025, about 27% annualized turnover | Elevated facility design and retention strategy into mainstream logistics-tech conversations | MMH / ManpowerGroup / BLS |
| Warehouse environment ROI | LEDs use up to 80% less energy and can run 100,000+ hours; modern lighting benchmarks center around 240 lux and 5,000 Kelvin | Showed building design is part of labor productivity and automation readiness | MMH |
| Trucking market concentration | Top 25 LTL carriers generated $47.3B of a $51.8B U.S. LTL market in 2025 | Highlighted why network-fit carriers matter more as conditions tighten | Logistics Management |
| Maritime policy cost risk | Proposed Chinese-built ship fees could add up to $30B in annual consumer costs and double the cost of U.S. exports | Showed policy-driven resilience can create cost shock before it creates capacity | Reuters / World Shipping Council |
| Ocean regulatory cost layer | ETS, IMO, and security surcharges are adding 15% to 20% on top of base container rates | Confirmed ocean procurement now requires cost-layer decomposition, not just rate negotiation | Ocean-freight regulatory coverage / Reuters |
| Tender rejection risk | National truckload tender rejections reached 13% in Q1 2026, while the spot-contract gap narrowed to $0.11 per mile | Made pre-pickup risk scoring and faster repricing more valuable | U.S. Bank / DAT, FreightWaves |
| Cass March recovery signal | Shipments at 1.007, down 4.5% YoY but up 3.0% MoM (second consecutive MoM gain); expenditures at 3.296, up 4.2% YoY; rates running ~9% above prior year | Confirmed freight recession is technically over, but recovery is slow and supply-driven | Cass Information Systems / ACT Research |
| Cass Q1 rate-volume divergence | March shipments fell 4.5% YoY while expenditures rose 4.2%; ACT For-Hire Driver Availability Index fell 4.8 points to 35.0 | Confirmed Q2 procurement risk is supply-constrained rate pressure, not demand-led volume recovery | Cass Information Systems / ACT Research, CXTMS May 6 analysis |
| NY Fed GSCPI spike | 0.68 in March 2026, up from 0.54 in February; highest reading since January 2023 | Broke a two-year declining trend, confirming structural supply pressure has returned | NY Fed / Reuters |
| DAT truckload tightening | Van TVI 253, up 12% month over month, reefer 196, up 7%, flatbed 314, up 18% | Confirmed capacity tightening was broad, not a one-mode anomaly | DAT |
| Red Sea Cape detour cost | $200–400 per TEU incremental cost from Cape routing, per JPMorgan | Confirmed the detour has a quantifiable, persistent financial toll | JPMorgan / CXTMS coverage |
| Maersk peak Red Sea surcharge | $400 per TEU at 2025 peak | Showed how quickly carriers could layer surcharges on top of base rates | Maersk / CXTMS coverage |
| Bab el-Mandeb partial recovery | ~60% of pre-crisis traffic by late 2025; 1,128 transits in November 2025, highest since Jan 2024 | Showed a slow, incomplete return that is not yet a full normalization | Lloyd's List Intelligence / CXTMS coverage |
| Ocean rate normalization | Far East-Mediterranean long-term rates down 25% from late 2025 peaks | Made the case for hybrid and index-linked contract structures | Reuters / CXTMS coverage |
| Invoice-error signal | 7% of invoices contain errors, and more than half of disputes can take up to 10 days to resolve | Showed financial workflow data is becoming an early-warning operational sensor, not just a back-office metric | SupplyChainBrain |
| Parcel invoice error exposure | 15% of parcel invoices contain at least one billing error; duplicate invoices represent 15-20% of recoverable spend; rounding errors add 2-4% of total parcel spend annually | Confirmed accessorial and billing governance is a recurring margin-control workflow, not a one-time audit project | CXTMS May 6 accessorial fee analysis |
| Accessorial recovery economics | 1-5% of total freight spend recoverable through systematic audit; AI-powered parcel audit commonly recovers 2-5%; many shippers leave 3-5% of freight budget unclaimed | Turned accessorial charge taxonomy into a measurable savings playbook for parcel and LTL shippers | CXTMS May 6 accessorial fee analysis |
| Air cargo fuel stress | Lufthansa is cutting 20,000 flights to save 40,000 metric tons of jet fuel; global jet fuel prices rose 70%+ | Proved energy stress can spill from aviation economics straight into freight planning and capacity risk | SupplyChainBrain / WorldACD |
| Nearshoring talent constraint | U.S.-Mexico freight can move in under 48 hours versus 25 to 30 days from Asia, but logisticians are still projected to grow 17% through 2034 | Confirmed regionalization only works when labor, customs, and planning talent scale with it | SupplyChainBrain / BLS |
| Parcel-in-TMS blind spot | U.S. parcel market projected at $30B with 5% CAGR; address correction fees around $25 per package | Turned parcel functionality from a nice-to-have into a direct cost-control and compliance requirement | Inbound Logistics / Supply Chain Dive |
| Warehouse automation investment | $21B invested in 2023, expected to exceed $90B by 2033, with average 2026 spend at $1.6M | Showed buyers are still spending, but with a much harder focus on practical integration and uptime | Modern Materials Handling |
| Automation integration priority | 68% rank integration and compatibility as very important, up from 56%; 92% prioritize durability and uptime, 95% fast response times | Confirmed warehouse buyers now care as much about coexistence and serviceability as robot features | Modern Materials Handling |
| Supplier decarbonization plateau | 20GW+ renewable energy added, 26M metric tons of emissions avoided, yet manufacturing emissions stayed flat year over year at 8.15M metric tons CO2e | Proved the next sustainability gains depend on transport, materials, and operating discipline, not just clean power procurement | Apple / Supply Chain Dive |
| Forklift battery transition | Global forklift battery market at $6.55B in 2026, growing to $9.37B by 2031 at 7.41% CAGR; lithium-ion units forecast at 8.11% CAGR | Showed warehouse electrification is becoming a fleet-availability and charging-strategy decision, not a maintenance footnote | Mordor Intelligence / MMH |
| Logistics pay and workload shift | Average logistics salary rose to $126,400, 57% received raises averaging 7%, and 76% report broader responsibilities | Confirmed logistics jobs are getting more strategic, not simpler, as digital tools spread | Logistics Management |
| Logistics talent pipeline risk | 42% of leaders are 55 to 64, 17% are over 65, and only 3% are under 35 | Highlighted a looming leadership handoff problem as operations become more digital and cross-functional | Logistics Management |
| Rural final-mile hub scaling | Tractor Supply added about 200 hubs last year and plans 176 more, aiming to support 1,200+ stores and 15M+ customers while cutting cost per delivery | Showed low-density delivery can scale when bulky fulfillment is designed like a local freight network | Supply Chain Dive |
| Vertical integration scale play | Somnigroup's $2.5B Leggett & Platt deal would create a 175-facility, 36-country network with $11.2B in sales | Showed control over upstream capacity is becoming a resilience and margin strategy again | Supply Chain Dive |
| California jet fuel inventory | 2.6M barrels as of April 17, down from 3.2M two years earlier; refining capacity dropped from 2.9M b/d (2019) to 2.3M today | Exposed air cargo to thinner buffers and faster price reactions in a fuel-island market | SupplyChainBrain |
| Capacitor demand surge | 14% quarter-over-quarter surge projected for Q2 2026, reversing a 31% price collapse | Showed AI data center buildout is creating new electronics supply chain demand shocks | Supplyframe |
| Cargo theft losses | Average loss per theft from warehouses and DCs exceeds $210,000; Overhaul reported 29% YoY increase in Q3 2025; CargoNet documented 430% YoY increase in strategic theft (Q3 2023) | Confirmed cargo theft has migrated from physical security to information security | Geotab, Overhaul, CargoNet |
| CBP counterfeit seizures | Nearly 79 million counterfeit items seized in 2025, estimated value $7.3 billion | Confirmed authentication is becoming a frontline border operations requirement | CBP |
| EU ecommerce parcels under de minimis | 4.6 billion low-value parcels in 2024, more than 90% from China | Showed why ending de minimis requires a full rebuild of cross-border parcel economics | EU data, industry analysis |
| Food supply chain emissions share | Food supply chains account for roughly one-quarter of global emissions | Confirmed Scope 3 data gap is a compliance deadline problem with no easy technical fix | C2ES, HowGood |
| Nuclear containership savings | $50M annual bunker fuel savings, $18M avoided carbon penalties, $68M total operating savings per 15,000-TEU vessel | Showed nuclear propulsion economics have moved from science fiction toward near-term commercial viability | Lloyd's Register, LucidCatalyst, Seaspan |
| Nuclear transit advantage | 39% faster transit speeds, 38% more cargo capacity on nuclear-powered 15,000-TEU vessel | Quantified the competitive implications of nuclear adoption for ocean route planning | Lloyd's Register, LucidCatalyst, Seaspan |
| Smart glasses warehouse deployment | Roughly 1,500 operators across DHL U.S. sites using TeamViewer Frontline Pick; 15% productivity increase; training time cut from weeks to hours | Showed wearables are credible when deployed as hybrid workflow tools, not single-purpose replacements | Inbound Logistics, TeamViewer Frontline Pick |
| Smart glasses battery life | Up to 12 hours with swappable batteries | Removed the shift-killing battery life problem that killed earlier wearable deployments | SupplyChainBrain |
| SAP Gartner TMS recognition | SAP named a Leader in 2026 Gartner Magic Quadrant for TMS — 12th consecutive year | Confirmed SAP's TMS staying power and support infrastructure at enterprise scale | SAP / Gartner |
| SAP mid-market logistics GA | SAP Logistics Management went generally available February 26, 2026 | Marked SAP's formal entry into mid-market satellite logistics management | SAP news |
| Parcel audit overpayment rate | 5–10% of total parcel spend overpaid annually | Confirmed parcel audit ROI is structural, not marginal | Industry analysis / CXTMS coverage |
| Healthcare cold-chain 3PL market | 7.6% CAGR, reaching $4.65B by 2030 | Confirmed dedicated pharma cold-chain networks as a premium-growth 3PL segment | Grand View Research, CXTMS coverage |
| Global Top 25 cold-chain capacity | 7.76B cubic feet, up 6.3% from 2025, after 8.3% prior-year expansion | Showed capacity is growing, but regional location, temperature band, dock flow, labor, power, and compliance controls determine whether that capacity is actually usable | Global Cold Chain Alliance / Food Logistics, CXTMS May 13 coverage |
| Baltimore bridge settlement | $2.25B settlement versus an attempted $43.7M liability cap | Proved maritime disruption exposure can dwarf legal liability formulas and needs network-level contingency evidence | SupplyChainBrain / CXTMS May 19 coverage |
| Brunswick RoRo expansion | $100M fourth berth, 975-foot vessel capacity, 770,000 vehicle units and 53,000 heavy machinery units handled in 2025 | Confirmed finished-vehicle logistics is becoming a port-capacity and inland-connectivity race | SupplyChainBrain / CXTMS May 19 coverage |
| EU international van reset | LCVs over 2.5 tonnes face July 1, 2026 social-rule expansion; 45-minute break after 4.5 hours and 11-hour rest constraints | Turned last-mile and express procurement into compliance-backed capacity planning | SupplyChainBrain / CXTMS May 19 coverage |
| Humanoid airside robotics | Japan Airlines trial runs May 2026-2028; Japan faces potential 11M-worker shortage by 2040 | Moved robotics discussion from warehouse floors into ground handling and air cargo labor resilience | SupplyChainBrain / CXTMS May 19 coverage |
| ATA truck tonnage signal | Seasonally adjusted truck tonnage held at 117.8 in April, flat with March and up 3.5% year over year; tonnage was up 2.6% through the first four months of 2026 | Showed truckload planning risk is supply-sensitive even without a demand boom | ATA / Logistics Management / CXTMS May 20 coverage |
| Regional freight campus design | Averitt's Louisville campus includes a 50,000-square-foot cross-dock with 100 doors expandable to 160, 286,000+ square feet of distribution/fulfillment space, and parking for 300+ trailers | Confirmed regional networks are being designed as integrated capacity systems, not single-use terminals | Supply Chain Dive / CXTMS May 20 coverage |
| Ocean procurement compliance | Chinese state-owned or controlled entities accounted for 90% of refrigerated shipping container production worldwide in a prior DOJ antitrust context | Turned supplier concentration, quote history, and procurement approvals into ocean-freight compliance controls | U.S. DOJ / CXTMS May 20 coverage |
| Billing automation economics | Manual B2B payment automation can reduce processing costs by 60% to 75%; even a 1% billing error rate can become a multimillion-dollar leak at scale | Reframed invoice accuracy as a real-time margin and cash-flow workflow | SupplyChainBrain / CXTMS May 20 coverage |
| CPG distribution modernization | Mondelēz has modernized about 60% of its U.S. network, with the remaining 40% carrying higher waste and productivity gaps; a $1.2B ERP and supply chain overhaul runs through 2028 | Showed AI-enabled distribution cost control depends on integrated data, not isolated automation | Company commentary / CXTMS May 20 coverage |
| Transportation producer prices | Wholesale prices rose 1.4% in April and 6% year over year; transportation and warehousing costs rose 5% in April while wholesale energy prices jumped 7.8% | Made faster freight-budget sensing and surcharge governance a planning requirement | BLS / SupplyChainBrain / CXTMS May 20 coverage |
| Border produce logistics | 98% of Mexican fresh produce imports enter through Texas, New Mexico, Arizona, or California, and 55% moves through Texas | Confirmed cold-chain and border-documentation specialization is central to produce logistics resilience | Logistics Management / CXTMS May 20 coverage |
| U.S. cold-chain market | $97.13B in 2026, projected to $133.87B by 2031 at 6.63% CAGR; refrigerated storage held 57.53% of U.S. cold-chain market share | Showed temperature-controlled capacity is becoming a specialized network design problem | Mordor Intelligence / CXTMS May 20 coverage |
| Sustainable packaging market | $325.94B in 2026, projected to $463.41B by 2031 at 7.29% CAGR; EPR rules span 63 countries | Proved packaging is now tied to freight cost, cube, claims, automation compatibility, and compliance | Mordor Intelligence / CXTMS May 20 coverage |
| Air freight risk market context | Air freight market estimated at $169.53B in 2026, growing to $225.26B by 2031 at 5.85% CAGR; international service held 83.50% of 2025 volume | Made carrier safety visibility and contingency routing part of premium air-cargo planning | Mordor Intelligence / CXTMS May 20 coverage |
| April spot truckload fuel divergence | Van TVI fell 3% from March while spot van rates rose $0.15 to $2.67/mile; reefer TVI fell 9% while rates rose $0.14 to $3.11/mile; van fuel surcharge reached $0.71/mile, highest since July 2022 | Proved freight budgets need separate demand, linehaul, and fuel-surcharge dashboards | DAT / Logistics Management / CXTMS May 21 coverage |
| Energy export risk | U.S. crude inventories, including strategic reserves, dropped 17.8M barrels, the largest draw on record; diesel averaged $5.596/gallon the week ending May 18 | Made energy logistics an upstream freight-cost and export-capacity signal, not just a fuel-price watchlist | EIA / SupplyChainBrain / Logistics Management / CXTMS May 21 coverage |
| EU-U.S. customs scenario planning | CBP was on track to deliver $35.46B in refunds for invalidated tariffs across more than 8M entries | Showed customs teams need operational scenario logic for tariff ceilings, sunset clauses, refunds, and origin/classification evidence | Supply Chain Dive / CBP / CXTMS May 21 coverage |
| Roadcheck capacity avoidance | About 5% fewer one-vehicle fleets are active during Roadcheck than expected | Confirmed announced enforcement changes available capacity before out-of-service orders are issued | FreightWaves / CXTMS May 21 coverage |
| Cargo theft policy pressure | ATRI estimates more than $18M per day in trucking-industry cargo-theft losses | Put security, carrier verification, route risk, and infrastructure bottlenecks into the same resilience model | Logistics Management / ATRI / CXTMS May 21 coverage |
| Warehouse robot manipulation | Warehouse robotics market estimated at $10.96B in 2026, growing from $9.33B in 2025 | Showed automation competition is moving from AMR movement toward manipulation, physical AI, and task orchestration | Mordor Intelligence / CXTMS May 21 coverage |
| Retail in-stock reliability | Target's $265M Houston receive center supports inventory holding capacity and network flexibility | Reframed fill rate as the executive KPI connecting inventory, warehouse execution, transportation, and customer service | Supply Chain Dive / Inbound Logistics / CXTMS May 21 coverage |
| U.S.-China agriculture signal | A proposed $17B agriculture purchase commitment, 400+ renewed U.S. beef facility listings, and lower U.N. 2026 GDP forecast of 2.5% | Turned trade-board announcements into reefer, bulk, port, rail, and export-documentation planning signals | Supply Chain Dive / SupplyChainBrain / CXTMS May 21 coverage |
| North American robot orders | 9,055 robots worth $543M in Q1 2026; cobot orders up 55.6% YoY to 1,637 units, revenue up 78.2% to $69.8M | Showed practical robotics demand remains strong, especially collaborative automation | Modern Materials Handling / CXTMS May 19 coverage |
| Seismic automation readiness | 120-foot AS/RS example carrying 150,000+ pounds; racks over eight feet require seismic-force accounting under ANSI MH16.1 | Put facility engineering, slab analysis, and permitting into the automation deployment critical path | SupplyChainBrain / CXTMS May 19 coverage |
| Tariff refund scale | CBP on track for $35.46B in refunds across 8M+ entries; $127B completed refund steps across 53M shipments and 330,000+ importers | Made tariff-adjusted landed cost a dynamic sourcing metric rather than a static import assumption | Supply Chain Dive, Reuters / CXTMS May 19 coverage |
| Middle Corridor optionality | Turkey-Europe-Gulf network expected to take four to five years; Middle Corridor revival adds +0.7% forecast CAGR impact in Turkey logistics | Reinforced corridor planning as a long-term multimodal optionality exercise | SupplyChainBrain, Mordor Intelligence / CXTMS May 19 coverage |
| Domestic rail infrastructure | Seven-year Union Pacific rail contract; 100-meter rail lengths require 80% fewer welds; U.S. rail carloads up 3.6% YoY through 18 weeks | Tied infrastructure sourcing, safety, and rail reliability to shipper network planning | SupplyChainBrain, Logistics Management / CXTMS May 19 coverage |
| Cold-chain warehousing share | 27% of total warehousing investments in 2026, up from ~19% five years ago | Showed temperature-sensitive freight moving from niche to mainstream capital priority | CXTMS coverage |
| DHL BRUcargo pharma zone | 45,000 square meters of pharma-only cold-chain space | Confirmed network-embedded cold-chain nodes as the structural 3PL build model | DHL, CXTMS coverage |
| Parcel audit recovery rate benchmark | 80%+ recovery rate defines an advanced program; most programs achieve only 30–50% | Turned recovery rate into the single most important audit performance metric | Industry analysis / CXTMS coverage |
| AI audit accuracy | ARDEM FreightSure achieves up to 99% freight audit processing accuracy | Showed AI-driven audit has crossed into enterprise-grade reliability | ARDEM / CXTMS coverage |
| TMS market size | Global logistics software market projected $16.24B in 2025 to $27.88B by 2032 at 8% CAGR | Confirmed TMS as a durable, growing category | Industry analysis / CXTMS coverage |
| Multimodal predictive ETA | Lane-specific predictive models can materially outperform carrier-provided ETAs across multimodal networks | Showed predictive intelligence as the real differentiator in visibility platforms | CXTMS coverage |
| Multimodal visibility market | $1.2B in 2026, 13.7% CAGR through 2036 | Marked the shift from siloed track-and-trace to unified multimodal platforms; fragmentation is now a competitive risk | FutureMarketInsights |
| ERP/TMS integration friction | Six months of professional services to onboard is a red flag | Confirmed integration speed is now a competitive differentiator among TMS vendors | Industry analysis / CXTMS coverage |
| Ocean long-term rate trend | Long-term rates entering Q1 2026 already down versus end of 2025 | Confirmed the buyer's window in ocean contracting is real | Xeneta / CXTMS coverage |
| Ocean GRI range | $200 to $6,200 per container, or 5–10% of cargo value | Showed GRIs remain a carrier pricing tool even in soft markets | Industry analysis / CXTMS coverage |
| Hybrid ocean contract structures | Split volume between fixed base rate and index-linked balance | Emerged as the practical middle ground between fixed locks and pure spot exposure | CXTMS coverage |
| Forward Freight Agreements (FFAs) | Container freight derivatives developing toward dry bulk maturity | Showed FFA products are becoming accessible to mid-market shippers | SupplyChainBrain / CXTMS coverage |
| MHI robotics adoption | 48% of organizations using warehouse robots in 2025, up from 23% three years earlier | Confirmed automation adoption is doubling on a broad base | MHI / Supply Chain Dive / Modern Materials Handling |
| Connected worker primary drivers | 55% improving worker productivity; 50% ergonomics and safety; 50% increasing throughput with existing headcount | Showed augmentation is now the primary automation use case, not replacement | MHI / Modern Materials Handling |
| Data layer as moat | Competitive advantage compounds as more task data improves routing decisions | Confirmed operational data as a distinct asset class in warehouse tech | MHI / Deloitte / CXTMS coverage |
| AI planning transformation failure rate | 60% of supply chain digital adoption efforts will fail to deliver by 2028; primary culprit insufficient L&D | Gartner / BCG framing that the bottleneck is human, not technological | Gartner May 2025, BCG February 2026 |
| Planning maturity divergence | Organizations that invested in planning infrastructure are pulling away; others running in place | BCG February 2026 framing of the widening gap between leaders and laggards | BCG / CXTMS coverage |
| BCG operating system framework | Four pillars: People, Processes, Data, Governance | Confirmed that AI planning requires foundational operating infrastructure, not just software | BCG / CXTMS coverage |
| Gartner Supply Chain Planning MQ | ToolsGroup recognized in Gartner's first-ever Magic Quadrant for Supply Chain Planning Solutions | Validated decision-centric planning as a coherent category | Gartner / CXTMS coverage |
| Hackett procurement AI transformation | 64% of procurement and supply chain leaders expect AI to fundamentally transform operations within five years | Confirmed AI adoption momentum, but also the urgency of closing the execution gap | The Hackett Group / CXTMS coverage |
| Average driver age | 57 years old | Confirmed demographic cliff is the structural driver of trucking capacity contraction | ATA / CXTMS coverage |
| J.B. Hunt capacity analysis | Peak active truck utilization possible by Q4 2026 if FMCSA and immigration enforcement achieve full impact | Made the capacity cliff a near-term event, not a long-range scenario | J.B. Hunt / CXTMS coverage |
| Trucking capacity structural transition | ACT Research characterization of 2026 — not a cycle, a structural shift | Confirmed the capacity story is fundamentally different from 2021–2022 | ACT Research / CXTMS coverage |
| LTL rate increase May 2026 | Mid-single-digit increases, approximately 5% YoY | Confirmed LTL pricing discipline is real and sustained | C.H. Robinson, CXTMS coverage |
| RXO fragile capacity assessment | Accelerated carrier attrition sets up more challenging shipper market later in 2026 | Confirmed capacity fragility is structural, not cyclical | RXO Q1 2026 Truckload Market Guide |
| Load board postings | Up 6% year-to-date | Signal of shipper demand recovery outpacing carrier capacity growth | CXTMS coverage / ACT Research |
| Amazon robotics scale | 750,000+ robots deployed globally by mid-2025 | Confirmed warehouse automation has crossed into competitive necessity for large-scale operators | Distribution Strategy, CXTMS coverage |
| FedEx multi-vendor robotics pivot | Partnering with Berkshire Grey, Dexterity, Nimble, Aurora Innovation | Abandoned proprietary automation in favor of specialist ecosystem model | TechCrunch, FedEx |
| Aurora Innovation autonomous loads | 3,200+ autonomous loads completed | Showed long-haul autonomy reaching operational credibility | FedEx / Aurora Innovation |
| Berkshire Grey bulk unloading | Multi-year collaboration producing Scoop robotic trailer unloader | Solved a task (bulk unloading) that earlier single-item picking robots couldn't handle | TechCrunch, Berkshire Grey |
| FedEx automation admission | Leadership explicitly stated robotics development is "next level" harder than sensor hardware | Confirmed that internal R&D timelines can't match specialist vendor velocity | FedEx leadership, via TechCrunch |
| Amazon robot-to-worker ratio | 750,000+ robots vs. growing human headcount | Showed the co-bot model scaling at Amazon's pace | Distribution Strategy |
| BIMCO Red Sea return impact | 10% drop in vessel demand if full Red Sea return | Quantified the dormant capacity-leverage sitting in current shipper contracts | BIMCO / CXTMS coverage |
| Marine insurance Red Sea adjustment | Already beginning to decline following October 2025 ceasefire signals | Early signal that market mechanisms are starting to reprice Red Sea risk | Industry analysis / CXTMS coverage |
| EU ETS2 road transport carbon pricing | Adding cost layer to European road freight on top of existing ETS maritime | Showed decarbonization cost is compounding, not replacing, other freight cost pressures | Industry analysis / CXTMS coverage |
| LTL consolidation squeeze | Regional LTL carriers contracting — Standard Forwarding closure | Showed structural LTL capacity pressure outside truckload | CXTMS coverage |
| Regional parcel carriers | Veho, UniUni challenging FedEx UPS duopoly in specific segments | Emerging competitive pressure in last-mile parcel delivery | CXTMS coverage |
| 3PL market size | US 3PL market projected at $272B by 2031, growing at CAGR | Confirmed scale and strategic importance of third-party logistics | Mordor Intelligence / CXTMS coverage |
| Freight payment automation | Gartner Market Guide for Freight Audit and Payment (FAP) | Validated FAP as a distinct, maturing TMS-adjacent category | Gartner / CXTMS coverage |
| CPKC trinational railroad | 25,000-mile network reshaping US-Mexico-Canada intermodal | Showed cross-border rail infrastructure consolidation creating new network dynamics | CXTMS coverage |
| Panama Canal line-jump fees | Congestion pricing at Neopanamax locks | Showed canal capacity becoming a premium-priced scarce resource | CXTMS coverage |
| Ocean freight contract renegotiation | Spot rates 30–40% below 2024 peaks; buyer's window open in Q2 2026 | Confirmed ocean procurement urgency and the case for hybrid index-linked structures | CXTMS coverage |
| Demand forecasting AI adoption | 62% of supply chain leaders using AI for demand forecasting | Showed planning AI moved from early adopters to mainstream | Survey of 1,250 supply chain leaders, 2025-2026 |
| Real-time execution-ready data | Only 30% of organizations report having it | Confirmed the visibility-to-execution gap is the real AI bottleneck | Survey data, cited in CXTMS coverage |
| Safety stock as resilience strategy | Dropped from 43% in 2025 to 28% in 2026 | Confirmed companies are shifting from buffer inventory to data-driven agility | Global Trade Magazine research |
| Inventory optimization technology adoption | 34% currently optimizing with technology | Showed 66% still running static formulas or lacking visibility for dynamic safety stock | Global Trade Magazine research |
| Amazon external logistics network | 200+ fulfillment centers, 80,000+ trailers, 24,000+ delivery vans, and 100+ aircraft opened to non-Amazon businesses | Turned a private retail logistics backbone into a general-purpose 3PL and parcel option shippers must benchmark independently | Supply Chain Dive / Reuters, CXTMS May 8 analysis |
| April LMI capacity collapse | Transportation capacity fell to 28.4 while pricing reached 95, a 67-point spread | Confirmed the freight-market turn from loose capacity to budget-risk escalation happened faster than annual procurement cycles can absorb | FreightWaves / Logistics Managers' Index, CXTMS May 8 analysis |
| DAT truckload pressure May signal | Van TVI 242.4, up 21% year over year; tender rejections around 13%; spot rates near $2.18 per mile | Reinforced that spot relief has ended and contract pressure is becoming lane-specific | DAT IQ / Logistics Management, CXTMS May 8 analysis |
| Cold storage capacity expansion | Global cold-chain capacity surpassed 460M cubic meters; U.S. cold-chain logistics market projected from $97.13B in 2026 to $133.87B by 2031 at 6.63% CAGR | Showed facility investment is rising even as reefer transportation tightens ahead of produce season | GCCA / Mordor Intelligence, CXTMS May 8 analysis |
| SMB tariff response | 97% of SMBs report active tariff mitigation strategies; 35% diversifying suppliers; 74% using price increases | Confirmed tariff strategy is no longer an enterprise-only playbook; smaller shippers are actively rewiring suppliers, inventory, and freight flows | Netstock / FreightWaves, CXTMS May 8 analysis |
| UPS Ground Saver scale-up | USPS final-mile handoffs reached 977,000 daily parcels in Q1 and were ramping toward 1.5M daily parcels in Q2 | Showed economy parcel is becoming a portfolio-design problem, not a single-carrier decision | Supply Chain Dive / FreightWaves, CXTMS May 8 analysis |
| UPS network redesign | 27 additional parcel facilities closing in 2026; $3B cost-reduction target | Confirmed parcel networks are being actively rebalanced around volume mix, postal injection, and automation economics | Supply Chain Dive / FreightWaves, CXTMS May 8 analysis |
| China-in-Mexico compliance pressure | Chinese investment in Mexico reached roughly $2.3B from 2017 to 2024 | Made the 2026 USMCA review a freight documentation and rules-of-origin test, not just a trade-policy event | FreightWaves / Reuters, CXTMS May 8 analysis |
| Warehouse automation as production platform | Warehouse automation market projected at $34.17B in 2026 and $65.74B by 2031; vertical farming automation can cut water use 95-99% | Showed automation moving upstream from fulfillment into production, inventory creation, and cold-chain distance reduction | Modern Materials Handling / Mordor Intelligence, CXTMS May 8 analysis |
| Execution-speed tech gap | Gartner found AI is not yet driving broad supply chain operating-model transformation, while Deloitte expects 40% of enterprise apps to integrate task-specific AI agents by end-2026 | Clarified the real bottleneck: governance and operating model redesign, not algorithm availability | Gartner / Deloitte / Logistics Management, CXTMS May 8 analysis |
| Agentic planning tools | Amazon Connect Decisions combines 25+ specialized supply chain tools into AI “teammates” and draws on Amazon experience managing 400M+ SKUs | Confirmed the next planning interface is moving from dashboards to action-oriented decision agents | Supply Chain Dive / Inbound Logistics, CXTMS May 9 analysis |
| Logistics IT demand | 65% of logistics technology providers reported 10%+ YoY sales growth; 52% grew customer base by 10%+ | Showed software demand remains strong, but integration debt is becoming the real bottleneck | Inbound Logistics, CXTMS May 9 analysis |
| Logistics IT solution mix | AI and optimization each cited by 77% of providers; data management/analytics 72%; process improvement 62%; predictive analytics 54%; machine learning 48% | Demonstrated that the market is converging around decision intelligence, not standalone visibility | Inbound Logistics, CXTMS May 9 analysis |
| Supply chain AI budgets | Average supply chain organization spent $24M on AI in 2025, while many projects ran over budget and need 12+ months to show results | Elevated AI governance, kill criteria, and phased deployment from IT concerns to financial controls | Gartner / Logistics Management, CXTMS May 9 analysis |
| Robotics adoption gap | 52% of surveyed operations already run robots, 32% plan to within three years, 74% of deployers hit business goals, but 47% of first-time buyers remain in education mode | Proved robotics is mainstream while business-case design and change management remain gating factors | Modern Materials Handling / Peerless Research Group, CXTMS May 9 analysis |
| Container-aware fulfillment | Exotec-style workstations can process up to 600 bins per hour; North America e-commerce warehouse market projected $13.45B in 2026 to $16.45B by 2031 | Showed e-commerce fulfillment moving from pick/pack zones toward workstation-level orchestration | Inbound Logistics / Mordor Intelligence, CXTMS May 9 analysis |
| Reverse logistics space | Free-return policies can force retailers to dedicate 15-20% of facility footage to reverse-logistics zones | Made returns layout and container logic core WMS/automation requirements | Mordor Intelligence, CXTMS May 9 analysis |
| Secondary capacity reset | Long-term contract rates up roughly 8% since last fall; tight markets push lanes into secondary capacity premiums | Turned primary-carrier compliance and routing-guide discipline into budget-control levers | FreightWaves, CXTMS May 9 analysis |
| Deferred maintenance risk | Vehicle out-of-service rate reached 21.6% across 3.3M inspections, implying 700,000+ vehicles removed annually | Showed maintenance backlog can remove capacity exactly when freight demand recovers | FreightWaves, CXTMS May 9 analysis |
| Fleet safety governance | J. J. Keller survey included 550 fleet professionals; 49% prioritized employees knowing safety matters, 46% prioritized safety above all else, 44% consistent safe choices | Shifted safety from compliance paperwork toward executive risk management and shipper/carrier selection | FreightWaves / J. J. Keller, CXTMS May 9 analysis |
| Manufacturing regionalization pressure | ISM manufacturing PMI held at 52.7; supplier deliveries rose to 60.6; war appeared in 47% of comments and tariffs in 18% | Confirmed regionalization is being driven by AI, tariff, quality, and geopolitical operating pressure at once | SupplyChainBrain / Reuters / ISM, CXTMS May 9 analysis |
| Sustainability operationalization | IDC predicts 80% of sustainability services engagements will focus on operationalizing strategy by 2027; 8% of global stock is wasted; packaging is about 40% of plastic waste | Moved sustainability from reporting into routing, consolidation, inventory, packaging, and fulfillment decisions | SupplyChainBrain / IDC, CXTMS May 9 analysis |
| Decision-intelligence savings | Food and beverage example saved more than $500,000 year to date through better fulfillment, inventory rebalancing, modes, and emissions decisions | Proved sustainability and cost optimization can share the same execution logic | SupplyChainBrain, CXTMS May 9 analysis |
| Cash logistics market | $29.86B in 2025 to $36.97B by 2030 at 4.36% CAGR | Showed cash handling becoming a data-rich replenishment, route-risk, and smart-safe forecasting network rather than only armored transport | Mordor Intelligence / CXTMS May 10 analysis |
| Cash-in-transit share | 47.23% of cash logistics market, while cash management grows 6.13% CAGR | Confirmed route planning remains critical even as smart safes and ATM telemetry shift value toward forecasting and exception control | Mordor Intelligence / CXTMS May 10 analysis |
| Cass April freight split | Shipments down 4.5% YoY but up 3.0% MoM; expenditures up 4.2% YoY; rates up 4.9% YoY and 2.4% MoM | Proved rate pressure can return before broad volume recovery, forcing budget planning around capacity rather than demand alone | Cass / Logistics Management / CXTMS May 10 analysis |
| TD Cowen/AFS May pressure | Truckload +10.2%, parcel +8.2%, and LTL +10.1% cost pressure signals | Confirmed pricing pressure was broad across modes, not a single-market anomaly | TD Cowen/AFS / Logistics Management / CXTMS May 10 analysis |
| DHL Asia-U.S. air capacity | Added heavy air-cargo capacity while some crisis-lane air rates were up 50%+ and fuel shocks lifted freight costs | Reinforced air as a controlled mode-switch tool for high-value or time-critical inventory, not a panic reflex | FreightWaves / Reuters / CXTMS May 10 analysis |
| Disaster logistics disruption expectation | 76% of supply-chain executives expect higher disruption levels in 2026 | Moved disaster-readiness from charity logistics into commercial resilience planning: response-time KPIs, tiered capacity, and constraint maps | Accenture / Food Logistics / ALAN, CXTMS May 10 analysis |
| Mexico food logistics market | $15.75B in 2025 to $21.08B by 2030 at 6% CAGR | Showed nearshoring is pulling food logistics, cold-chain coordination, and border warehouse control points toward Mexico-U.S. corridors | Mordor Intelligence / GCCA / CXTMS May 10 analysis |
| Mexico cold-chain logistics | $7.76B market with 6.3% growth signal | Confirmed temperature-controlled infrastructure is becoming part of cross-border manufacturing and food-distribution strategy | Mordor Intelligence / Food Logistics / CXTMS May 10 analysis |
| SKU governance pressure | Warehouse robotics adoption rose to 48%, up from 23% three years earlier; automated inventory systems can scan 5,000 to 35,000 locations | Proved dirty item masters, product codes, and SKU attributes become automation blockers once warehouses move from manual counts to continuous validation | Supply Chain Dive / MMH / CXTMS May 10 analysis |
| Reverse logistics ESG exposure | 16% of returns are fraudulent and fraud cost retailers $103B in 2024; 82% of consumers expect refunds within 48 hours | Reframed returns as a fraud, ESG, speed, and system-of-record problem rather than a back-room cost center | SupplyChainBrain / Inbound Logistics / CXTMS May 10 analysis |
| UK food logistics market | $28.47B in 2025 to $30.14B in 2026, reaching $38.85B by 2030 at 5.21% CAGR | Showed automated cold-chain warehouses moving toward value-added service platforms, not static storage | Mordor Intelligence / Inbound Logistics / CXTMS May 10 analysis |
| U.S. rail weekly momentum | 518,773 total carloads and intermodal units for week ending May 3, up 3.9%; intermodal up 3.9%; year-to-date total traffic 8.54M units, up 1.8% | Confirmed rail strength is broadening, while intermodal remains the strategic lever for long-haul truckload substitution | AAR / FreightWaves / CXTMS May 10 analysis |
| USPS sorting-center expansion | 14 new sorting and delivery centers, part of a redesign touching 19,000 delivery units | Made parcel planning more network-aware as USPS, UPS, and economy services rebalance induction points and delivery density | Supply Chain Dive / CXTMS May 10 analysis |
| Parcel carrier mix pressure | Parcel market shipment volume cited at 23.9B with TD Cowen/AFS parcel pressure above 8% | Reinforced parcel as a portfolio optimization problem across USPS, UPS postal handoffs, regional carriers, and owned fulfillment nodes | Logistics Management / TD Cowen/AFS / CXTMS May 10 analysis |
| AI talent premium risk | 75% of supply chain organizations that paused entry-level hiring in 2026 expected to pay premiums upward of 15% for early-career professionals by 2030 | Showed that AI workforce strategy can create future logistics cost and capability risk if junior talent pipelines collapse | Gartner / Logistics Management, CXTMS May 11 analysis |
| AI operating-model redesign gap | Only 17% of supply chain organizations pursuing immediate transformational workflow redesign; 83% applying AI incrementally | Confirmed AI is still mostly being absorbed into existing operating models rather than replacing them | Gartner / Modern Materials Handling, CXTMS May 11 analysis |
| MHI/Deloitte AI impact | 24% called AI transformational; 48% rated impact significant or greater, up 25 percentage points from 2025; robotics/automation at 39% significant or greater | Showed strategic urgency is rising faster than operating-model maturity | MHI / Deloitte / Modern Materials Handling, CXTMS May 11 analysis |
| RELEX AI decision confidence | 67% reported increased confidence in AI for supply chain decisions; 47% using or planning AI inventory optimization; 41% logistics/routing; only 10% trust fully independent decisions | Confirmed the practical model is human-governed AI recommendations, not unsupervised autonomy | RELEX / SupplyChainBrain, CXTMS May 11 analysis |
| Logistics IT AI solution availability | 77% of providers offer AI solutions, up 27 percentage points in two years; optimization also at 77%, analytics at 72%, predictive analytics at 54% | Reinforced that technology supply is plentiful while integration, governance, and adoption discipline are scarce | Inbound Logistics, CXTMS May 11 analysis |
| EU vehicle tariff risk | Proposed 25% tariff on EU cars and trucks, versus prior 15% cap; USTR reviewing two 25% Section 301 levies covering $32B and 500+ subheadings | Made product classification, origin evidence, and landed-cost approval operational prerequisites before automotive freight moves | Supply Chain Dive / Reuters, CXTMS May 11 analysis |
| Freight forwarding volatility | Forwarding market expected to grow 2.9% in real terms in 2025, while long-term contract rates are up roughly 8% since last fall and lane disruption remains uneven | Showed forwarders are monetizing control-tower services, not just capacity procurement | Logistics Management / FreightWaves, CXTMS May 11 analysis |
| Middle East air cargo shock | Capacity to the Middle East shrank more than 50% YoY in a two-week period; Vietnam-Europe rates nearly doubled to $6.27/kg | Confirmed air cargo optionality must be managed lane by lane, not as a generic premium mode | Reuters / WorldACD, CXTMS May 11 analysis |
| Material-handling equipment demand | New business volume reached $10.8B in March 2026; Q1 hit record high; volume up 18.6% YTD and 12.5% YoY | Proved warehouse capex remains active despite macro uncertainty, but sequencing matters more | Modern Materials Handling / ELFA, CXTMS May 11 analysis |
| Robotics deployment intent | 52% of surveyed warehouse/manufacturing operations already running robots and 32% planning to within three years | Confirmed robotic automation is mainstream enough that buyer discipline now matters more than novelty | Modern Materials Handling / Peerless Research Group, CXTMS May 11 analysis |
| Roadcheck compliance capacity risk | 2025 Roadcheck produced 56,178 inspections, 13,553 vehicle OOS violations, 3,317 driver OOS violations, 18.1% vehicle OOS rate, 5.9% driver OOS rate | Showed compliance data can remove capacity suddenly and belongs in routing-guide risk controls | CVSA / FreightWaves, CXTMS May 11 analysis |
| Tender rejection Roadcheck risk | Rejection rates around 12.7%, tender volumes up 11-13% YoY, with Roadcheck potentially pushing rejections to 16-17% for a week | Made pre-event capacity planning and compliance-screened backup carriers a practical need | FreightWaves, CXTMS May 11 analysis |
| Small-carrier bankruptcy stress | Recent filings included fleets with 52 tractors/52 drivers and up to $10M liabilities, 27 trucks/25 drivers and 2.6M miles, plus micro-carriers with 1-8 units | Confirmed carrier financial health is now routing-guide data, not only procurement background noise | FreightWaves, CXTMS May 11 analysis |
| LMI capacity deterioration | Freight capacity at 41.0 in 2026 versus 55.1 in 2025; flatbed tender rejects spiked to 48.74% in March | Reinforced that capacity quality and mode-specific tightness are diverging sharply | SupplyChainBrain / Logistics Managers' Index, CXTMS May 11 analysis |
| April Cass rate pressure | April shipments down 3.6% YoY while expenditures rose 1.2% annually and 3.3% from March; linehaul rates excluding fuel up about 30% YoY in Traffix coverage | Showed rate inflation is moving ahead of shipment-volume recovery | Cass / Logistics Management / FreightWaves, CXTMS May 11 analysis |
| Item-level IoT visibility | 65% of logistics technology providers saw 10%+ YoY sales growth and 52% grew customers by at least 10%, while Wiliot Gen3 pushed sensing closer to item-level condition data | Confirmed visibility demand is shifting from shipment tracking toward condition-aware execution signals | Inbound Logistics / Wiliot coverage, CXTMS May 11 analysis |
| Agentic customs readiness | Gartner framed autonomous-ready supply chains around operations, intelligence, and workforce; Deloitte warned agentic supply chains need governed data, broker handoffs, and auditable decision trails | Showed autonomy depends first on classification discipline, exception controls, and explainability in global trade | Deloitte / Gartner / SupplyChainBrain, CXTMS May 13 analysis |
| Air cargo demand contraction | Global cargo tonne-kilometers fell 4.8% YoY in March; international demand dropped 5.5%; available capacity slipped 4.7% | Shifted air planning from macro capacity assumptions to lane-level capacity trust, fuel exposure, and backup-gateway planning | IATA / CXTMS May 13 analysis |
| April warehouse storage squeeze | Overall LMI reached 69.9; aggregate logistics costs hit 242.4; inventory levels rose to 56.3; inventory costs stayed high at 74.7; warehouse utilization reached 64.4, capacity contracted at 45.5, and prices rose to 72.7 | Proved warehousing, inventory, transportation, detention, and appointment discipline are now one connected cost stack | FreightWaves / Logistics Managers' Index, CXTMS May 13 analysis |
| Cobot rotation in robot demand | North American companies ordered 9,055 robots worth $543M in Q1 2026; units were down 0.1% YoY and revenue down 6.4%, while cobot orders rose 55.6% to 1,637 units and revenue rose 78.2% to $69.8M | Confirmed automation spend is rotating toward practical, workflow-specific tools rather than broad megaprojects | A3 / Modern Materials Handling, CXTMS May 13 analysis |
| Non-automotive robotics momentum | Automotive OEM robot orders fell 35.1% in units and 48.2% in revenue, while life sciences/pharma/biomedical rose 54.1%, semiconductor/electronics rose 31.7%, plastics/rubber rose 25.2%, and food/consumer goods rose 16% | Showed logistics automation demand is broadening beyond automotive and becoming tied to facility-level productivity use cases | A3 / Modern Materials Handling, CXTMS May 13 analysis |
| Sustainable fleet diversification | Renewable natural gas accounted for 97% of natural gas transportation fuel in California; medium/heavy-duty BEV registrations rose 21% in 2025; 48% of fleet managers use AI, with 35% of fleets expected to be AI-enabled by 2027 versus about 20% today | Reframed decarbonization as lane-level portfolio optimization across BEV, RNG, renewable diesel, propane, hydrogen, maintenance, and dispatch intelligence | State of Sustainable Fleets / FreightWaves, CXTMS May 13 analysis |
| Gartner AI operating-model gap | Gartner/Modern Materials Handling reported only 17% of 140 senior supply chain leaders are pursuing immediate transformational workflow redesign; 83% are applying AI incrementally or gradually scaling it into integrated processes | Confirmed that the 2026 AI opportunity is real, but adoption speed is governed by data quality, semantic layers, workflows, decision rights, and change management | Gartner / Modern Materials Handling, CXTMS May 15 analysis |
| Warehouse slotting AI payoff | Adaptive slotting optimization can reduce warehouse travel time by 10% to 20% | Showed high-ROI AI is often narrow, operational, and embedded directly into repeatable work rather than packaged as broad autonomy | Logistics Management 2026 technology roundtable, CXTMS May 15 analysis |
| Public-sector logistics market | Government and education logistics projected at $568.60B in 2026 and $802.60B by 2031 at 7.14% CAGR; transportation held 49.66% share in 2025; value-added services projected at 10.57% CAGR | Put public procurement, audit trails, asset tracking, emissions compliance, and resilient distribution into the mainstream logistics-technology conversation | Mordor Intelligence / Inbound Logistics, CXTMS May 15 analysis |
| Retail logistics market | Retail logistics projected from $1.22T in 2026 to $1.57T by 2031 at 5.25% CAGR; transportation held 62.1% share in 2025; value-added services grow 6.5% CAGR and online channels 8.9% CAGR | Showed retail logistics margin shifting from basic transport toward returns, value-added fulfillment, carbon reporting, and orchestration | Mordor Intelligence / Supply Chain Dive, CXTMS May 15 analysis |
| Parcel carrier concentration reset | UPS, FedEx, and USPS fell from 85% of domestic parcel volume pre-pandemic to 61% of 23.9B annual deliveries by 2025; UPS/FedEx GRIs at 5.9% often land closer to 8-9% effective increases | Confirmed parcel procurement has moved from annual volume leverage to continuous portfolio optimization across carriers, surcharges, zones, and service commitments | Logistics Management parcel roundtable, CXTMS May 15 analysis |
| USPS contingency risk | USPS posted a $2B quarterly net loss, warned cash could run out as soon as February, and won approval for an 8% temporary priority mail/package surcharge through Jan. 17, 2027; dimensional noncompliance fee rose to $3 | Turned postal dependency, dimensional data quality, and economy-parcel injection into active carrier-risk controls | Reuters / Supply Chain Dive, CXTMS May 15 analysis |
| EV launch part-level risk | Lucid produced 5,500 vehicles but delivered 3,093 after a supplier issue disrupted Gravity SUV deliveries; prior full-year guidance of 25,000-27,000 vehicles was suspended | Proved finished-vehicle logistics can fail from component-level visibility gaps, making part-level supplier signals essential for EV launch control towers | Reuters / Supply Chain Dive, CXTMS May 15 analysis |
| Manufacturing cost-volatility signal | ISM manufacturing PMI held at 52.7 in April; supplier-delivery index rose to 60.6; crude prices climbed more than 50% since Feb. 28; war appeared in 47% of ISM comments and tariffs in 18% | Confirmed procurement inflation and supplier delays now transmit quickly into transportation planning, fuel exposure, and freight-budget reforecasting | Reuters / ISM / Inbound Logistics, CXTMS May 15 analysis |
| Self-funding AI economics | Accenture research cited average supply-chain digital maturity at 36% and autonomous process maturity at 21%; disruptions cost 3.9% of revenue on average, while intelligent planning can cut that to 1% or lower; autonomous sourcing can lift savings 1-2% and productivity 40-60% | Framed AI transformation as a reinvestment loop where early freight, planning, procurement, and fulfillment savings fund the next wave | Logistics Management / Accenture, CXTMS May 15 analysis |
| Visibility-to-execution platform shift | Penske Supply Chain Insight includes 85+ prebuilt/customizable metrics and AI natural-language queries across loads, orders, and performance data | Showed visibility platforms are becoming execution layers when they connect freight, warehousing, inventory, and partner exceptions into action workflows | Penske / Logistics Management / Inbound Logistics, CXTMS May 15 analysis |
| Cross-border parcel compliance pressure | U.S. de minimis changes subjected low-cost imports to duties; the White House said 90% of all cargo seizures in fiscal 2024 originated as de minimis shipments | Turned consumer parcel tracking events into compliance, landed-cost, and exception-routing data | Supply Chain Dive / White House, CXTMS May 16 analysis |
| China cross-border ecommerce logistics | Market projected from $28.28B in 2025 to $33.15B in 2026 and $60.62B by 2031 at 12.83% CAGR; value-added services grow 14.12% CAGR | Confirmed cross-border parcel value is shifting from transportation alone toward customs, returns, compliance, and visibility services | Mordor Intelligence, CXTMS May 16 analysis |
| Control-tower decision latency | Gartner cited only 17% of 140 CSCOs pursuing immediate transformational AI workflow redesign; 83% remain incremental | Showed faster decisions require defined ownership, exception rules, and workflows before AI can safely act | Gartner / Logistics Management / SupplyChainBrain, CXTMS May 16 analysis |
| Procurement-logistics integration | FedEx Dataworks integrated network delay signals into ServiceNow source-to-pay workflows | Proved supplier, shipment, carrier, and invoice data are becoming one operating signal at the moment of procurement decision | Supply Chain Dive / ServiceNow / FedEx, CXTMS May 16 analysis |
| India freight logistics growth | India freight and logistics projected at $383.77B in 2026 and $592.36B by 2031 at 9.07% CAGR; international CEP projected 10.73% CAGR | Put India into the core network-design agenda for global forwarders, especially parcel, pharma, D2C, and multimodal workflows | Mordor Intelligence, CXTMS May 16 analysis |
| India operating fragmentation | More than 75% of India's 3.5M trucks run by single-vehicle owners; commercial-driver gap at 22%, long-haul attrition at 38% | Showed India growth requires mixed-connectivity TMS workflows, not assumptions of uniform API maturity | Mordor Intelligence, CXTMS May 16 analysis |
| Industrial leasing rebound | U.S. industrial leasing rose 17.8% YoY in Q1 2026 to 145M square feet; 71.6% were new leases; big-box leasing rose 80.7% YoY; 3PL leasing rose 65.2% to 30M+ square feet | Reframed warehouse leasing as network redesign affecting drayage, parcel zones, inventory buffers, and customer promises | JLL / Logistics Management, CXTMS May 16 analysis |
| Port Tracker import planning risk | March covered-port imports reached 2.16M TEU, down 13.6% MoM and 0.6% YoY; first-half 2026 projected at 12.59M TEU, up only 0.5% YoY | Showed soft import volume can still create planning volatility through blank sailings, tariff timing, and inland arrival compression | NRF/Hackett Global Port Tracker / Logistics Management, CXTMS May 16 analysis |
| Supply-chain risk action gap | Marsh estimated global supply chain disruptions cost businesses about $184B annually, with 65% of companies facing at least one bottleneck at any given time | Turned risk management from alert monitoring into shipment-ranked response workflows | Marsh / Logistics Management, CXTMS May 16 analysis |
| AI scaling roadblocks | Gartner reported 56% of CSCOs cite legacy/process integration as a major AI challenge and 50% cite limited internal expertise | Confirmed risk intelligence and AI only matter when connected to the execution systems that manage loads, documents, carriers, and customers | Gartner, CXTMS May 16 analysis |
| Trojan Driver freight fraud | CargoNet recorded 3,594 cargo theft incidents and an estimated $725M in losses; strategic theft accounted for 1,839 incidents in 2025 | Proved carrier verification must become dynamic across dispatch, driver identity, pickup geofencing, and first-stop behavior | FreightWaves / TAPA / CargoNet, CXTMS May 16 analysis |
| Store-led speed fulfillment | Sam's Club one-hour delivery launched from 600+ locations; early deliveries averaged 55 minutes, with the fastest under 12 minutes | Showed stores are becoming speed nodes when inventory, labor, dispatch, and exception logic are coordinated | FreightWaves / Sam's Club, CXTMS May 16 analysis |
| Walmart ecommerce speed scale | Walmart ecommerce exceeded $150B; U.S. ecommerce reached 23% of Q4 sales; store-fulfilled delivery grew 50%+ and 35% of Q4 store-fulfilled orders arrived in under three hours | Made hour-level and sub-three-hour delivery a network-design benchmark, not a novelty service | FreightWaves / Walmart, CXTMS May 16 analysis |
| Air cargo April rate spike | Global air cargo spot rates rose 30% YoY in April to $3.34/kg; Southeast Asia-to-North America rose 33% to $6.46/kg; volumes were only up 2%, while dynamic load factor rose three points to 62% | Proved premium air procurement is increasingly a lane-capacity and load-factor decision, not just a fuel surcharge pass-through | Xeneta / Supply Chain Dive, CXTMS May 17 analysis | | Tariff-and-fuel importer exposure | Bob's Discount Furniture faced 10% global tariffs, 25% upholstery tariffs, upholstery at roughly 50% of product mix, and fuel pressure across trucking, linehaul, delivery, vendor, and ocean relationships | Showed importers need tariff, fuel, SKU margin, routing, and supplier scenarios in one operating model | Supply Chain Dive / Logistics Management, CXTMS May 17 analysis | | Industrial production freight signal | U.S. industrial production rose 0.7% in April after a 0.3% March decline; manufacturing rose 0.6%, motor vehicles and parts rose 3.7%, and April retail sales reached $757.2B, up 4.9% YoY | Turned macroeconomic signals into practical capacity-planning triggers for forwarders and shippers | Federal Reserve / SupplyChainBrain / Logistics Management, CXTMS May 17 analysis | | Warehouse automation physical-flow economics | Warehouse automation market projected from $34.17B in 2026 to $65.74B by 2031 at 13.98% CAGR; conveyors held 55.12% of 2025 revenue while mobile robots grow 14.87% CAGR | Confirmed robotics still needs engineered physical flow, integration discipline, and conveyor-heavy design in many sites | Mordor Intelligence / Modern Materials Handling, CXTMS May 17 analysis | | Yard gate automation scale | Outpost gate automation processes more than 3M gate events annually across terminals and customer sites | Showed yard gates are becoming machine-vision control points for arrival verification, dwell reduction, detention prevention, and security evidence | Logistics Management, CXTMS May 17 analysis | | Packaging superplant automation | Smurfit Westrock's $136M, 595,000-square-foot Pleasant Prairie superplant targets about 3B square feet of corrugated boxes annually with roughly 60% of traditional labor | Made packaging capacity a freight-network variable tied to manufacturing growth, automation reliability, and downstream parcel performance | Supply Chain Dive / SupplyChainBrain, CXTMS May 17 analysis | | Regionalized beauty logistics | Ulta's planned 395,000-square-foot Salt Lake City DC will serve up to 180 stores, create 400+ jobs, become its eighth DC, use AutoStore automation, and improve supported delivery speeds by up to one day | Proved regional DC design, automation, and same-day network strategy are complementary rather than competing models | Supply Chain Dive, CXTMS May 17 analysis | | USPS lightweight parcel reset | USPS shipping and packages revenue rose 4.5% YoY while volume fell 1.4%; Ground Advantage revenue rose 19.8% and volume rose 14.7%, even as USPS posted a $2B quarterly net loss | Turned sub-pound pricing, package dimensions, postal injection, and SKU-margin modeling into active parcel strategy | Supply Chain Dive, CXTMS May 17 analysis | | Alaska logistics edge | Ted Stevens Anchorage International Airport ranked as the fourth-largest air cargo hub globally; more than 70% of Alaska communities are served only by small aircraft or watercraft; the Don Young Port of Alaska handles about half of all freight entering the state | Reframed remote logistics as a strategic edge network for air cargo, fuel, emergency response, and constrained-port planning | Inbound Logistics, CXTMS May 18 analysis | | Asset-based carrier reliability | Transportation capacity fell 10.9% to 28.4 while transportation prices hit 95.0, creating a record 66.6-point spread; tender rejection rates remained above 14% in parts of the year | Showed why procurement is rotating toward asset-backed reliability, service evidence, and routing-guide resilience rather than pure rate minimization | Logistics Managers' Index / Supply Chain Dive / SONAR / Ryder, CXTMS May 18 analysis | | Canada power-grid freight buildout | Canada is planning to double electricity-grid capacity by 2050; IEA scenarios show global electricity consumption could rise as much as 102% or more | Turned electrification into a heavy-haul, permitting, port, rail, laydown-yard, and transformer logistics problem | SupplyChainBrain / IEA / CXTMS May 18 analysis | | Retail DC resilience | Dollar Tree opened a 1M-square-foot Arizona DC; U.S. retail and food-service sales rose 5.2% YoY in April, non-store retailers rose 11.1%, and general merchandise rose 6.19% in the CNBC/NRF Retail Monitor | Proved retail resilience depends on transit-time buffers, regional inventory, and replenishment control, not just more square footage | Supply Chain Dive / Logistics Management / CNBC/NRF, CXTMS May 18 analysis | | FedEx Network 2.0 shipper exposure | FedEx expects to close more than 475 stations by the end of 2027, about 30% of its facility footprint | Made parcel network redesign a shipper-side planning issue around pickup windows, contingency carriers, service promises, and exception monitoring | Supply Chain Dive / FedEx, CXTMS May 18 analysis | | USPS peak and sub-pound reset | USPS shipping and packages revenue rose 4.5% while volume fell 1.4%; proposed Ground Advantage sub-pound changes would average an 11.8% price increase | Put postal contingency planning, lightweight parcel economics, dimensional data, and carrier diversification into the active TMS workflow | Supply Chain Dive, CXTMS May 18 analysis | | Seaport densification | Port capacity strategy shifted toward dwell-time analytics, appointment control, gate-hour visibility, and predictive yard/drayage coordination rather than endless expansion | Showed ports can create usable capacity through data and orchestration before adding new acreage | CXTMS May 18 analysis | | CBP tariff refunds | $85B in accepted tariff refunds; related analysis cited $20.6B, 15.85M, 8.51M, and 3.48M-entry evidence points | Turned customs recovery into a finance, broker, documentation, and transportation workflow rather than a one-off refund exercise | Supply Chain Dive / Logistics Management / CXTMS May 27 analysis | | Logistics real estate tightening | U.S. logistics real estate construction starts fell from roughly 200M square feet to 190M square feet; vacancy data showed only 1.7% to 2.5% effective slack in key signals | Made lease decisions dependent on transportation, labor, inventory-buffer, and service-promise modeling | Prologis / Logistics Management / Inbound Logistics / CXTMS May 27 analysis | | TMS market expansion | Transportation management system market projected from $9.71B to $14.89B at 8.93% CAGR, with cloud TMS representing 61.23% share and growing 9.96% | Reinforced that execution ROI depends on separating macrologistics network design from micrologistics lane, dock, and order control | Inbound Logistics / Mordor Intelligence / CXTMS May 27 analysis | | U.S.-bound container imports | 2.635M TEUs in April; 12th straight monthly decline; goods from China down 28.9%, while apparel rose 6.5% and machinery fell 16.4% | Showed planning risk is mix, tariff timing, and mode conversion — not just headline volume decline | S&P Global Market Intelligence / Logistics Management / Supply Chain Dive / CXTMS May 27 analysis | | Sherwin-Williams outbound execution | 11% peak-season outbound volume lift; 56M paint gallons and 11.7M industrial coatings gallons shipped through a partner-ready network; 90% of orders had 24-hour replenishment expectations | Proved forecasts only become service when partner-ready workflows can absorb peak volume | Supply Chain Dive / Inbound Logistics / CXTMS May 27 analysis | | Robot supplier concentration | 75% of warehouse operators reported using or planning automation, while robot life cycles can run 10 years or more | Made mixed-fleet orchestration, spare-parts access, and vendor exit plans part of automation risk management | Inbound Logistics / Supply Chain Brain / CXTMS May 27 analysis | | Maritime modernization investment | $200M supply chain efficiency fund; congestion and port bottlenecks cost manufacturers nearly $40B annually and drain 65M hours; broader congestion costs exceed $109B | Confirmed private capital is targeting the physical infrastructure bottlenecks that digital execution systems must coordinate around | SupplyChainBrain / Logistics Management / CXTMS May 28 analysis | | De minimis and tariff refund finance | Detroit Axle sought about $44M tied to former $800 de minimis treatment; $20.6B in refunds was on its way; CBP had accepted roughly $85B in potential and certified refunds, with nearly 16M entries accepted and about 8.5M certified | Showed parcel finance now depends on entry-level evidence, second-ledger landed-cost reconciliation, and refund-specific legal logic | Supply Chain Dive / SupplyChainBrain / CXTMS May 28 analysis | | LNG corridor design | Germany-Canada deal covers up to 1M metric tons per year from a C$10B / $7.2B project targeting 12M metric tons annual capacity; LNG is 13% of Germany gas imports, 94% from the U.S. | Turned energy security into port, project-cargo, multimodal capacity, and scenario-planning work | SupplyChainBrain / CXTMS May 28 analysis | | Ocean charge governance | Maersk agreed to pay $1.9M plus refunds/waivers over container detention-charge allegations; four container makers allegedly represented about 95% of global standard dry container production | Made free-time clocks, milestone proof, and billing-review workflows core ocean procurement controls | Logistics Management / CXTMS May 28 analysis | | Industrial node disruption | Novelis Oswego has 1.7B pounds of annual aluminum sheet capacity; fires created an expected $1.7B negative cash-flow impact; North American shipments fell 19% | Proved plant recovery, substitute sourcing, and transportation contingency planning must be designed before a critical upstream node fails | Supply Chain Dive / Logistics Management / Deloitte / CXTMS May 28 analysis | | Service-tier cost signals | About 25% of Mattress Firm deliveries are contactless; in-home delivery starts at $109.99; threshold service expected at 15 minutes could stretch to 45 minutes | Showed carrier-rate optimization needs service-design, dwell-time, dimensional, zone, returns, and customer-promise signals, not just label-price comparison | Supply Chain Dive / Inbound Logistics / Logistics Management / CXTMS May 28 analysis | | Active caching and demand surges | Average supply chain disruption estimated at $1.5M per day; only 6% of businesses report full end-to-end visibility; 94% say disruptions have negatively affected revenue | Made inventory availability data and cache-refresh speed transportation execution issues, not just planning metrics | SupplyChainBrain / Logistics Management / CXTMS May 29 analysis | | Aerospace supplier-quality logistics | Boeing Q1 sales rose 14% to $22.22B while net loss narrowed to $7M from $31M | Showed supplier quality, traceability, and exception workflows can become production-rate constraints | SupplyChainBrain / CXTMS May 29 analysis | | Parcel partnership scale | DHL-USPS agreement worth well over $10B; USPS access covers 41,000+ ZIP codes and 170M+ delivery points six days a week | Proved final-mile strategy is becoming handoff design across private networks, postal infrastructure, sortation, and customer promises | Supply Chain Dive / Logistics Management / CXTMS May 29 analysis | | Freight spend control risk | Hub Group's $77M purchased-transportation understatement equaled about 2.8% of revenue and more than 65% of EBIT in analyst estimates; shares fell 19% after disclosure | Turned freight audit, accrual logic, carrier-rating evidence, and invoice controls into executive finance governance | FreightWaves / Logistics Management / CXTMS May 29 analysis | | Autonomous truck physical AI | Autonomous truck market estimated at $42.63B in 2026, growing to $74.23B by 2031 at 11.73% CAGR; Level 4 platforms forecast at 15.21% CAGR | Shifted autonomy readiness from technology hype to lane qualification, handoff procedures, insurance, geofence logic, and exception response | FreightWaves / Mordor Intelligence / CXTMS May 29 analysis | | Marketplace import compliance | EU fined Temu €200M, roughly $232M, after unsafe-product findings | Made SKU-level product safety, seller evidence, inspection holds, and returns disposition part of cross-border parcel execution | SupplyChainBrain / CXTMS May 29 analysis | | Rail merger planning | UP described the NS deal as an $85B mega-merger with claimed $3.5B in annual shipper savings; STB process includes a 12-month evidentiary window after acceptance publication | Forced intermodal shippers to model concentration risk, service alternatives, terminal exposure, and contract protections before the network changes | Supply Chain Dive / SupplyChainBrain / CXTMS May 29 analysis | | Export productivity and currency pressure | Euro appreciated roughly 10% against the U.S. dollar since January | Turned productivity gaps into freight-network risk through fulfillment rigidity, documentation delays, and cost-to-serve erosion | SupplyChainBrain / CXTMS May 29 analysis | | Critical-goods resilience | Deloitte research covered the global top 100 consumer products companies and 250 senior executives at companies above $500M in revenue | Reinforced that stockpiling only works when replenishment logic, supplier mapping, buffer location, and contingency routing are executable | SupplyChainBrain / Deloitte / CXTMS May 29 analysis | | 30-minute store fulfillment | Walmart can reach 36% of U.S. households within 30 minutes; planned expansion targets 1 million additional households, 150 stores, and 40 million households in five major metro areas | Turned store fulfillment into network-design infrastructure where inventory accuracy, picker labor, dispatch timing, drones, and carrier handoffs have to be modeled together | Supply Chain Dive / CXTMS May 30 analysis | | Upstream retail holding capacity | Target reported inventory turns up 10%; its Houston receive center is a $265M, 1.2M-square-foot node tied to millions of cartons of upstream flow | Showed upstream holding capacity can improve availability and speed when inventory, allocation, transport, and store-replenishment data are connected | Supply Chain Dive / CXTMS May 30 analysis | | Tariff-refund finance workflow | Tariff refund processing included $35.46B in payments, 15M refunds, $85B in accepted refunds, and related $20.6B, 15.85M, 8.51M, and 3.48M-entry evidence points | Made customs recovery a finance-grade documentation workflow spanning entries, origin proof, broker records, duty payments, and transportation history | CBP / Logistics Management / CXTMS May 30 analysis | | Warehouse-to-freight cost leakage | U.S. warehouse robotics market projected at $34.17B in 2026 and $65.74B by 2031; WMS-related market signals cited 13.98%, 32.31%, and 41.36% growth/adoption pressures | Showed that warehouse inefficiency leaks directly into freight spend through late waves, bad dimensions, rework, accessorials, and missed carrier cutoffs | Mordor Intelligence / CXTMS May 30 analysis | | Ocean contract and spot exposure | Ocean coverage cited rates roughly 28.9% below the 10-year average, 16.4% below pre-pandemic levels, and 20% below late-March contract assumptions in some lanes | Reinforced that muted peak-season demand does not eliminate spot risk; shippers still need lane-level contract coverage, trigger rules, and index discipline | FreightWaves / Xeneta / CXTMS May 30 analysis | | Rail service scorecards | OETA reporting creates 24-hour ETA discipline; service data showed 2.2%, 11.5%, 3.3%, and 1.4% movement signals in covered rail metrics | Moved rail procurement from anecdotal complaints toward carrier-reported, facility-level scorecards tied to delay cost and service accountability | STB / CXTMS May 30 analysis | | Dual-sourced SKU optionality | SharkNinja coverage cited 66%, 90%, and 10% tariff/sourcing exposure signals | Proved dual sourcing only creates resilience when landed-cost models, origin rules, SKU identity, and transport optionality are maintained lane by lane | Supply Chain Dive / CXTMS May 30 analysis | | Mexico air-freight expansion | UPS invested $50M in Mexico air capacity | Showed automotive and industrial shippers are buying governed speed: approval rules, customs readiness, part criticality, and post-shipment cost review matter as much as flight capacity | UPS / Supply Chain Dive / CXTMS May 30 analysis | | Procurement AI pilot discipline | Procurement AI coverage emphasized 60% to 70% workflow-improvement potential when pilots start with narrow, data-ready sourcing tasks | Confirmed agentic procurement ROI depends on small human-governed pilots connected to downstream transportation, warehousing, customs, and finance data | CXTMS May 30 analysis | | Diesel fuel volatility | National diesel averaged $5.523 per gallon for the week of May 25, down for three straight weeks but still more than $2 per gallon higher year over year; Hormuz handles about 20% of global oil supply | Made fuel surcharge tables, lane thresholds, and customer pass-through logic live routing-guide governance issues | Logistics Management / Reuters / SupplyChainBrain / CXTMS May 31 analysis | | Taiwan tariff classification | Section 232 treatment capped covered Taiwan auto parts, timber/wood products, and some aircraft components at 15%, retroactive to May 1 | Turned tariff relief into entry-correction, refund, HTS classification, and landed-cost evidence work | Supply Chain Dive / CXTMS May 31 analysis | | Vietnam Section 301 sourcing risk | USTR opened a May 29 Section 301 probe into Vietnam IP practices; comments are due July 2 | Made SKU-, supplier-, factory-, lane-, broker-, and customer-level exposure mapping urgent before possible tariffs or enforcement actions | Supply Chain Dive / USTR / CXTMS May 31 analysis | | USMCA origin proof | U.S.-Mexico negotiation rounds opened May 28-29, with June 16-17 and July 20 rounds scheduled; non-originating Mexico imports can face a 25% tariff | Shifted rules of origin from customs paperwork into freight planning, document control, and lane-level landed-cost modeling | Logistics Management / Supply Chain Dive / CXTMS May 31 analysis | | Food waste planning data | Food loss and waste represent 8% to 10% of global greenhouse gas emissions; U.S. food surplus is valued at $382B; unknown unsold-food outcomes fell from 27% to 15% in one year | Reframed food waste as a connected planning, shelf-life, quality, temperature, and exception-management problem | SupplyChainBrain / ReFED / Supply Chain Dive / CXTMS May 31 analysis | | Social impact traceability | More than 1,000 solar import shipments had been seized under UFLPA by November 2022; isotope testing found Xinjiang cotton in 19% of 822 sampled cotton products, with 57% of single-origin claims mislabeled as U.S.-only | Proved supplier declarations need product-level traceability, physical evidence, and shipment-linked exception workflows | Supply Chain Dive / Reuters / SupplyChainBrain / CXTMS May 31 analysis | | Amazon external logistics stack | Amazon Supply Chain Services opened freight, distribution, fulfillment, parcel, China-U.S. inbound shipping, and customs services to non-marketplace businesses across 200+ U.S. fulfillment centers, 80,000 trailers, 24,000 intermodal containers, and 100+ aircraft | Made outsourced networks a data-portability and independent benchmarking problem, not just a 3PL selection decision | Supply Chain Dive / FreightWaves / CXTMS June 1 analysis | | Amazon parcel performance | Amazon says it delivers more than 13B items annually with a 96.4% average on-time delivery rate | Confirmed parcel data now belongs upstream in inventory positioning, fulfillment-node logic, and customer-promise planning | Supply Chain Dive / CXTMS June 1 analysis | | Clinical trial supply concentration | More than 65% of global active pharmaceutical ingredients are manufactured in China and India; supplier and manufacturing changes can take months rather than weeks | Turned clinical-trial resilience into a pre-shipment lane, supplier-change, document-readiness, and regulatory-timing workflow | Deloitte / CXTMS June 1 analysis | | U.S. pharma cold-chain growth | U.S. pharmaceutical logistics grows from $75.96B in 2025 to $78.65B in 2026 and $93.47B by 2031; cold chain held 52.77% share in 2025; clinical trial materials grow 6.79% CAGR | Showed trial logistics is becoming a specialized control-tower market where temperature, customs, site, and patient-window data must stay connected | Mordor Intelligence / CXTMS June 1 analysis | | Digital cold-chain monitoring | Digital cold-chain management rises from $8.69B in 2025 to $10.07B in 2026 and $21.06B by 2031 at 15.90% CAGR; in-transit monitoring grows 17.2% CAGR | Moved cold-chain proof from after-the-fact logger reports to live exception workflows | Mordor Intelligence / CXTMS June 1 analysis | | Electronics labor-continuity risk | Samsung strike exposure involved more than 45,000 workers, with later suspended action covering nearly 48,000 union members | Made labor negotiations an upstream supply and transportation-planning signal for electronics, semiconductor, automotive, and industrial networks | Reuters / CXTMS June 1 analysis | | Supply chain disruption cost | Global disruptions cost businesses an estimated $184B annually, and 65% of companies face at least one bottleneck at any given time | Reinforced that labor, cyber, tariff, supplier, and carrier risks need action playbooks, not passive alerts | Logistics Management / CXTMS June 1 analysis | | Secure control-tower maturity gap | Nearly 80% of U.S. companies faced some form of supply chain disruption in 2025 versus 33% in 2024; only 19% deploy AI tools at scale while roughly 40% deploy advanced planning and scheduling | Showed trusted data layers, role-based access, and audit trails are now prerequisites for AI-enabled logistics execution | Logistics Management / McKinsey / CXTMS June 1 analysis | | Supply chain AI operating-model gap | Only 17% of supply chain organizations are pursuing immediate transformational redesign with AI; 83% are applying AI incrementally or scaling gradually into existing processes | Proved AI ROI depends on workflow ownership, exception taxonomy, adoption review, and integration design more than model availability | Gartner / CXTMS June 1 analysis | | 2026 innovation mix | Top innovations being added in 2026 include AI and machine learning at 27%, computer vision at 23%, supply chain digitization at 18%, and generative AI at 17% | Confirmed investment is still flowing, but implementation discipline is becoming the differentiator | Kenco / Inbound Logistics / CXTMS June 1 analysis | | Aerospace supplier recovery pressure | Airbus targeted 10% non-industrial spending cuts after delivering 793 aircraft in 2025, below an earlier roughly 820 target, and targeted 870 deliveries in 2026 after Q1 deliveries fell 16% year over year | Turned premium freight, supplier promise adherence, document dwell, and shortage-to-shipment cycle time into aerospace cost-control metrics | Reuters / CXTMS June 1 analysis | | Critical minerals concentration | The DRC supplies more than 70% of global cobalt; Congo's quota framework included 18,125 metric tons for Q4, a 96,600-ton annual export cap from 2026, and a 10% strategic reserve equal to 9,600 metric tons | Made origin proof, quota status, customs data, ESG evidence, and multimodal chain of custody part of battery and industrial logistics execution | Reuters / CXTMS June 1 analysis | | Inland port rail resilience | Fort Smith received $8.1M in federal funds for rail expansion after 2019 flooding damaged 20% of port capacity; Arkansas rail traffic showed 230,831 carloads up 2.2% and 292,743 intermodal units up 11.5% | Turned small-port rail redundancy into measurable disaster-readiness and regional capacity planning | Talk Business & Politics / Logistics Management / SupplyChainBrain / CXTMS June 2 analysis | | Supplier footprint migration | Autoliv plans to exit Turkey manufacturing by 2028, affecting 2,200 jobs; related USMCA review exposure can make non-originating imports face 25% tariffs | Made supplier exits, origin rules, and freight routing one connected transition plan | Turkiye Today / Logistics Management / CXTMS June 2 analysis | | Postal labor and parcel dependency | Canada Post agreements were ratified by 86% and 89% of bargaining units and run to 2029; DHL eCommerce's USPS partnership is worth more than $10B and covers 170M annual parcels | Shifted parcel planning from strike contingency into service-design, carrier mix, and postal health monitoring | Supply Chain Dive / Logistics Management / CXTMS June 2 analysis | | Green yard operational proof | YMX reported 10,000 trailers, 225,000 moves, 34,500 drivers, and 1,000 electric yard trucks; transportation produced 30,822M metric tons of CO2e in 2025, with road responsible for 68.7% | Reframed sustainability around yard-move evidence, emissions measurement, and automation-ready proof instead of ESG claims | PR Newswire / EPA / MHI / CXTMS June 2 analysis | | Heavy air cargo shock absorber | IATA forecast 71.6M tonnes of air cargo and $158B revenue in 2026; Mexico air-freight investment and industrial lanes saw 35% to 50% premium-service exposure in some use cases | Made air cargo a selective pressure valve for industrial and automotive networks, not a blanket expedite strategy | Logistics Management / IATA / SupplyChainBrain / CXTMS June 2 analysis | | Manufacturing PMI freight signal | May manufacturing PMI hit 54, with production at 55.9, new orders at 56.8, supplier deliveries at 54.3, prices at 60.6, and backlog at 42.7 | Showed freight planners should watch production and supplier-delivery signals before orders translate into capacity demand | Logistics Management / ISM / CXTMS June 2 analysis | | Next-day retail facility economics | Target's Houston receive center is a $265M, 1.2M-square-foot facility designed to process 3M to 3.5M cartons and support next-day delivery to 185 stores | Confirmed upstream inventory buffers are becoming fulfillment-speed infrastructure | Supply Chain Dive / CXTMS June 2 analysis | | Trucking credit and capacity health | Trucking employs roughly 3.5M drivers; capacity exits ranged from 250,000 to 400,000 trucks in weak-market estimates; carrier failures and credit metrics are improving but uneven | Made carrier financial health a capacity signal for routing guides and procurement timing | Yahoo Finance / Logistics Management / SupplyChainBrain / CXTMS June 2 analysis | | USPS cash and parcel risk | USPS spending cuts are tied to expected cash stress in 2027, while postal-dependent parcel networks still move about 170M annual parcels through major partnerships | Put postal financial health, induction rules, surcharges, and contingency carriers back on the parcel risk dashboard | Logistics Management / Supply Chain Dive / CXTMS June 2 analysis | | 3PL outsourcing maturity | 94% of domestic Fortune 500 companies use at least one 3PL, up 46% from 2001; technology, retail, and healthcare 3PL customer sectors are growing at 8.7%, 7.9%, and 7.7% CAGR | Made partner governance and independent execution data a strategic control point | Armstrong & Associates / Logistics Management / CXTMS June 4 analysis | | Complex 3PL account governance | Some large 3PL accounts exceed $100M, while Volkswagen works with 74 different 3PLs | Showed consolidation does not eliminate operational complexity; it raises the value of cross-partner visibility | Armstrong & Associates / CXTMS June 4 analysis | | Warehouse robotics mainstream adoption | 52% of surveyed operators already use one or more robot types; 67% cited reduced labor costs as the most important factor; 57% prioritized order/case picking, 32% heavy-payload fork/tugger robots, and 31% sortation | Confirmed robotics has crossed from pilot budget to operating design, with integration now the constraint | Modern Materials Handling / Peerless Research Group / CXTMS June 4 analysis | | Cold-chain network change | Americold targeted more than $25M in annual overhead reductions, while DHL Supply Chain and RLCold plan more than 5M square feet of advanced temperature-controlled facilities | Proved cold-chain maps need live network, dwell, reefer, and facility-performance data instead of static node lists | FreightWaves / Inbound Logistics / CXTMS June 4 analysis | | Forced-labor origin proof | Proposed U.S. forced-labor tariffs cover 60 trading partners; CBP previously detained 5,059 shipments valued at $1.7B under forced-labor enforcement | Turned labor-risk evidence into a shipment-level customs and logistics workflow | Supply Chain Dive / CBP / CXTMS June 4 analysis | | Steel and aluminum tariff documentation | Certain Canada/Mexico producers may request reduction from 50% Section 232 tariffs to 25%; new derivative categories also face 25% duties | Made supplier master data, HS codes, plant records, raw-material evidence, and shipment audit trails direct landed-cost controls | Supply Chain Dive / Reuters / CXTMS June 4 analysis | | Summer load-density pressure | Average orders per consolidation load increased 19% from January through April 2026; diesel surged nearly 50% after the late-February Iran strike | Pushed shippers toward dynamic consolidation, cutoff management, mode switching, and fuel-aware routing rules | SupplyChainBrain / FreightWaves / CXTMS June 4 analysis | | Q2 brokerage rate reset | Producer price inflation around 6%, carrier exits, stricter broker vetting, and Q1 spot rates up 16% YoY | Confirmed lane-level brokerage strategy beats static national assumptions in a capacity-sensitive market | FreightWaves / SupplyChainBrain / CXTMS June 4 analysis | | AI interface commoditization | McKinsey warned AI may let entrants quickly and cheaply replicate powerful logistics software interfaces; one transportation case used 50 AI agents to automate 60% of check calls, 73% of order acceptances, 80% of paper invoice payments, and 2M quotes | Shifted durable software advantage below the screen into data quality, integrations, exception ownership, and execution control | McKinsey / Deloitte / SupplyChainBrain / CXTMS June 5 analysis | | Data-center freight demand | Microsoft, Amazon, Meta, and Alphabet planned roughly $630B in AI-related 2026 spending, with about 70% going to Nvidia chips and the balance to land, buildings, and power gear | Made flatbed, heavy-haul, permits, appointment discipline, and milestone visibility strategic capacity controls | Reuters / McKinsey / FreightWaves / CXTMS June 5 analysis | | Latin America automation readiness | EXPO PACK México 2026 is expected to host 700+ exhibitors; 71% of companies increased packaging and processing machinery investment in 2025; 34% of surveyed logistics professionals identify technology upgrades as a top priority | Showed packaging automation, robotics, and AI are moving from event-floor interest into regional manufacturing execution budgets | Modern Materials Handling / PMMI / Inbound Logistics / CXTMS June 5 analysis | | Great Plains fulfillment capacity | Rush Order and Encore added central-U.S. fulfillment capacity; covered metrics included 350,000 square feet, 93% two-day coverage, and one-to-two-day dock-to-shelf flow | Confirmed regional fulfillment nodes are becoming parcel-zone, inventory-positioning, and customer-promise pressure valves | FreightWaves / Inbound Logistics / CXTMS June 5 analysis | | India last-mile growth | India last-mile delivery grows from $7.96B in 2026 to $14.45B by 2031 at 12.67% CAGR; same-day delivery grows 14.32% CAGR; broader India freight/logistics reaches $315.89B in 2026 and $476.51B by 2031 | Proved urban fulfillment density, COD governance, returns control, and carrier optionality are now market-entry requirements | Mordor Intelligence / Reuters / CXTMS June 5 analysis | | Japan value-added 3PL shift | Japan 3PL reaches $40.41B in 2026 and $48.38B by 2031; domestic transportation held 46.20% share in 2025, while value-added warehousing grows 4.17% CAGR and healthcare/cold-chain services 5.73% CAGR | Showed 3PL competition is shifting from transport coverage toward kitting, labeling, reverse logistics, omnichannel pools, and temperature-controlled proof | Mordor Intelligence / Inbound Logistics / CXTMS June 5 analysis | | RFID and shelf-ready packaging | North America folding cartons grow from $13.14B in 2026 to $18.88B by 2031 at 7.52% CAGR; Amazon RFID requirements add roughly $0.05 to $0.10 per unit | Turned carton design, RFID, and shelf-ready packaging into warehouse labor, inventory accuracy, and automation-input strategy | Mordor Intelligence / Modern Materials Handling / Inbound Logistics / CXTMS June 5 analysis | | Port truck-flow bottlenecks | Port Houston secured a $48M federal grant for Bayport Container Terminal capacity and exit-gate improvements | Confirmed port capacity now depends as much on truck gates, drayage reliability, appointments, and inland handoffs as berth or yard expansion | FreightWaves / Logistics Management / CXTMS June 5 analysis | | Agentic AI operating readiness | Gartner forecasts supply chain management software with agentic AI will grow to $53B in spend by 2030; McKinsey cited a transportation case using 50 AI agents to automate 60% of check calls, 73% of order acceptances, 80% of paper invoice payments, and 2M quotes | Reinforced that agentic AI value depends on process discipline, decision rights, workforce readiness, and auditability before autonomy | Gartner / McKinsey / SupplyChainBrain / CXTMS June 6 analysis | | Freight capacity tightening | FreightWaves described June 2026 as volatile and capacity-sensitive; producer-price inflation was around 6%; SupplyChainBrain reported Q1 spot rates up 16% YoY | Showed capacity can tighten before broad demand recovery, making lane-level triggers and secondary capacity rules urgent | FreightWaves / SupplyChainBrain / Logistics Management / CXTMS June 6 analysis | | Maintenance hangover risk | Used truck auction demand improved after 18 months to two years of weak buying; peak-cycle Volvo 860 tractors sold for $240K-$250K in 2022, roughly $50K above new | Turned carrier equipment age, maintenance discipline, and auction signals into service-reliability inputs | FreightWaves / SupplyChainBrain / CXTMS June 6 analysis | | Multi-carrier parcel networks | UPS, FedEx, and USPS fell from 85% of domestic parcel volume before the pandemic to about 60% by 2025; Amazon handled 6.7B parcels in 2025 versus USPS at 6.6B; U.S. parcel revenue reached $196B | Made carrier diversification, surcharge governance, and parcel allocation logic core e-commerce operating capabilities | Logistics Management / FreightWaves / Inbound Logistics / CXTMS June 6 analysis | | Ocean peak-season surcharge risk | China-U.S. East Coast 40-foot container rates rose from $2,600 to more than $5,000; CMA CGM announced a $2,600 East Mediterranean-to-U.S. East Coast increase and a separate $1,000 West Mediterranean surcharge; Ocean Volume Index rose from 49,032 to 65,346 | Proved surcharge governance and quote validity need live controls even when demand remains uneven | FreightWaves / Inbound Logistics / CXTMS June 6 analysis | | Perishable inventory visibility | USDA estimates 30-40% of the U.S. food supply is lost or wasted; 61% of food businesses say they lack full visibility into where waste occurs | Moved shelf life, inventory age, reefer performance, and recall scope into transportation execution | Food Logistics / Inbound Logistics / CXTMS June 6 analysis | | Rare earth export-control exposure | Rare earth elements market estimated at 208.02 kilotons in 2026, growing 5.61% CAGR to 273.30 kilotons by 2031 | Made component-level origin, allocation, documentation, and mode planning critical for automotive, aerospace, electronics, and industrial supply chains | Reuters / Mordor Intelligence / CXTMS June 6 analysis | | UPS healthcare logistics specialization | UPS Healthcare targets $20B annual healthcare revenue by 2026 after about $10.5B in 2024; UPS agreed to acquire Andlauer Healthcare Group for $1.6B, including 31 Canadian temperature-controlled facilities; UPS is shedding about $5B in Amazon revenue and 2M daily pieces | Showed major parcel carriers are reallocating networks toward high-value, compliance-heavy, temperature-controlled logistics | Supply Chain Dive / CXTMS June 6 analysis | | AI transportation optimization | Coupa users reported planning work shrinking from four to six weeks to four to six hours; Sonepar reduced 26-foot box trucks from 68 to 43 and generated about $3.4M in lease-cost savings; Jabil ran 50+ scenarios and found roughly $25M in logistics savings and avoidance | Turned network optimization from periodic study into near-real-time planning discipline | FreightWaves / SupplyChainBrain / CXTMS June 7 analysis | | April LMI budget pressure | April LMI reached 69.9, up from 65.7; transportation prices hit 95.0 while transportation capacity fell to 28.4; the 66.6-point price-capacity gap was the largest on record | Made scenario-based freight, warehousing, and inventory reforecasting urgent before month-end variances appear | Logistics Management / FreightWaves / CXTMS June 7 analysis | | Freight infrastructure grant readiness | DOT's freight plan covers a network moving 54M+ tons of goods worth $68B+ daily across nearly 7M miles; congestion and bottlenecked ports cost manufacturers nearly $40B annually and 65M hours | Made shipper-side data on bottlenecks, economic impact, safety, emissions, and resilience a prerequisite for public-private infrastructure wins | Logistics Management / FreightWaves / CXTMS June 7 analysis | | Facility expansion before recovery | Averitt planned cross-dock and warehouse expansions in Louisville and Charlotte; CGB's $47M Indiana grain project adds 4.25M bushels and 200% more truck-unloading capacity | Showed targeted capacity bets are being placed before broad recovery, especially where cross-dock density, export handling, cold chain, and regional positioning matter | FreightWaves / Logistics Management / CXTMS June 7 analysis | | Truck-air network convergence | FedEx is investing $54M in Duiven, Netherlands, adding 65 dock doors, 265 docking spaces, and 50%+ more palletized handling capacity to support a $90B deferred air cargo market | Proved premium air strategy increasingly depends on road-hub throughput, cutoff discipline, and truck-fly-truck orchestration | FreightWaves / Inbound Logistics / CXTMS June 7 analysis | | Weather-risk planning | The Operational Pressure Index hit a record 44 in February 2026; 30% of logistics firms cited unforeseen events including severe weather as the primary pressure driver; disruptions were reported up 38% | Moved weather from external disruption note into routing, maintenance, facility, inventory, and customer-communication playbooks | Inbound Logistics / Logistics Management / FreightWaves / CXTMS June 7 analysis | | Same-day LTL network design | New same-day LTL models can dispatch cargo vans or box trucks within one hour of booking; ArcBest LTL renewals rose 6.3% while ABF posted a 97.3% operating ratio | Made emergency regional capacity, cutoff logic, and service-parts replenishment part of normal network design rather than ad hoc expediting | Inbound Logistics / FreightWaves / Logistics Management / CXTMS June 7 analysis | | Automotive and industrial service parts | UPS invested nearly $50M in automotive and industrial logistics, including RFID visibility, Mexico air-ground options, freight pricing for 150+ pound shipments, Roadie same-day delivery, and 300+ specialists | Showed service-parts logistics now needs SKU-level promise logic, regional stocking, time-definite mode choice, and exception control | Supply Chain Dive / Inbound Logistics / Logistics Management / CXTMS June 7 analysis | | WMS labor-relief buying | A 336-leader warehouse report emphasized instant data and operational relief; MMH found 52% already using robots, 32% planning deployment within three years, and labor costs the top robotics driver at 67% | Shifted WMS and automation evaluation from feature lists toward measurable first-90-day labor, throughput, and exception improvements | SupplyChainBrain / Modern Materials Handling / Inbound Logistics / CXTMS June 7 analysis | | WTO trade and inventory timing | WTO goods barometer slipped from 102.3 to 101.7 while QIMA found 43% of supply chains changed sourcing geography in 2025, 60% mapped supply chains, and 74% planned digitization investments in 2026 | Made purchasing calendars, buffer stock, supplier geography, and trade-compliance evidence more sensitive to subtle demand deceleration | Reuters / Logistics Management / Inbound Logistics / CXTMS June 7 analysis | | June LMI capacity squeeze | June LMI reached 71.1, the first reading above 70 since March 2022; inventory levels rose to 60.5, warehouse capacity contracted to 47.5, transportation prices reached 92.4, and transportation capacity fell to 30.8 | Turned market-index monitoring into lane, storage, routing-guide, and customer-promise trigger management | Logistics Management / FreightWaves / CXTMS July 14 analysis | | Truckload pricing power | Combined dry van, flatbed, and refrigerated rates were reported up about 45% YoY; 2027 contract rates forecast up 17%, spot rates forecast up 35%, and English-proficiency enforcement may reduce capacity by 5%-10% | Showed rate governance must connect capacity loss, enforcement, fuel, tender acceptance, and repricing triggers before annual bids fail | Logistics Management / FreightWaves / CXTMS July 14 analysis | | AI hardware air-cargo pressure | Global air cargo demand rose 7% YoY in June; global spot rates averaged $3.40/kg, up 38% YoY; Northeast Asia-North America spot rates rose 41% from late February to late June; AI-related freight can be under 10% of volume and still set marginal pricing | Made premium air allocation a governed capacity pool tied to SKU priority, customer penalties, lane exposure, and rate ceilings | Supply Chain Dive / Xeneta / Logistics Management / Mordor Intelligence / CXTMS July 14 analysis | | Mexico driver shortage | Mexico's commercial-driver vacancy rate is roughly 14%; about 90,000 trucks are idle for lack of qualified drivers; 44% of surveyed Mexican carriers expect shortages to worsen; trucking held 92.44% of U.S.-Mexico cross-border mode share in 2025 | Turned cross-border carrier depth, bilingual dispatch coverage, driver qualifications, and recovery history into network-capacity data | FreightWaves / IRU / Mordor Intelligence / CXTMS July 14 analysis | | Warehouse robotics dock constraint | Exotec raised $335M at a $2B valuation; Skypod robots can increase storage capacity up to 5x and picking speed about 5x; Decathlon planned 55 Skypods across 30 sites to handle 8M items per year | Proved faster picking shifts the constraint toward dock slots, trailer capacity, cutoffs, and outbound transportation orchestration | FreightWaves / CXTMS July 14 analysis | | Packaging flexibility and warehouse software | General Mills targets $3B in cumulative cost savings by 2030 and $750M in current fiscal-year savings; MMH found 49% of respondents use WMS/inventory software, while 25% plan WMS upgrades and 21% plan WES upgrades within two years | Made package dimensions, formats, pallet patterns, channel rules, and warehouse-system handoffs part of transportation execution data | Supply Chain Dive / Modern Materials Handling / CXTMS July 14 analysis | | Inland and border infrastructure triggers | Ambassador Bridge handles about 40,000 daily crossings and $323M in goods per day; Europe faces a 500,000-driver shortfall that could reach 745,000 by 2028; EU rail freight fell 2.8% YoY in H1 2024 | Showed bridge choice, water-gauge thresholds, load-factor changes, and modal fallback capacity need structured exception rules before congestion or low water hits | Supply Chain Dive / Mordor Intelligence / Logistics Management / CXTMS July 14 analysis | | Tariff-date ocean booking calendars | Transpacific spot rates reached $6,200 per FEU to the U.S. West Coast as of July 4, up 120% since mid-May; Asia-U.S. East Coast rates reached $8,000 per FEU, up 85% over six weeks; U.S. logistics costs remained $2.4T, or 7.8% of GDP | Made arrival date, tariff effective date, inventory intent, rate exposure, and booking justification part of one import-planning calendar | FreightWaves / Supply Chain Dive / Logistics Management / CXTMS July 15 analysis | | Intermodal mode-shift trigger | IANA's July IVI estimate came in at 106.8, the second-highest 2026 reading; May intermodal volume rose 4.4% YoY to 1,618,761 units; truckload contract rates for 2027 were forecast up 17% YoY | Turned intermodal conversion from a periodic bid exercise into a weekly trigger tied to truckload pressure, fuel, drayage capacity, cutoffs, and service risk | Logistics Management / IANA / CXTMS July 15 analysis | | Renewable project-cargo deadline risk | U.S. renewable energy capacity is estimated at 545.16 GW in 2026, growing to 778.78 GW by 2031; U.S. solar is estimated at 269.54 GW in 2026; global energy storage is projected from 0.54 TW in 2026 to 1.52 TW by 2031 | Made safe-harbor deadlines, FEOC compliance, permits, heavy-haul capacity, component origin, site readiness, and commissioning milestones logistics control fields | Deloitte / Mordor Intelligence / CXTMS July 15 analysis | | Electrical component origin proof | Section 232 actions include 50% tariffs on full-value imported steel and aluminum and 25% tariffs on derivative products; solar costs could rise 36%-55% and onshore wind costs 32%-63%; U.S. operating storage capacity reached 37.4 GW by October 2025 with a 187 GW pipeline by 2030 | Turned component origin, domestic content, tariff exemption status, critical-mineral exposure, and receiving readiness into infrastructure logistics evidence | SupplyChainBrain / Deloitte / CXTMS July 15 analysis | | End-to-end 3PL event control | Strauss and DHL's Columbus hub can process up to 1.3M units annually; a 1% exception rate would create 13,000 units needing attention; international transportation management grew 7.7% in 2025 to $85.9B, while domestic transportation management is forecast up 8.3% in 2026 to $139B | Showed broad 3PL deals need order, personalization, inventory, pick, pack, transfer, tender, POD, and exception events in one reviewable control file | Supply Chain Dive / Logistics Management / Armstrong & Associates / CXTMS July 15 analysis | | Last-mile promise economics | Last mile can account for as much as 54% of total delivery cost; the global CEP market is estimated at $724.98B in 2026 and $928.43B by 2031; North America CEP is estimated at $225.81B in 2026 and $280.7B by 2031 | Shifted delivery promises from marketing defaults toward margin-aware rules covering address confidence, zone density, order value, appointment limits, carrier fit, and failure cost | SupplyChainBrain / Mordor Intelligence / Inbound Logistics / CXTMS July 15 analysis | | Port drayage roadway design | Savannah's $126M Brampton Road Connector opens July 16, linking Garden City Terminal directly to I-16 | Proved drayage visibility needs route design, rail-crossing exposure, appointment buffers, inland handoffs, driver instructions, and shared 3PL/carrier/customer assumptions | Supply Chain Dive / Inbound Logistics / CXTMS July 15 analysis | | Logistics decision governance | Gartner grouped 2026 supply chain technologies under autonomy and agency, specialization and intelligence, and trust and governance, including agentic AI, physical AI, collaborative multiagent systems, intelligent simulation, domain-specific language models, product provenance, and decision governance | Made logistics trust depend on decision logs, confidence thresholds, guardrails, exception ownership, override reasons, and outcome feedback rather than EDI uptime alone | Gartner / Modern Materials Handling / Inbound Logistics / CXTMS July 15 analysis | | TL/LTL rate and accessorial pressure | Truckload rate-per-mile reached a 14-quarter high at 16% above the January 2018 baseline and is projected to hit 17.7% in Q3; LTL rate-per-pound reached an all-time high at 76.5% above baseline; fuel surcharges were more than 60% above the June 2025 benchmark | Turned shipment-level rating, fuel tables, accessorial audit, tender depth, and budget triggers into Q3 planning controls | FreightWaves / Logistics Management / CXTMS July 16 analysis | | Mid-sized shipper carrier leverage | Combined dry van, flatbed, and refrigerated rates were reported up roughly 45% YoY; 2027 truckload contract rates were forecast up 17% and spot rates up 35%; spot rates were also cited up 60% YoY while contract rates rose 15% since January | Made carrier leverage a routing-guide, service-promise, and budget-reforecast workflow rather than a procurement-only issue | Logistics Management / FreightWaves / CXTMS July 16 analysis | | Transpacific controlled air capacity | DHL added a three-times-weekly Bangkok-to-Cincinnati Boeing 777 freighter service with 100 tons of capacity per flight; Hanoi service runs four times weekly and Taipei once weekly; China-to-U.S. West Coast ocean spot rates were cited up 37% | Showed oversized, high-value, and deadline-critical freight needs pre-modeled air fallback rules before ocean disruption forces a panic expedite | Supply Chain Dive / FreightWaves / Logistics Management / CXTMS July 16 analysis | | Cross-border ecommerce data quality | U.S. cross-border ecommerce logistics is estimated at $17.55B in 2026 and $26.15B by 2031 at 8.30% CAGR; U.S. retail ecommerce sales reached $326.7B in Q1 2026, up 9.8% YoY; cross-border ecommerce can account for more than 50% of China-to-U.S. cargo capacity | Made item data, landed cost, HTS records, return paths, and parcel handoffs service-level infrastructure | Mordor Intelligence / Supply Chain Dive / Inbound Logistics / CXTMS July 16 analysis | | Amazon holiday fulfillment fee exposure | Amazon's 2026 holiday fulfillment fees run Oct. 15-Jan. 14, average $0.32 per unit, and stack on top of a 3.5% fuel and logistics surcharge; examples ranged from a phone case rising from $2.49 to $2.68 to a 50-to-70-pound TV rising from $48.57 to $51.38 | Turned peak-season timing into a margin model across inbound ship date, storage, stockout exposure, fulfillment fees, and direct-ship fallback | Supply Chain Dive / Mordor Intelligence / Inbound Logistics / CXTMS July 16 analysis | | Smart conveyor and RFID readiness | Smart conveyor systems are forecast to grow from $6.1B in 2025 to $27.8B by 2035 at 16.3% CAGR; UPS invested more than $100M in RFID package sensing across its U.S. small-package network and 5,500+ UPS Store locations | Showed warehouse automation now needs downtime records, maintenance response, WMS/WES handoffs, dock schedules, and parcel-event quality before throughput promises scale | Modern Materials Handling / Inbound Logistics / Gartner / CXTMS July 16 analysis | | Product provenance as execution data | Gartner named product provenance a 2026 supply chain technology trend, with AI, blockchain, and knowledge graphs helping scale proof across complex supply networks | Moved provenance from compliance archive into shipment-level operating fields for customs, food safety, sustainability, claims, and customer proof | Gartner / Inbound Logistics / CXTMS July 16 analysis | | Sanctions and tariff routing risk | A revised U.S. Russia sanctions bill cut a prior blanket 500% tariff proposal to a possible maximum 100% tariff on the top five purchasers of Russian oil and gas | Turned sanctions monitoring into supplier geography, landed-cost, customs-code, inventory-buffer, and routing-scenario controls | Reuters / CXTMS July 16 analysis | | Auto port-choice distribution strategy | Mitsubishi began Port Freeport operations on April 28 and moved more than 500 vehicles through the port that month; China-to-U.S. West Coast ocean spot rates were also cited up 37% in peak-season ocean coverage | Made RoRo port selection a downstream distribution scorecard across vessel operations, processing, storage, truck/rail connectivity, dealer distance, and proof of performance | Supply Chain Dive / Logistics Management / CXTMS July 16 analysis | | Public supply-chain trend filtering | Inbound Logistics' 2026 logistics IT survey found 65% of technology providers reported sales growth of 10%+ YoY, 52% grew customer count by at least 10%, 77% offer AI solutions, and data management/analytics reached 72% | Confirmed operators need issue-specific signal filters that convert trend chatter into owners, data checks, and execution decisions | Inbound Logistics / CXTMS July 16 analysis | | 4PL outcome ownership | The 4PL market is projected to grow from more than $86.2B to over $163.7B by 2035 | Turned lead logistics provider governance into a control file covering scope, decision rights, KPI definitions, savings baselines, and exception accountability | Food Logistics / Global Market Insights / CXTMS July 17 analysis | | Rail merger network evidence | Proposed UP-NS merger review cited an $85B transaction, a combined 52,215 route miles across 43 states, service to roughly 100 ports, and $2.75B in expected annual synergies within three years | Made rail, intermodal, terminal, interchange, fallback-mode, and emissions assumptions part of a shipper rail-risk file | FreightWaves / Logistics Management / AAR / CXTMS July 17 analysis | | Rail and intermodal momentum | U.S. rail carloads rose 1.5% in 2025 to 11,508,767; through May 2026 carloads were up 3.4% YoY to 4,756,909; May intermodal volume rose 8.1% and 2025 intermodal reached 14.06M units | Confirmed regulatory rail change is arriving while demand is already tightening, raising the value of lane-level rail readiness data | Logistics Management / AAR / CXTMS July 17 analysis | | Diesel emissions compliance evidence | One diesel-tampering case involved more than $10M in illegal tuning-device revenue; another involved disabling onboard diagnostics on at least 344 heavy trucks between 2017 and 2020 | Moved fleet emissions status, inspection history, maintenance evidence, state exposure, and customer sustainability requirements into carrier qualification | FreightWaves / Inbound Logistics / CXTMS July 17 analysis | | Border-aware retail fulfillment | About two-thirds of Lululemon's U.S. ecommerce orders were historically fulfilled through Canada, while its new Brampton DC uses AutoStore automation for U.S. and Canada fulfillment | Showed omnichannel node decisions now need SKU velocity, duty exposure, parcel zones, customs data, store impact, and returns logic before allocation | Supply Chain Dive / Deloitte / CXTMS July 17 analysis | | Always-on supply-chain gap | About 67% of companies started supply-chain transformations in the prior 12 months, but only 10% hit their top three strategic targets | Proved live sensing needs exception ownership, severity rules, response deadlines, allowed actions, and closed-loop outcome records | Supply Chain Dive / Kearney / AWS / CXTMS July 17 analysis | | Third-party cyber continuity | 65% of large companies rank third-party and supply-chain vulnerabilities as their greatest cybersecurity challenge, up from 54% in 2025; cyberattacks on carriers, 3PLs, and logistics providers surged 61% from 2024 to 2025 | Turned vendor cybersecurity from procurement questionnaire into continuity controls for bookings, EDI, documents, labels, customs release, and POD flows | Food Logistics / World Economic Forum / SupplyChainBrain / Everstream Analytics / CXTMS July 17 analysis | | Manufacturing labor freight readiness | 354,000 durable-goods manufacturing job openings remained unfilled as of May 2026; more than one-third of surveyed manufacturing executives named smart-manufacturing workforce enablement as their top concern | Connected plant staffing gaps to late releases, dock misses, ASN quality, packaging exceptions, and premium-freight triggers | SupplyChainBrain / U.S. Department of Labor / Deloitte / CXTMS July 17 analysis | | Construction material risk registers | Construction-goods effective tariff rates climbed to 25%-30% in 2025; steel and aluminum tariffs reached up to 50%; project abandonment activity rose 88.2% YoY in August 2025 | Made supplier geography, critical-path dates, permits, site constraints, substitution rules, delay cost, and escalation owners part of project-freight control | Deloitte / FreightWaves / SupplyChainBrain / CXTMS July 17 analysis | | Semiconductor ramp input control | Bosch began sample production at its first U.S. semiconductor plant under a finalized $225M Commerce Department agreement; 44% of supply chain respondents named forecasting and visibility as their top 2026 technology focus | Turned sample-production logistics into a controlled record for specialty gases, cleanroom supplies, high-value inbound freight, inspection steps, and approved inputs | Reuters / Inbound Logistics / CXTMS July 18 analysis | | Packaging commodity volatility | Section 232 aluminum and steel tariffs rose from 25% to 50%; the U.S. imports about 80% of tinplate steel used for food cans; resin prices rose about 6% in April and another 14% in May | Made package format, supplier exposure, cube utilization, pallet plan, and transportation-cost model part of the same planning record | Supply Chain Dive / Inbound Logistics / CXTMS July 18 analysis | | Retail ERP cutover data | Levi's moved from nine ERP systems toward one standardized cloud ERP after more than 10 years of consolidation work | Reframed ERP cutovers as fulfillment-risk events requiring order, inventory, allocation, carrier, return, and exception data controls before launch | Supply Chain Dive / Logistics Management / CXTMS July 18 analysis | | Food acquisition transition playbook | Food cold-chain monitoring components are forecast at 14.45% CAGR through 2030, driven by FSMA 204 and IoT-enabled monitoring | Showed food-brand integration needs first-90-day controls across SKU masters, lot records, temperature rules, carrier approvals, customer promises, and recall paths | Mordor Intelligence / CXTMS July 18 analysis | | Replenishment timing signal | U.S. business inventories rose 0.3% month over month to roughly $2.74T in May after a revised 0.6% April gain, while sales accelerated | Turned inventory-to-sales pressure into a logistics trigger for supplier lead time, dock capacity, replenishment windows, and expedite thresholds | Reuters / CXTMS July 18 analysis | | Tariff-refund landed-cost governance | Helen of Troy expected $9.2M in first-phase tariff refunds, had secured $1.8M, and still had another $71M in IEEPA tariffs outside phase one; U.S. tariff refunds reached $81B fiscal-year-to-date versus $5B a year earlier | Proved refund workflows must stay tied to freight costs, duties, surcharges, currency assumptions, SKU margin, finance owners, and shipment records | Supply Chain Dive / SupplyChainBrain / CXTMS July 18 analysis | | Shipment-level emissions evidence | PepsiCo reported 70% sustainable ingredient sourcing in 2025, targeted 90% by 2030, expanded regenerative agriculture to 4.7M acres, and lowered its 2030 Scope 3 reduction target from 40% to 30% | Moved Scope 3 freight reporting from annual reconstruction toward shipment-level carrier, mode, supplier, origin, and methodology evidence | Supply Chain Dive / Inbound Logistics / Deloitte / CXTMS July 18 analysis | | Supplier compliance readiness | Renfro expanded Inspectorio AI tools for responsible sourcing, regulatory compliance, traceability, and supplier performance management | Made supplier approval, audit status, origin proof, labeling approval, release timestamp, exception owner, and affected shipment part of a logistics readiness file | Supply Chain Dive / SupplyChainBrain / CXTMS July 18 analysis | | Singapore transshipment optionality | Singapore's 3PL market is estimated at $6.02B in 2026 and $7.23B by 2031 at 3.74% CAGR; China-to-U.S. West Coast spot rates were up 37% as Asian transshipment congestion spread | Turned hub optionality into a control-tower discipline across feeder lanes, customs files, inventory days of supply, alternate hubs, recovery cost, and customer priority | Mordor Intelligence / Logistics Management / CXTMS July 18 analysis | | Postal middle-mile scenario rules | USPS' UPS air agreement is worth more than $10B through March 2030; Priority Mail volume fell 24.1% YoY in fiscal 2025; three-to-five-day First-Class Mail traveling by air rose from 2% to 50% by mid-2026 | Made postal dependency a parcel scenario file covering air-vs-ground assumptions, induction cutoffs, fallback nodes, service promises, and margin thresholds | Supply Chain Dive / Logistics Management / CXTMS July 18 analysis | | AI server freight constraint | Worldwide semiconductor revenue is forecast above $1.3T in 2026, with hyperscaler AI infrastructure spending expected to rise more than 50%; Qatar accounts for roughly 30% of global high-purity helium output | Turned AI rack logistics into a project-risk file covering chips, power gear, cooling systems, custody rules, site readiness, scarce inputs, and commissioning milestones | Gartner / Global Banking & Finance / Inbound Logistics / CXTMS July 19 analysis | | China infrastructure priority freight | Survey of 292 Chinese supply chain leaders showed sourcing diversification at 58%, near-shoring at 38%, friend-shoring at 36%, and inventory increases at 32%; global project logistics is estimated at $487.62B in 2026, growing to $624.06B by 2031 | Made project milestones, material classes, long-lead components, heavy-haul constraints, and priority owners part of live freight allocation | ECNS / SupplyChainBrain / Mordor Intelligence / CXTMS July 19 analysis | | Cold-storage energy accountability | Top 25 temperature-controlled logistics companies operate 7.76B cubic feet of space; U.S. cold-chain logistics is estimated at $97.13B in 2026 and $133.87B by 2031 | Moved cold-chain energy from facility bill to load-level accountability across appointments, reefer status, door dwell, temperature bands, and exception ownership | Food Logistics / Mordor Intelligence / CXTMS July 19 analysis | | Elevated freight-rate calendar | TD Cowen/AFS index is based on more than $11B in annual freight spend; U.S. business logistics costs totaled $2.4T, or 7.8% of GDP; trade policy changed on average every 1.5 weeks in 2025 | Turned Q3 rate pressure into lane-level effective dates, index periods, accessorial triggers, contract exposure, and customer pass-through rules | Logistics Management / Inbound Logistics / CXTMS July 19 analysis | | Automation support capacity | Exotec's new headquarters spans 25,000 square meters, supports 700+ employees, and includes 11 operational systems; Komar's Savannah deployment targets up to 50% throughput improvement, 30% storage-density improvement, and orders in two minutes or less | Made automation vendor support, test capacity, software release cadence, outbound dock flow, and transportation readiness part of the warehouse automation business case | Modern Materials Handling / MHI / CXTMS July 19 analysis | | Live procurement and voice search | Gartner estimated up to $234B in enterprise application software spend is exposed to agentic AI arbitrage by 2030 and predicted 40% of enterprise applications would feature task-specific AI agents by 2026, up from less than 5% in 2025 | Reframed carrier availability as operating data across tender signals, voice interactions, negotiation events, compliance checks, bookings, and performance feedback | Food Logistics / FreightWaves / Gartner / CXTMS July 19 analysis | | Ocean bid-window redesign | Port of Los Angeles handled more than 1M TEUs in June; Hormuz war-risk premiums were reported 33x above normal rates and the strait is tied to as much as 30% of global crude oil shipments | Turned annual ocean contracts into rolling bid-window controls across carrier commitments, fuel surcharges, volume bands, chokepoint risk, and customer-priority thresholds | Supply Chain Dive / Logistics Management / FreightWaves / CXTMS July 19 analysis | | Stronger LMI exception triggers | U.S. LMI rose from 69.5 in May to 71.1 in June, the first reading above 70 since March 2022; suggested escalation thresholds include dock utilization above 90% and inbound ETA variance over 12 hours | Converted macro index strength into lane, facility, inventory, tender, and warehouse-dwell triggers before expansion becomes bottleneck pressure | SupplyChainBrain / U.S. Census Bureau / Logistics Management / CXTMS July 19 analysis | | Trade-fraud release evidence | DOJ Trade Fraud Task Force recoveries crossed $1B in less than a year; cited cases included a $549.5M settlement, 2.2M aluminum extrusions, 563 jewelry shipments worth $693M, and roughly $38M in avoided duties | Put supplier identity, HTS rationale, country-of-origin basis, valuation, broker status, and release approvals inside the shipment record | Inbound Logistics / SupplyChainBrain / CXTMS July 19 analysis | | AI application outcome proof | Gartner estimated up to $234B in enterprise application software spend is exposed to agentic AI arbitrage by 2030; example baseline metrics included 82% tender success, 14-hour exception resolution, 18% detention recovery, 27% freight-bill manual review, and 96-minute dock dwell | Moved logistics software renewals from module ownership toward auditable outcome files tied to tenders, exceptions, detention, invoice review, dwell, and service improvement | Gartner / CXTMS July 20 analysis | | Marine fuel optionality | Ship-to-ship transfers held 39.9% of bunker fuel methods in 2025; LNG barge-to-ship operations are forecast at 30.1% CAGR through 2031; marine propulsion engine market estimated at $39.69B in 2026 and $45B by 2031 | Made fuel pathway, bunkering availability, emissions claim, surcharge exposure, fallback fuel, and customer allocation part of ocean lane governance | Mordor Intelligence / CXTMS July 20 analysis | | Fleet camera evidence rules | Gartner predicted 60% of supply chain disruptions will be resolved without human intervention by 2031; demand for supply chain roles requiring AI skills rose 387% from 1Q23 to 1Q26 | Turned AI fleet cameras from more video into evidence governance across retention, consent, claims, coaching, detention disputes, deletion, and shipment records | Gartner / CXTMS July 20 analysis | | Manufacturing buffer release rules | Deloitte cited 285 global trade professionals using technology for route evaluation, risk, savings, and scenario modeling; U.S. chipmaking commitments exceeded $500B by July 2025, with domestic capacity projected to triple by 2032 | Reframed DDMRP buffers as transportation release controls connecting supplier timing, dock readiness, expedite thresholds, trade risk, and constrained industrial capacity | Deloitte / CXTMS July 20 analysis | | Diesel allocation risk | Russia accounts for roughly 12% of global diesel exports; TD Cowen/AFS found truckload rates at nearly four-year highs and LTL pricing at another record high; oil and gas equipment imports were nearly $10B in 2024 and tariffs could raise value-chain costs 4%-40% | Made fuel availability a lane-level allocation playbook across carrier acceptance, reefers, inventory priority, surcharge exposure, customer promises, and emergency capacity | SupplyChainBrain / Logistics Management / Deloitte / CXTMS July 20 analysis | | Finished vehicle staging capacity | U.S. finished vehicle logistics market estimated at $40.29B in 2026 and $51.11B by 2031; transportation held 75.00% of 2025 revenue; warehousing and distribution forecast at 6.62% CAGR through 2031; domestic flows held 76.11% share | Moved finished-vehicle execution beyond railcars and haulaway trucks into processing-center capacity, EV handling, yard dwell, dealer allocation, unit visibility, and staging proof | Mordor Intelligence / Logistics Management / CXTMS July 20 analysis | | Retail supplier-change modeling | 66% of surveyed retail respondents would restructure supply chains through onshoring, nearshoring, or supplier diversification if input costs rise in 2026; Europe freight and logistics market estimated at $1.52T in 2026 and $1.79T by 2031 | Turned sourcing changes into transportation scenarios covering landed cost, lead time, border risk, mode choice, capacity, customs evidence, and service promises before supplier awards | Deloitte / Mordor Intelligence / CXTMS July 20 analysis | | Defense shipyard port readiness | Saronic's Port Alpha is planned as a $3B-plus Brownsville shipyard with up to 10,000 jobs; Port of Brownsville spans 40,000 acres, has a 17-mile channel, and completed a $295.2M project to deepen the channel by 10 feet | Made defense manufacturing logistics a port-readiness file across docks, channel depth, heavy-lift capacity, security, supplier sequencing, permits, and milestone ownership | FreightWaves / CXTMS July 20 analysis | | Saudi heavy-freight milestone control | Saudi Arabia project logistics estimated at $2.27B in 2026 and $3.04B by 2031 at 6.13% CAGR; transportation held 64.32% of 2025 share; oversized cargo held 30.91%; energy generation and transmission forecast at 7.73% CAGR | Confirmed project cargo needs milestone controls across permits, ports, cranes, site access, escorts, delay costs, critical path, and escalation ownership before heavy freight moves | Mordor Intelligence / Reuters / CXTMS July 20 analysis | | Governed GenAI delivery answers | Third-party GenAI tools are beginning to answer delivery, return, duty, and exception questions outside shipper-controlled channels | Made answer governance a logistics data problem covering source authority, status freshness, duty and returns language, exception rules, customer-facing confidence, and escalation paths | CXTMS July 20 analysis |
Technology Use Cases by Category
AI and decision automation
- Freight invoice audit and dispute automation
- Accessorial fee taxonomy, duplicate-invoice detection, and carrier-charge validation
- Dynamic modal selection across truckload, LTL, rail, and parcel
- Predictive tender rejection and carrier risk monitoring
- Demand sensing and inventory optimization
- Tariff scenario modeling and resilience planning
- Trade-policy exposure maps that tie Section 301 investigations, rebate proposals, product lists, customs brokers, qualified cold-chain lanes, and inventory triggers to regulated shipments
- Fuel-sensitive routing-guide scenario modeling tied to surcharge bands, diesel indexes, lane thresholds, and customer pass-through rules
- Customs classification and formal-entry workflow automation
- Broker-ready import data workflows that validate commercial invoices, HTS rationale, supplier identity, origin evidence, broker tasks, and audit trails before booking or tender
- AI-guided carrier pricing and network simulation
- Autonomous exception handling inside control towers
- Agentic sourcing and supplier onboarding
- Procurement orchestration through task-specific AI agents
- Dynamic safety stock recalculation based on lane performance, seasonality, and supplier reliability
- Execution-speed governance that defines when AI can recommend, trigger, escalate, or automatically complete logistics actions
- AI teammate models that bundle specialized planning, inventory, disruption, and sourcing tools into role-based workflows
- AI budget governance with kill criteria tied to dock throughput, exception triage time, detention prevention, and customer-status latency
- Smart-safe cash forecasting, ATM replenishment prediction, and route-risk scoring for high-security logistics
- Mode-switch playbooks that pre-rank air, ocean, rail, truckload, and parcel alternatives by cost, service, inventory value, and disruption severity
- Human-governed AI recommendation workflows where planners approve high-risk inventory, routing, replenishment, and customer-commitment decisions
- AI workforce planning that protects entry-level talent pipelines while automating narrow logistics workflows
- Agentic customs workflows with bounded authority, broker handoffs, classification confidence scoring, and complete audit trails
- Air cargo premium-trigger logic that ranks backup gateways, fuel risk, capacity trust, load factor, and customer-critical inventory by lane
- Self-funding AI program controls that convert verified audit, planning, procurement, and fulfillment savings into the next transformation budget
- Natural-language logistics intelligence layers that let operators query loads, orders, exceptions, and performance metrics without leaving execution workflows
- Decision-latency scoring in control towers, measuring time from signal to owner assignment, recommendation, approval, execution, and customer update
- AI-assisted import and capacity scenario planning that turns Port Tracker, tariff, supplier, and booking signals into alternate routing actions
- Predictive port-density models that use dwell, gate, appointment, vessel-bunching, chassis, and drayage signals to unlock capacity before physical expansion
- Tariff-adjusted landed-cost engines that recalculate sourcing decisions as refunds, entries, pallet-mark rules, duties, and broker evidence change
- Active caching workflows that refresh inventory availability fast enough to protect demand-surge routing, allocation, and customer promises
- Workforce-orchestration engines that treat labor availability, skills, task queues, and transportation cutoffs as one execution constraint
- Fulfillment network redesign models that compare centralized DC, regional node, store-fulfilled, drone, and multi-carrier options against real order density and service promises
- Daily freight-market intelligence rituals that convert rate, weather, fuel, tariff, and rejection signals into routing-guide, budget, and customer-update actions
- AI transportation-optimization loops that compress carrier, route, fleet, and sourcing scenarios from weeks into hours while preserving approval gates and cost evidence
- Scenario-based budget reforecasting tied to LMI price-capacity gaps, inventory costs, warehousing prices, fuel inflation, and service-risk thresholds
- AI interface risk testing that separates demo-layer productivity from audited workflow completion, exception ownership, and data-quality performance
- Agentic AI readiness gates covering process standardization, decision rights, exception thresholds, human escalation, and audit logging before autonomous execution
- AI hallucination controls that require source verification, internal knowledge grounding, confidence scoring, and human approval before procurement, compliance, or customer-facing actions
- Delivery-promise engines that segment free-shipping speed by product margin, customer value, carrier reliability, address quality, regional capacity, and inventory confidence
- Procurement-supply chain control loops that connect supplier terms, tariff exposure, lane cost, inventory policy, service performance, and margin impact before sourcing decisions become freight exceptions
- Finance-aware planning models that connect inflation, interest rates, inventory carrying cost, forecast confidence, expedite exposure, and mode mix before working-capital targets create transportation exceptions
- Quantum-readiness maps that identify high-constraint routing, network design, maintenance scheduling, and inventory-allocation problems where clean data and structured constraints matter before future solvers arrive
- Decision-governance records that capture AI recommendation source, confidence, guardrail, human override, exception owner, action taken, and outcome feedback before logistics automation earns operating authority
- Import demand-sensing workflows that separate tariff avoidance, real replenishment, supplier delay recovery, inventory buffering, and speculative frontloading before bookings become capacity commitments
- Handoff-rule engines that define the system of record, trigger event, owner, allowed automation, manual override, audit log, and performance metric before robotics, IoT, digital twins, AI, or edge systems move from pilot to production
- Replenishment timing engines that connect inventory-to-sales ratios, supplier lead-time drift, dock capacity, sales acceleration, inbound appointment risk, and expedite thresholds before stock positions tighten
- Voice-enabled procurement records that capture tender offer, carrier response, rate counter, compliance status, booking event, driver or dispatcher interaction, and execution outcome before real-time carrier availability disappears
- LMI-to-exception trigger models that turn inventory levels, warehouse utilization, transportation capacity, rate indexes, inbound ETA variance, and dock utilization into lane-level planning actions
- AI application outcome files that tie renewal value to tender success, exception resolution, detention recovery, freight-bill touch rate, dock dwell, user action logs, and audited cost or service movement
- Governed GenAI answer sets that define which shipment status, duty, return, delay, delivery promise, and exception answers can be exposed through third-party AI tools and which require human escalation
- DDMRP-to-transportation release rules that turn buffer color, supplier status, dock readiness, customs exposure, expedite authority, and customer-service impact into controlled freight actions
Warehouse and fulfillment technology
- OMS + WMS as a unified stack replacing standalone WMS as single system of record
- Bin-level real-time inventory accuracy instead of warehouse-level or SKU-level tracking
- Returns workflow automation triggering immediate label generation, inbound receipt scheduling, and return-to-stock routing
- Goods-to-person picking with AMRs and robotic sortation
- Machine vision and depth sensing for safer autonomous movement
- Voice-enabled and hands-free workflows in cold storage and high-throughput facilities
- Robot orchestration across mixed fleets and mixed vendors
- AI-connected planning across dry, refrigerated, and constrained food networks
- Perishable waste-reduction workflows that connect store/SKU forecasts, shelf-life data, inbound quality inspection, markdown timing, donation, and disposal outcomes
- Micro-fulfillment for same-day and one-hour delivery strategies
- Ship-from-store orchestration across retail store networks
- WMS labor-relief roadmaps that define the first 90 days of measurable improvement in picking, replenishment, exception queues, and automation utilization
- Adaptive node concentration into fewer, stronger automated sites
- Connected worker task orchestration replacing static work assignment
- Bulk trailer unloading (Berkshire Grey Scoop system) — the automation sweet spot for high-variability, judgment-required tasks
- Dark warehouse and lights-out fulfillment for high-throughput operations
- WMS scalability architecture: evaluating platform trajectory from $50M to $200M without re-implementation
- Mordor Intelligence e-commerce WMS CAGR at +4.2% above baseline from SKU proliferation
- Production-linked warehouse automation where growing, kitting, manufacturing, storage, and fulfillment share one execution layer
- Container-aware fulfillment workstations that collapse pick, pack, weigh, and exception handling into a single operator station
- Reverse-logistics zone planning as a first-class WMS and automation-design constraint
- SKU/product-code governance tied to slotting, robotics navigation, drone cycle counting, ASN validation, and return-to-stock workflows
- Automated food and cold-chain warehouses that combine storage, kitting, labeling, quality inspection, and transport-aware billing
- Capex sequencing models that rank robotics, material handling, slotting, and depalletizing investments by bottleneck relief and integration readiness
- Cobot deployment playbooks for ergonomics-heavy, repetitive, high-volume tasks where large fixed automation is too rigid
- Modular ecommerce fulfillment designs using FlexBins, pallet shuttles, inventory drones, and integrated WMS/TMS promise logic
- Value-added retail fulfillment workflows for returns triage, kitting, labeling, packaging compliance, carbon reporting, and channel-specific customer promises
- Store-as-speed-node orchestration for one-hour, three-hour, same-day, and deferred service levels across inventory, labor, dispatch, and substitutions
- Warehouse-footprint modeling that connects lease decisions to drayage, parcel zones, linehaul, labor, inventory buffers, and exception exposure
- Inflation-aware inventory-placement workflows that connect supplier lead-time drift, lane reliability, safety stock, premium freight, and customer-service commitments before demand rebounds unevenly
- Conveyor-versus-robot roadmap modeling that treats physical flow, vertical movement, carton mix, uptime, and WMS/WES integration as first-order automation design variables
- Packaging superplant and right-sized packaging workflows that connect corrugate availability, cartonization logic, parcel dimensions, and manufacturing demand signals
- Regional DC automation models that combine AutoStore, store replenishment, e-commerce promise logic, and route planning for one-day service improvements
- Retail resilience DC design that links regional inventory placement, store replenishment cadence, transit-time reduction, and parcel-zone exposure
- Seismic and slab-readiness checks built into AS/RS, rack, automation, and warehouse go-live planning
- Mixed-robot supplier-diversification models that score spare parts, software lock-in, middleware portability, safety certification, and replacement timelines before automation becomes a single-vendor choke point
- Unitizing and load-stability workflows that connect stretch wrapping, cartonization, pallet quality, damage prevention, and transportation visibility to throughput metrics
- Supplier-quality traceability workflows that move part-level inspection, quality holds, and logistics synchronization together for aerospace and other rate-constrained manufacturing networks
- WMS-to-freight leakage controls that connect wave timing, cartonization, dimensions, dock readiness, cutoffs, and carrier accessorials before warehouse defects become transportation spend
- Brownfield modernization roadmaps that sequence WMS fixes, AMR/cobot pilots, dock-flow changes, and middleware around measured workflow friction
- Robotics readiness scorecards covering workflow fit, master-data quality, integration depth, operating ownership, maintenance, safety, and execution visibility
- Shelf-ready packaging and RFID workflows that reduce touches, support zone-level inventory confirmation, and feed automation cleaner carton-level inputs
- Packaging-line automation roadmaps for nearshoring and export manufacturers that connect machinery spend to pallet quality, labeling accuracy, customs data, and fulfillment flow
- Perishable inventory workflows that connect shelf-life age, lot status, reefer performance, replenishment timing, recall scope, and waste reduction
- WMS cutover command centers that connect order-release pacing, dock readiness, carrier appointments, backlog thresholds, premium-freight approvals, and customer promise risk during go-live windows
- Pallet-level asset visibility tying reusable-pool ownership, pallet IDs, wash or reuse history, damage evidence, load quality, recovery obligations, and transportation exceptions to the shipment record
- Trailer-unloading automation workflows that connect linehaul arrival, dock-door readiness, robotic unload start and completion times, equipment downtime, package exceptions, detention exposure, and induction flow
- Receipt-calendar control towers that connect SKU reductions, vendor buy plans, DC dock capacity, labor availability, inbound cube, consolidation options, and store replenishment promises before inventory cuts destabilize freight
- End-to-end 3PL event files that link order release, personalization, inventory allocation, pick, pack, transfer, tender, scan, POD, billing, and exception ownership across outsourced operations
- Last-mile promise models that connect order value, address confidence, delivery density, appointment limits, carrier fit, failure cost, and customer-penalty exposure before checkout or B2B commitment
- Border-aware omnichannel node models that connect SKU velocity, store geography, ecommerce postal-code demand, customs exposure, AutoStore or WMS capacity, return paths, carrier cutoffs, and margin thresholds before order allocation
- ERP cutover control files that map item masters, inventory status, allocation rules, order holds, carrier integrations, return paths, store/DC ownership, and rollback thresholds before a retail data migration touches fulfillment
- Food acquisition transition playbooks that preserve SKU, lot, allergen, temperature, recall, customer, carrier, warehouse, and FSMA 204 evidence through the first 90 days after a brand or network change
- Automation vendor-readiness scorecards that connect support capacity, testing systems, production space, software-release cadence, deployment references, peak-flex claims, and transportation bottlenecks before robotics scale
- Cold-storage energy accountability models that tie load ID, temperature band, appointment time, reefer status, door dwell, pre-cool behavior, facility energy rate, and exception owner to avoidable cost
- Finished-vehicle staging records that connect VIN, battery status, processing step, yard slot, accessory work, dwell clock, haulaway capacity, railcar availability, dealer priority, and damage or hold reason before units pile up
- Port-readiness playbooks for defense and project manufacturing that combine berth, channel, laydown yard, security, heavy-lift equipment, supplier sequence, permit status, and milestone owner before the first critical load moves
Visibility and connectivity
- Consolidated logistics data layers that reconcile TMS, WMS, ERP, telematics, carrier, invoice, safety, and market data before AI recommendations reach operators
- Class 8 safety-sensor evidence workflows that capture camera, braking, lane-departure, maintenance, and driver-behavior signals for procurement and claims decisions
- API-first TMS integration with carriers, ERP, WMS, and telematics
- Independent execution-data layers that preserve shipper control as SMB shipping, 3PL, parcel, LTL, truckload, and international platforms consolidate
- Cellular smart labels and sub-dollar sensing at shipment or pallet level
- Rail and ocean visibility through AIS satellite feeds and exception alerts
- Common-carrier data normalization across EDI and API inputs
- Real-time edge capture for receiving, picking, and shipping decisions
- Multimodal visibility platforms replacing siloed track-and-trace tools
- Benchmarking platforms for rates, service quality, and lane performance
- Predictive ETA intelligence six times more accurate than carrier-provided ETAs
- Unified multimodal platforms collapsing the siloed visibility era
- Open-network benchmarking across Amazon, UPS, USPS-injected economy parcel, 3PL, and owned fulfillment capacity
- Integration-debt mapping across TMS, WMS, ERP, carrier portals, telematics, audit systems, and analytics layers
- Item-level IoT sensing that feeds cold-chain escalation, claims evidence, replenishment decisions, and return disposition workflows
- Live cold-chain mapping that combines storage nodes, reefer partners, dwell risk, inspection steps, temperature alerts, and recovery-owner playbooks
- Rail telecom resilience triggers that combine stale carrier updates, dispatch outages, terminal dwell, appointment risk, customer commitments, and mode-conversion economics
- Segment-specific 3PL scorecards that separate DTM, ITM, dedicated carriage, and value-added warehousing performance by lane depth, customs quality, fleet control, inventory accuracy, and exception response
- Independent 3PL governance layers that preserve shipment events, inventory status, appointment records, accessorial history, PODs, and exception notes across outsourced partners
- Multi-carrier parcel control layers that compare UPS, FedEx, USPS, Amazon, regional, and super-regional carriers by landed cost, surcharge exposure, zone, promise, and exception performance
- Part-level supplier visibility for EV and high-complexity manufacturing launches, including component shortage signals, quality holds, and constrained-part allocation
- Cross-border parcel event models that separate consumer tracking text from operational customs status, duties, broker evidence, and final-mile handoff readiness
- Procurement logistics signals embedded inside source-to-pay workflows, connecting supplier onboarding, delays, shipment records, invoice exceptions, and carrier events
- Yard gate machine-vision events that verify arrival, identity, seal condition, detention starts, trailer location, and security exceptions before dock work begins
- Remote-network visibility for air, port, barge, road, fuel, and community-service dependencies in Alaska-style constrained logistics environments
- RoRo and finished-vehicle logistics visibility linking berth appointments, yard inventory, rail capacity, vessel drafts, and inland handoffs
- Supplier inbound-readiness data linking purchase orders, ASNs, appointment slots, carrier identity, receiving exceptions, and compliance status before retail inbound simplification creates chargebacks or delays
- Final-mile handoff visibility connecting sortation hubs, postal induction, ZIP-code coverage, delivery-point density, scan events, and customer-service commitments across parcel partners
- Tariff-date ocean booking calendars that connect departure, arrival, effective duty date, HTS exposure, rate validity, inventory intent, broker readiness, and booking rationale in one reviewable file
- Intermodal mode-shift triggers that use IVI readings, truckload rate pressure, fuel exposure, drayage density, rail cutoffs, customer service windows, and dwell risk to choose rail before panic tendering
- Port drayage roadway intelligence that treats connectors, rail crossings, gate access, appointment buffers, safety changes, and inland route assumptions as shared execution data
- Project-cargo milestone visibility for renewable energy and AI infrastructure, tying permits, escorts, cranes, origin proof, safe-harbor dates, site readiness, and commissioning windows to each shipment
- Rail service scorecards combining OETA, ISP, carrier-reported metrics, shipment milestones, facility dwell, and financial consequences into procurement-ready performance evidence
- Product-level social traceability connecting supplier tiers, facilities, labor-risk evidence, lots, purchase orders, shipment records, and customs holds
- USMCA and Taiwan tariff proof trails that attach origin certificates, HTS classifications, broker instructions, derivative-tariff evidence, and refund status to shipment workflows
- Air-capacity risk monitors that map fleet advisories, aircraft type exposure, belly-cargo dependence, alternate gateways, shipment criticality, and premium-uplift decisions by lane
- Multi-carrier delivery visibility that normalizes cutoff times, tracking quality, address rules, residential surcharges, claims, exceptions, and service promises across national, postal, regional, and same-day partners
- First-mile consolidation scorecards linking purchase order, case count, SKU mix, pallet ID, appointment, provider, consolidation destination, rate-card assumptions, exception status, and downstream allocation risk
- Detention evidence layers that reconcile geofence arrival, gate check-in, dock assignment, unload start, release time, threshold rules, accessorial approval, and root-cause owner
- Real-estate network triggers that connect warehouse rent, vacancy, lease timing, drayage distance, parcel zones, labor risk, service variance, and transportation cost per order
- Parcel dimensional-data controls that reconcile item master cube, carton choice, pack-station measurement, manifest dimensions, carrier corrections, and invoice disputes before USPS, FedEx, or UPS pricing changes leak margin
- Terminal-level gateway optionality models that connect port capacity changes, terminal pauses, drayage appointments, chassis availability, rail timing, empty-container flow, and customer commitments
- Trade-deficit freight signal dashboards that translate import/export imbalance, capital-goods flows, inventories, and manufacturing readings into lane reviews, warehouse labor assumptions, and contract-timing decisions
- Insurance-linked telematics profiles that connect ELD provider, safety score, inspection history, insurer requirements, renewal timing, and carrier qualification status before a routing guide depends on the fleet
- Reefer fuel evidence records that separate propulsion fuel, refrigeration fuel, tax status, shipment temperature requirements, equipment assignment, invoice detail, and recovery ownership
- Container data-exchange normalization that maps booking status, container events, document milestones, emissions records, DCSA data contracts, and cross-party exception ownership into one ocean timeline
- Order-cycle-time timestamp models that split order receipt, allocation, pick start, shipment-ready, tender, pickup, transit milestones, delivery, POD, exception reason, and customer-notification time into accountable handoffs
- Rail-risk files that connect lane volume, interchange exposure, terminal handoffs, route miles, port options, intermodal ramps, drayage distance, environmental assumptions, and fallback modes before rail consolidation changes service design
- Semiconductor ramp input records that connect approved materials, specialty gases, calibration parts, cleanroom supplies, packaging, inspection status, import controls, site readiness, and high-value freight milestones
- Singapore hub optionality models that combine origin lane, feeder dependency, customs document status, inventory days of supply, alternate hub eligibility, premium recovery cost, and customer priority before transshipment congestion forces a decision
- Postal middle-mile scenario files that track USPS/UPS dependency, air-vs-ground assumptions, induction cutoffs, service product, regional entry point, fallback node, late-delivery threshold, and refund exposure
- AI server rack freight records that classify compute, power, cooling, networking, security, installation, and commissioning dependencies alongside custody rules, shock/tilt controls, site readiness, and expedite authority
- Ocean bid-window controls that connect carrier contract validity, committed volume bands, fuel surcharge exposure, chokepoint risk, spot-market fallback, customer priority, and finance approval before annual contracts lose relevance
- Retail supplier-change transportation models that compare old and new supplier lanes by landed cost, lead time, customs data, border reliability, capacity depth, inventory buffer, service promise, and reversal cost before sourcing changes are awarded
- Project-cargo milestone control files that connect purchase order, site phase, permit, escort, crane, route survey, port slot, laydown yard, site access, delay owner, and critical-path impact into one visible execution record
Compliance and risk infrastructure
- Carrier qualification workflows that preserve safety evidence, insurance status, subcontracting restrictions, hours-of-service risk, and selection rationale for later audit
- Fleet emissions compliance evidence tied to equipment type, onboard diagnostics status, inspection history, maintenance signals, state exposure, contract requirements, sustainability claims, and tender eligibility
- Third-party cyber continuity records that map vendor criticality, connected systems, data types, fallback processes, recovery SLAs, affected customers, and manual release authority for logistics providers, brokers, labels, EDI, and customs workflows
- 4PL governance files that define scope boundaries, mode ownership, data access, escalation rights, KPI definitions, savings baselines, exception accountability, and shipper-owned execution history
- Construction material risk registers that tie supplier geography, critical-path date, freight mode, permits, site constraints, substitution rules, delay cost, and escalation owner to project milestones
- Manufacturing freight-readiness scorecards that combine production release reliability, ship-window adherence, dock staffing, item verification, packaging status, documentation status, carrier cutoff, customer promise, and expedite trigger
- Tariff-refund landed-cost files that connect entry numbers, refund status, duties paid, freight charges, accessorials, currency assumptions, SKU margin, customer pass-through status, and finance/logistics owners
- Supplier evidence readiness checks that link supplier approval, audit status, origin proof, traceability, labeling approval, AI compliance flags, release timestamp, exception owner, order, shipment, facility, and lane
- Shipment-release evidence files that tie supplier and factory records, HTS classification rationale, country-of-origin basis, valuation support, entry number, broker status, exception owner, and customer-impact threshold to release readiness
- Project logistics priority files that connect project ID, site phase, material class, critical-path milestone, long-lead status, heavy-haul or permit constraint, staging requirement, and premium-freight decision owner
- Maritime fee and war-risk cost-code controls that separate base freight, energy exposure, security charges, delay premiums, and carrier-imposed surcharges
- Logistics technology vendor-risk reviews that connect layoffs, product-roadmap stability, support capacity, integration ownership, and operational dependency before renewal
- Battery and dangerous goods workflow automation for air cargo
- Customs and trade documentation management with AI classification
- Duty-refund recovery workflows that assign shipment eligibility, carrier refund status, data-sharing permission, broker review, account ownership, landed-cost variance, and finance reconciliation
- Apparel environmental-tax and circularity workflows that move material composition, packaging, repairability, resale eligibility, disposal restrictions, and destination rules with the shipment record
- EAPA anti-circumvention investigations and transshipment documentation
- FTZ, bonded warehouse, and First Sale workflows for tariff mitigation
- Country-of-origin documentation with manufacturing record integrity
- Carrier contract monitoring after mergers, spin-offs, and rate resets
- Corridor-level risk scoring as trade shifts lane by lane
- IEEPA criminal exposure awareness in tariff evasion scenarios
- Digital audit trails for changing ESG and trade compliance requirements
- Disaster-readiness planning and escalation mapping for critical freight
- ISPM 15 pallet-stamp validation, country-of-origin evidence, and USMCA rules-of-origin document workflows embedded before tender
- Fleet safety scorecards, maintenance-risk signals, and vehicle out-of-service exposure built into carrier qualification
- Return disposition evidence, fraud signals, ESG routing, donation/recycle paths, and customer refund SLAs captured in one reverse-logistics record
- Disaster-response playbooks with pre-tiered capacity partners, critical-SKU lists, alternate staging nodes, and response-time escalation rules
- ELD, Roadcheck, safety, insurance, and financial-health signals embedded into carrier qualification and routing-guide escalation
- Automotive tariff workflows linking HS classification, origin evidence, landed-cost simulations, broker milestones, and shipment release approvals
- Vendor-distress monitoring that combines WARN notices, bankruptcy filings, tender acceptance drift, dwell, claims, invoice disputes, communication gaps, and facility concentration into early-warning scorecards
- Vertical LTL service design scorecards that separate healthcare, grocery, technology, high-value, appointment-sensitive, and temperature-sensitive freight by accessorials, claims, POD quality, and exception recovery
- Storage-risk controls that connect inventory positioning, warehouse appointments, yard dwell, detention exposure, and transportation replanning
- Alternative-fuel portfolio governance by lane, duty cycle, charging/fueling infrastructure, customer carbon requirements, and maintenance profile
- Public-sector logistics audit trails linking procurement rules, asset custody, emissions documentation, route performance, and exception approvals
- Parcel contingency controls for USPS/FedEx/UPS/regional-carrier exposure, dimensional-data compliance, postal-injection risk, and surcharge escalation
- Dynamic carrier and driver verification across authority checks, dispatch changes, pickup validation, route geofencing, first-stop monitoring, broker-liability exposure, and document anomalies
- Risk-to-action workflows that convert weather, tariff, cyber, geopolitical, supplier, or port alerts into shipment-ranked decisions and logged customer updates
- Parcel contingency playbooks for carrier network redesign, station closures, sub-pound pricing changes, postal performance gaps, and peak-season service promises
- Product-data traceability workflows for EPR reporting, packaging attributes, material composition, stewardship fees, and audit evidence
- EU LCV compliance planning for international van lanes, tachograph readiness, driver-hour limits, urban access rules, and courier procurement
- Maritime disruption evidence packs connecting liability events, alternate gateways, customer commitments, claims, and single-gateway exposure
- Dynamic fleet-leadership risk indicators using maintenance backlog, inspection delays, work-order age, road calls, downtime, and compliance filing status
- Tariff-refund recovery workflows that preserve entry history, origin evidence, broker communications, duty payments, route changes, and finance approvals as one auditable recovery file
- Warehouse pedestrian-safety data layers that combine telematics, proximity detection, AI cameras, incident logs, aisle design, and task sequencing before safety becomes a training-only problem
- Marketplace import-compliance workflows tying seller identity, SKU-level product-safety evidence, customs records, inspection holds, and reverse-logistics disposition into one auditable control loop
- Freight-spend control workflows linking accruals, carrier contracts, invoice exceptions, purchase transportation costs, and finance approvals before restatements or margin leakage surface later
- Critical-goods stockpile governance connecting supplier maps, buffer locations, replenishment cadence, expiry risk, and contingency routing to active transportation execution
- Tariff-refund documentation workflows linking entry history, origin proof, broker files, duty payments, shipment records, and finance approvals into cash-recovery evidence
- Evidence-based logistics vendor vetting that tiers vendors by operational access, validates SOC and penetration-test evidence, limits permissions, and tests fallback processes before integration risk hits freight continuity
- PFAS-sensitive chemical chain-of-custody workflows that connect production sites, batch IDs, controlled locations, carrier qualifications, waste streams, custody changes, sampling, treatment, and exception closure
- Roadcheck and inspection-window readiness workflows that tie carrier files, inspection history, equipment maintenance, tender timing, and critical-lane exposure to capacity plans
- Ocean recovery controls that track war-risk, emergency, fuel, congestion, and transshipment surcharges by shipment while widening booking lead times only where lane evidence justifies it
- Importer-of-record visibility gates that verify party identity, ownership disclosure, bond status, entry type, broker assignment, product description, origin record, HTS code, and document completeness before tender
- Carrier-vetting evidence files that preserve authority, insurance, safety rating status, inspection patterns, service scope, equipment fit, approval rationale, and the historical qualification state at load tender
- Retail contract optionality controls that compare contracted ocean and domestic coverage, spot leakage, import timing, cube utilization, DC placement, carrier acceptance, and service outcome before disruption forces emergency buys
- Long-lead project logistics controls that connect purchase orders, supplier milestones, inspection hold points, route surveys, heavy-haul permits, staging plans, carrier capacity, and site readiness years before project cargo moves
- Export-control escalation workflows that preserve denied-party screening, ECCN or commodity classification, destination checks, approval rationale, staff handoffs, and document retention before forwarder liability becomes personal
- Driver data-consent governance that connects biometric capture, dashcam and safety-coaching data, timekeeping, telematics, retention periods, vendor access, jurisdictional rules, and audit trails
- Paperless enforcement readiness controls that centralize driver qualification files, inspection records, authority status, insurance, ELD data, roadside documents, expiry alerts, and compliance exception queues
- Sanctions-aware marketplace fulfillment workflows that tie platform status, seller identity, restricted-party screening, product origin, route holds, customer promises, and compliance exception review to shipment release
- Fleet camera evidence rules that define capture trigger, consent basis, retention period, coaching use, claims eligibility, detention-dispute access, deletion rule, and shipment-linking policy before AI video becomes operational evidence
- Diesel allocation playbooks that rank lanes by fuel availability, reefer requirement, inventory criticality, customer penalty, carrier acceptance, surcharge exposure, and emergency fallback before a shortage becomes a service failure
- Marine fuel optionality controls that separate ethanol, LNG, conventional bunker, emissions claim, infrastructure readiness, surcharge treatment, fallback fuel, and customer allocation by ocean lane
Healthcare and pharmaceutical logistics
- Multi-temperature-band cold-chain networks (ambient, refrigerated 2–8°C, frozen) integrated with forwarding networks
- GDP-compliant cross-dock facilities embedded within 3PL forwarding networks
- Real-time temperature excursion monitoring across handoff points and transfer nodes
- GLP-1 and biopharma cold-chain handling at scale
- IATA-certified pharmaceutical handling staff and validated temperature documentation
- Chain-of-custody continuity from pickup through last-mile delivery for high-value biologics
- Critical medical SKU allocation workflows that rank patient-care risk, substitute availability, supplier constraints, and provider communications before scarcity turns into service failure
- Cold-chain handoff accountability that connects temperature range, custody event, cross-dock milestone, intervention latency, provider response, and quality-release evidence to each shipment
New Insights from May 18, 2026 Posts
Ten May 18 posts added a sharper edge-network lesson: logistics resilience is increasingly built in the places that used to look peripheral — remote airports, fuel-constrained islands, heavy-haul grid corridors, rail gateways, parcel station maps, product-data records, and port yards. The technology story was less about new dashboards and more about turning constrained infrastructure into planned, measured, and governable workflows.
Remote and energy-constrained networks became strategic infrastructure
Alaska coverage reframed remote logistics as a strategic air, port, fuel, and emergency-service network. Ted Stevens Anchorage International Airport ranked as the fourth-largest air cargo hub in the world, while more than 70% of Alaska communities depend on small aircraft or watercraft for service. Cuba's fuel shortage and Canada's plan to double power-grid capacity by 2050 made the same point from different angles: energy access, political risk, and heavy-haul infrastructure now belong inside logistics planning models.
Carrier reliability beat pure rate shopping
The asset-based carrier story put hard numbers behind procurement's shift. Transportation capacity fell 10.9% to 28.4 while transportation prices reached 95.0, creating a record 66.6-point spread in the Logistics Managers' Index. Tender rejections above 14% in parts of the year reinforced the point. In a tightening market, the cheapest routing guide can become the most expensive one if it cannot protect pickup reliability, appointment integrity, and recovery capacity.
Nearshoring needed execution-grade intermodal links
The CPKC-CSX Southeast Mexico Express coverage showed nearshoring moving from strategy to lane execution. Mexico-U.S. growth only pays off when rail schedules, customs handoffs, drayage capacity, appointment windows, and origin documentation work as one corridor. USMCA uncertainty makes that discipline even more important: the winning network is not just closer, it is measurable.
Retail resilience became a transit-time design problem
Dollar Tree's 1 million-square-foot Arizona distribution center showed retail resilience becoming more precise. The building matters, but the real value is reducing miles to stores, improving replenishment cadence, and protecting service promises as retail demand holds up. April retail trade sales rose 5.2% annually, non-store retailers rose 11.1%, and general merchandise rose 6.19%. Regional inventory strategy is now a transportation decision.
Parcel network redesign became a shipper-side planning issue
FedEx Network 2.0 and USPS pricing/performance coverage both pointed to the same planning gap. FedEx expects to close more than 475 stations by the end of 2027, roughly 30% of its facility footprint. USPS shipping and packages revenue rose 4.5% while volume fell 1.4%, and proposed Ground Advantage sub-pound changes would create an average 11.8% price increase. Shippers need parcel systems that simulate pickup windows, carrier splits, SKU margins, package dimensions, and contingency handoffs before service changes hit customers.
Product and port data became capacity tools
EPR reporting made product data operational: material composition, packaging attributes, producer responsibility, and traceability evidence must be structured enough to support audits and fees. Seaport densification made a parallel argument for terminals. Dwell time, vessel bunching, gate hours, appointment slots, chassis availability, and drayage capacity can create usable throughput when connected early enough. The future of capacity is not always a bigger facility. Sometimes it is better data at the constraint.
New Insights from May 17, 2026 Posts
Ten May 17 posts added the year's most grounded lesson yet: logistics technology only matters when it controls physical flow, financial exposure, and risk at the operating edge. The day's coverage moved from aircraft capacity and tariff exposure to conveyors, packaging plants, yard gates, postal pricing, medical device scarcity, and regional DC design — unglamorous control points where margin and service actually break.
Air cargo pricing became a capacity-quality problem
April air cargo spot rates rose 30% year over year to $3.34/kg, while volumes rose only 2% and the global dynamic load factor climbed three points to 62%. Southeast Asia-to-North America rates rose 33% to $6.46/kg. That gap between rate movement and volume growth matters: shippers need lane-level capacity trust, forwarder buying evidence, surcharge separation, and premium-trigger rules rather than treating every airfreight increase as a generic fuel story.
Tariffs, fuel, and parcel pricing became live operating models
Bob's Discount Furniture showed the new importer playbook: model 10% global tariff exposure, 25% upholstery duties, fuel pressure across the transport chain, and SKU-level margin before choosing a supplier or lane. USPS created a parallel parcel lesson. Shipping and packages revenue rose 4.5% even as volume fell 1.4%, while Ground Advantage revenue rose 19.8% and volume rose 14.7%. Lightweight parcel shippers now need ounce-band, zone, package, promise, and margin models inside TMS workflows, not quarterly carrier autopsies.
Physical flow stayed strategic in the automation cycle
The Interroll/Royal Apollo conveyor coverage and Smurfit Westrock superplant story both pushed back against robot-only automation narratives. Warehouse automation may be growing from $34.17 billion in 2026 to $65.74 billion by 2031, but conveyors still held 55.12% of 2025 revenue. Smurfit Westrock's $136 million, 595,000-square-foot plant targets 3 billion square feet of annual corrugated output with about 60% of traditional labor. The lesson is simple: software-defined automation still needs cartons, conveyors, packaging flow, and uptime.
Yard gates and broker vetting became risk infrastructure
Outpost's 3 million annual automated gate events showed that yard entrances are becoming data-capture infrastructure, not guard-shack admin. Machine vision, arrival verification, detention clocks, seal status, trailer identity, and security evidence belong upstream of dock execution. The Supreme Court broker-liability coverage sharpened the same risk logic from another angle: carrier vetting cannot be a static onboarding file when unsafe operators, chameleon carriers, and identity manipulation create legal and operational exposure.
Regional fulfillment design got more precise
Ulta's planned 395,000-square-foot Salt Lake City DC will serve up to 180 stores, create 400+ jobs, support e-commerce, use AutoStore automation, and improve delivery speeds by up to one day. That makes regionalization a design discipline, not just a real estate move. The winning pattern is a regional node that improves replenishment cadence, delivery promise, store inventory balance, and same-day optionality at the same time.
New Insights from May 16, 2026 Posts
Nine May 16 posts made the retrospective's execution thesis sharper: logistics technology is being judged less by what it can see and more by what it can safely change. The day's coverage connected customs parcel visibility, faster control-tower decisions, procurement integration, India growth, industrial footprint strategy, import forecast volatility, risk-response workflows, freight fraud, and store-led last mile into one practical operating rule: the best logistics stack shortens the gap between signal, decision, and verified action.
Tracking events became compliance evidence
The “AliExpress import customs clearance complete” analysis showed why cross-border parcel visibility can no longer stop at consumer-friendly status text. De minimis reform, duty exposure, and forced-labor scrutiny are turning parcel milestones into compliance records. Supply Chain Dive's de minimis coverage noted the White House argument that 90% of fiscal 2024 cargo seizures originated as de minimis shipments, while Mordor Intelligence projected China's cross-border ecommerce logistics market growing from $28.28 billion in 2025 to $60.62 billion by 2031.
That combination changes the workflow. Customs clearance status needs timestamp, location, entry type, duty status, broker reference, inspection outcome, and next-mile handoff readiness. If the event is vague, marketplaces, forwarders, brokers, and customer-service teams all lose the same precious time.
Control towers were judged by decision latency
The control-tower story moved beyond visibility. Logistics Management's Gartner symposium coverage emphasized that companies are past basic track-and-trace and now need faster decisions from disconnected data. Gartner's related survey of 140 chief supply chain officers again mattered here: only 17% are pursuing immediate transformational workflow redesign, while 83% remain incremental.
That is the operating-model bottleneck. A late shipment alert has limited value unless the system can rank customer impact, identify inventory consequences, recommend a retender or appointment change, assign ownership, notify stakeholders, and measure outcome cycle time.
Procurement became part of logistics execution
FedEx Dataworks' integration with ServiceNow source-to-pay workflows added a useful signal: procurement data and logistics data are converging at the decision point. Shipment delays, supplier onboarding status, carrier events, and invoice exceptions increasingly belong in the same operating view.
The practical lesson is that supplier performance is transportation performance. A low-cost supplier that repeatedly creates expedited freight, detention, missed appointments, and invoice disputes is not really low cost. Procurement, transportation, and finance need shared evidence before the exception becomes month-end archaeology.
India moved from watch-list market to network-design priority
Mordor Intelligence projected India's freight and logistics market at $383.77 billion in 2026, reaching $592.36 billion by 2031 at 9.07% CAGR. Courier, express, and parcel growth is projected at 9.92% CAGR, international CEP at 10.73%, and warehousing from $27.29 billion to $40.99 billion by 2031.
But the operating reality is fragmented: more than 75% of India's 3.5 million trucks are run by single-vehicle owners, the commercial-driver gap is 22%, and long-haul attrition is 38%. Global forwarders need configurable lane workflows, mixed partner connectivity, documentation discipline, and local exception handling rather than a generic global template.
Warehouse leases became transportation decisions
JLL's Q1 industrial data reframed real estate as network strategy. U.S. industrial leasing rose 17.8% year over year to 145 million square feet, with 71.6% new leases. Big-box leasing rose 80.7%, and 3PL leasing activity rose 65.2% to more than 30 million square feet.
That is not just a rent story. Every new node changes port drayage, parcel zones, linehaul, labor, yard flow, inventory buffers, emissions, and customer promise logic. The smartest footprint model connects lease economics to transportation execution before a building is selected.
Import softness still created planning risk
The latest NRF/Hackett Global Port Tracker signal was subtle but important. March covered-port imports reached 2.16 million TEU, down 13.6% from February and 0.6% from March 2025. First-half 2026 volume is projected at 12.59 million TEU, up only 0.5% year over year, while monthly forecasts swing between short-term gains and later declines.
Lower volume does not automatically mean easier planning. Carriers can blank sailings, compress arrivals, reposition equipment, and reshape rotations. Add tariff uncertainty and forced-labor documentation pressure, and import teams need scenario workflows that connect purchase orders, bookings, port capacity, inland execution, and customer allocation rules.
Risk management moved from alerts to action
Logistics Management's risk-management coverage, citing Marsh, put the cost of global supply chain disruptions at roughly $184 billion annually, with 65% of companies facing at least one bottleneck at any given time. Gartner added the AI scaling problem: 56% of chief supply chain officers cite legacy/process integration as a major challenge, and 50% cite limited internal expertise.
The message is simple: risk intelligence is not enough. A port, cyber, weather, tariff, or supplier alert has to become an operating response: affected shipments, ranked exposure, alternate lanes, carrier options, customer notifications, document trails, and measured cycle time.
Freight fraud moved inside legitimate networks
The Trojan Driver scam made carrier verification a live operating control. FreightWaves, citing TAPA and CargoNet, reported 3,594 cargo theft incidents last year, an estimated $725 million in losses, and 1,839 strategic-theft incidents in 2025. The nasty part is that the scam can use real carriers and real drivers who pass static checks before diverting a high-value load.
That means the authority is not the operator. High-value freight needs dynamic validation: driver identity, tractor and trailer, dispatch changes, pickup geofencing, unusual first stops, document anomalies, and escalation rules when behavior no longer matches the plan.
Stores became hour-level speed nodes
Walmart and Sam's Club made local inventory a transportation asset. Sam's Club launched one-hour delivery from 600-plus locations, with nearly 65,000 early deliveries, average express delivery in 55 minutes, and the fastest deliveries under 12 minutes. Walmart's broader ecommerce sales exceeded $150 billion, store-fulfilled delivery grew 50%+, and 35% of Q4 U.S. store-fulfilled orders arrived in under three hours.
That moves stores from pickup points to speed infrastructure. The winning last-mile model needs inventory accuracy, labor readiness, dispatch intelligence, service-level segmentation, substitutions, staging control, and automated exceptions before a one-hour promise is accepted.
New Insights from May 15, 2026 Posts
Nine May 15 posts reinforced the year's central lesson: logistics technology is only valuable when it changes the operating rhythm. The new coverage connected Gartner's AI caution, Penske's AI-enabled visibility layer, parcel carrier pricing power, USPS contingency risk, public-sector and retail market growth, manufacturing cost volatility, EV supplier fragility, and self-funding transformation economics into one practical message: the winning logistics stack is governed, measurable, and close to the work.
AI timelines split into quick wins and operating-model transformation
Gartner's May symposium coverage gave the retrospective a useful guardrail. AI use cases are real in warehouse slotting, transportation planning, supplier performance, inventory positioning, and data-quality orchestration. But Modern Materials Handling's Gartner survey of 140 senior supply chain leaders found only 17% are pursuing immediate transformational redesign of workflows and processes. The other 83% are applying AI incrementally or scaling it gradually into integrated processes.
That is not a failure. It is the practical deployment curve. The 90-to-180-day roadmap belongs to repeatable decisions like slotting, audit triage, exception prioritization, carrier-risk scoring, and rate validation. Broader autonomy needs semantic-layer ownership, clean master data, role redesign, and governance rules that survive real freight exceptions.
Visibility became an AI execution layer
Penske's Supply Chain Insight platform sharpened the visibility trend. The platform includes 85-plus prebuilt and customizable metrics and AI-powered natural-language queries across loads, orders, and performance data. That matters because the visibility category is moving beyond dashboards. A system that only displays 200 KPIs still fails if it does not route the right exception to the right owner with enough context to act.
The better architecture links freight, warehousing, inventory, and partner data in one execution layer. Inbound Logistics' framing of AI as a supply chain “system of action” fits the moment: visibility is becoming valuable when it can recommend, prioritize, automate, or escalate the next step.
Parcel moved from volume leverage to value discipline
Parcel carriers are rewriting the contract playbook. Logistics Management's 2026 parcel roundtable reported that UPS, FedEx, and USPS handled 85% of domestic parcel volume before the pandemic, but their share fell to 61% of 23.9 billion annual deliveries by 2025. At the same time, UPS and FedEx implemented 5.9% GRIs that often translate into 8-9% effective increases once surcharges and shipment profiles are included.
That turns parcel from an annual procurement event into a continuous optimization problem. The useful playbook combines carrier diversification, surcharge analytics, address and dimensional validation, regional-carrier testing, service-level monitoring, and contract language that reflects actual shipment profiles instead of generic volume tiers.
USPS risk made contingency planning unavoidable
USPS financial pressure made economy parcel planning more fragile. Reuters reported a $2 billion quarterly net loss, a warning that cash could run out as soon as February, mail volume down 6.3%, operating revenue up 2.3% to $20.2 billion, and cumulative net losses of $120 billion since 2007. More directly for shippers, USPS won approval for a temporary 8% priority mail and package surcharge through January 17, 2027, and dimensional reporting rules are expanding July 12 with a $3 noncompliance fee.
The lesson is not to abandon postal services. It is to model postal dependency explicitly. Parcel teams need fallback carriers, dimensional-data controls, induction-point visibility, and service-risk triggers before a surcharge or network change turns low-cost shipping into margin leakage.
Public-sector and retail logistics exposed value-added growth pools
Mordor Intelligence put numbers around two underappreciated markets. Government and education logistics is projected at $568.60 billion in 2026, growing to $802.60 billion by 2031 at 7.14% CAGR. Transportation held 49.66% share in 2025, but value-added services are projected to grow 10.57% annually. Public buyers increasingly need resilient routing, asset custody, emissions reporting, audit-ready approvals, and compliance evidence.
Retail logistics is even larger: $1.22 trillion in 2026, projected to reach $1.57 trillion by 2031 at 5.25% CAGR. Transportation held 62.1% share in 2025, but value-added services are growing 6.5% annually and online channels 8.9%. That confirms a broader theme: margin is shifting from moving goods to orchestrating returns, kitting, packaging, channel promises, carbon data, and exception handling.
Supplier and input-cost volatility became transportation planning inputs
Lucid's supplier issue showed why visibility has to move below the shipment level. Reuters reported Lucid produced 5,500 vehicles in the quarter but delivered only 3,093 after a supplier-related Gravity SUV issue disrupted flow and helped force suspension of full-year guidance for 25,000 to 27,000 vehicles. Finished-vehicle tracking cannot solve a constrained-part problem. EV and high-complexity launches need part-level visibility, supplier quality signals, constrained-component allocation, and logistics escalation tied to production reality.
Manufacturing cost data pointed the same way. ISM manufacturing PMI held at 52.7 in April, supplier deliveries slowed to 60.6, crude prices had climbed more than 50% since February 28, and ISM comments mentioned war in 47% of responses and tariffs in 18%. Transportation teams cannot wait for procurement inflation to show up as invoices. Supplier-delay, fuel, and input-cost signals need to flow into reforecasting, carrier planning, and mode strategy while there is still time to act.
AI transformation started paying for itself
The self-funding supply chain idea gave AI budgeting a cleaner operating model. Logistics Management cited Accenture research showing average supply chain digital maturity at only 36%, with autonomous process maturity at 21%. Disruptions cost organizations an average of 3.9% of revenue, while intelligent end-to-end planning can reduce that to 1% or lower. Augmented and autonomous sourcing can lift savings 1-2% and productivity 40-60%, depending on deal complexity.
That frames transformation less as a one-time capital request and more as a reinvestment loop. Start with measurable waste — freight audit leakage, accessorial overcharges, poor slotting, excess inventory, tender failures, manual claims, supplier delays — then recycle verified savings into the next layer of automation. The point is not to make AI cheap. It is to make AI accountable.
New Insights from May 13, 2026 Posts
Six May 13 posts added a useful correction to the year's technology story: autonomy is becoming real, but only where operators have earned the right to automate. Agentic AI, cobots, modular warehouse tools, air-cargo mode switching, storage planning, and sustainable-fleet portfolios all pointed to the same operating rule. The technology can move faster than the organization, but the workflow cannot.
Agentic AI needs customs discipline before autonomy
Deloitte's agentic supply chain warning sharpened the year's AI theme. An agent can recommend supplier shifts, rebook freight, prepare customs documents, or escalate exceptions only if the underlying classification, origin, broker, and audit-trail data are clean enough to survive scrutiny. Gartner's autonomous-ready framing — operations, intelligence, and workforce — reinforces the same point: logistics autonomy is not a software toggle. It is a governance architecture.
For global shippers, the practical takeaway is blunt. AI agents should not touch customs workflows unless every recommendation, source, override, broker handoff, and filing output is logged. Speed is useful. Explainability is mandatory.
Air cargo planning shifted from demand to capacity trust
March air cargo data looked soft at first glance: global cargo tonne-kilometers fell 4.8% year over year, international demand dropped 5.5%, and available capacity slipped 4.7%. But the operational issue was not weak demand alone. It was whether premium air capacity can still be trusted when fuel volatility, Gulf hub exposure, schedule cuts, and routing disruption hit together.
That makes air cargo less of a generic premium mode and more of a lane-specific contingency product. The better playbook is backup gateways, clear premium-trigger rules, service-level monitoring, and fuel-aware exception planning.
Warehouse capacity became the other tightening signal
April's LMI made the storage risk hard to ignore. The overall index reached 69.9, aggregate logistics costs hit 242.4, inventory levels rose to 56.3, inventory costs held at 74.7, warehouse utilization reached 64.4, capacity contracted at 45.5, and warehouse prices climbed to 72.7. That is not just a warehousing story. It is a transportation story, an inventory story, and a detention story.
The insight is that sloppy inventory positioning now creates freight cost. If goods land in the wrong node, trailers become buffer space, appointments slip, accessorials grow, and transportation plans lose flexibility.
Practical automation beat vague automation
North American robot orders were nearly flat in Q1 2026 — 9,055 units worth $543 million, down 0.1% in units and 6.4% in revenue — but cobots surged. Collaborative robot orders rose 55.6% to 1,637 units, and cobot revenue rose 78.2% to $69.8 million. Automotive weakness masked strength in life sciences, electronics, plastics, and food/consumer goods.
That rotation matters. The automation market is not rejecting robotics. It is rejecting vague robotics. Buyers are favoring safer, smaller, workflow-specific deployments where the payback is tied to measurable bottlenecks.
Modular fulfillment raised the integration bar
FlexBins, pallet shuttles, inventory drones, item-level sensors, and modular ecommerce tools all solve pieces of the same problem: SKU variety is too volatile for rigid warehouse designs. But modular capacity only works if WMS, OMS, inventory availability, carrier cutoff logic, and TMS execution move together.
The next competitive gap is not whether a warehouse can pick faster. It is whether the transportation layer can absorb the new fulfillment signal quickly enough to protect the customer promise.
Sustainable fleets became portfolio problems
The sustainable-fleets coverage showed decarbonization moving away from one-fuel ideology. Renewable natural gas accounted for 97% of natural gas transportation fuel in California, medium- and heavy-duty BEV registrations rose 21% in 2025, and 48% of fleet managers now use AI for routing, dispatching, diagnostics, or preventive maintenance. Fleets expect 35% of their vehicles to be AI-enabled by 2027, up from about 20% today.
That means the winning strategy is not choosing one drivetrain and waiting for the world to conform. It is matching BEV, RNG, renewable diesel, propane, hydrogen, maintenance intelligence, route planning, and customer requirements lane by lane.
New Insights from May 11, 2026 Posts
Ten May 11 posts added a blunt operating-model lesson to the retrospective: logistics technology is scaling faster than organizations, carrier networks, and compliance processes can absorb it. The strongest new insight was not “more AI.” It was that AI, robotics, item-level sensing, and control-tower services only create value when paired with talent pipelines, governance, clean classification data, compliant carrier capacity, and lane-level execution discipline.
AI adoption is high, but operating-model change is still shallow
Gartner's May research created the cleanest warning signal of the batch. Only 17% of supply chain organizations are pursuing immediate transformational redesign of processes and workflows, while 83% are applying AI incrementally or scaling it into existing processes. That does not make AI unimportant. It means most logistics teams are still bolting AI onto legacy decision rights, legacy master data, and legacy exception workflows.
The talent story makes that risk expensive. Gartner also warned that 75% of supply chain organizations pausing entry-level hiring in 2026 could pay premiums above 15% for early-career professionals by 2030. Logistics still needs people who understand claims, appointments, routing guides, product classifications, and dock exceptions. If companies hollow out the junior bench while waiting for AI to “replace” work, they may end up paying more for scarcer operators later.
Human-governed AI became the practical planning model
The AWG/RELEX coverage sharpened the point. RELEX survey data showed 67% of leaders had more confidence in AI supply chain decision-making than a year earlier, with 47% using or planning AI-driven inventory optimization and 41% applying AI to logistics and routing. But only 10% would trust AI to make fully independent supply chain decisions, while 54% prefer AI recommendations with humans making final calls.
That is the model most likely to work in freight and fulfillment: AI recommends, explains, ranks tradeoffs, and triggers bounded workflows; humans approve high-risk decisions where service, compliance, or customer commitments are exposed. In other words, autonomy is arriving through governed exceptions, not magic autopilot.
Compliance data became capacity data
The ELD and Roadcheck post showed why compliance can no longer sit outside transportation planning. In 2025, Roadcheck produced 56,178 inspections, 13,553 vehicle out-of-service violations, and 3,317 driver out-of-service violations, equal to an 18.1% vehicle out-of-service rate and 5.9% driver out-of-service rate. FreightWaves' market coverage put rejection rates around 12.7%, with tender volumes 11-13% higher year over year and Roadcheck potentially pushing truckload rejection rates into the 16-17% range for a week.
That makes carrier compliance status a live capacity variable. Revoked ELDs, Roadcheck exposure, inspection history, insurance status, and safety posture belong inside carrier qualification and routing-guide logic, not in a PDF reviewed once a year.
Carrier financial health moved into routing-guide governance
Small trucking bankruptcies added a different kind of capacity warning. Recent filings included carriers with 52 tractors and 52 drivers carrying liabilities up to $10 million, another with 27 trucks and 25 drivers and more than 2.6 million miles in 2024, and micro-carriers with only one to eight units. In a tightening market, fragile carriers can fail quietly before a shipper's lane plan catches up.
The practical implication is simple: carrier scorecards need financial-health signals alongside on-time pickup, claims, tender acceptance, safety, and insurance data. The cheapest carrier is not cheap if it disappears during peak week or pushes freight into emergency secondary capacity.
Tariffs turned automotive freight into a data-classification workflow
The proposed 25% EU cars and trucks tariff reinforced a recurring 2026 lesson: trade policy becomes logistics cost through master data. A move from a 15% cap to a 25% duty can change routing, release timing, mode choice, production support, and landed-cost approvals. The USTR's separate review of two 25% Section 301 levies covering $32 billion of goods across 500-plus tariff subheadings showed that tariff programs are now durable operating inputs.
For logistics teams, this means vehicle and component flows need classification confidence, origin evidence, broker milestones, duty simulations, and exception approvals before freight moves. Tariff management is no longer post-entry finance cleanup; it is pre-tender operational control.
Warehouse capex stayed hot, but sequencing became the hard part
Material-handling equipment demand hit a record signal in March. New business volume reached $10.8 billion, Q1 was the highest on record, volume was 18.6% higher year to date, and March was 12.5% above the prior year. At the same time, robotics adoption data showed 52% of surveyed operations already running robots and another 32% planning to within three years.
That combination says the market is still spending, but not every automation purchase deserves the same priority. The best capex sequencing starts with bottlenecks: travel-heavy picking, high-friction depalletizing, poor slotting, labor-intensive receiving, unsafe manual handling, and workflows where integration into WMS/TMS logic is already clear.
Visibility moved closer to the item
Wiliot's Gen3 IoT Pixel highlighted a smaller but important shift: visibility is moving below the pallet and shipment level toward item-level condition signals — location, temperature, humidity, movement, and handling state. That matters because many execution failures are not visible at the trailer level. Spoilage, mishandling, product aging, exception-prone SKUs, and return disposition often require data closer to the product.
The useful version of item-level visibility is not another passive sensor feed. It is condition data that changes replenishment, claims, cold-chain escalation, customer notification, or inventory allocation while there is still time to act.
New Insights from May 10, 2026 Posts
Ten May 10 posts added a practical layer to the year’s technology story: the hardest logistics problems are increasingly about trustworthy operational data at the point of action. Cash logistics needs smart-safe telemetry, not just armored routes. Warehouses need clean product codes before robotics can scale. Parcel teams need USPS and UPS network awareness before selecting economy services. Food logistics needs border control points and value-added cold-chain workflows. Reverse logistics needs fraud, ESG, and refund-speed controls in the same record.
Rate pressure returned before freight volume fully recovered
The April Cass update sharpened the budget story. Shipments were still down 4.5% year over year while improving 3.0% month over month, but expenditures rose 4.2% year over year and implied rates rose 4.9% year over year. TD Cowen/AFS signals pointed the same way, with truckload, parcel, and LTL pressure all elevated. The lesson for shippers is blunt: waiting for a clean demand rebound before locking capacity is risky. Cost pressure is already being driven by supply constraints, fuel, and carrier discipline.
Parcel planning became network-aware
USPS adding 14 sorting and delivery centers through July matters because it changes induction logic, zone assumptions, and service-risk profiles. Combined with UPS Ground Saver’s postal handoff scale-up, parcel planning is becoming a portfolio exercise across carrier-owned networks, USPS injection, regional carriers, and fulfillment-node placement. A TMS that treats parcel as a simple rate-shop table is underpowered for this environment.
SKU identity became an automation constraint
The product-code post made a necessary point: robotics exposes dirty item masters. Warehouse robotics adoption has risen to 48%, and automated inventory systems can scan thousands of locations, but none of that helps if SKUs, GTINs, lot attributes, dimensions, units of measure, and substitution rules disagree across WMS, ERP, marketplaces, and transportation systems. SKU governance is now automation infrastructure.
Food logistics moved toward border and value-added control points
Mexico food logistics, projected from $15.75 billion to $21.08 billion by 2030, showed how nearshoring is creating demand for border warehouses that do more than store product. The UK food-logistics post showed the same pattern in mature cold-chain markets: automated warehouses are becoming value-added platforms for labeling, kitting, compliance checks, temperature control, and transport-aware billing.
Reverse logistics became ESG, fraud, and customer-speed infrastructure
Returns coverage reframed reverse logistics as a control system. With 16% of returns fraudulent, retail returns fraud estimated at $103 billion, and customers expecting fast refunds, returns processing can no longer be a back-room pile of boxes. The system needs disposition logic, refund triggers, fraud flags, resale/donation/recycle paths, and emissions-aware routing before the return hits the dock.
Resilience playbooks got more concrete
The disaster-logistics post connected humanitarian supply-chain lessons back to commercial freight. If 76% of executives expect higher disruption levels in 2026, resilience planning has to move from generic “backup carrier” lists to critical-SKU maps, tiered capacity partners, alternate staging nodes, response-time KPIs, and escalation workflows. The companies that perform best in disruption will not improvise faster; they will have fewer things left to improvise.
New Insights from May 9, 2026 Posts
Ten May 9 posts added a useful corrective to the year's technology story: logistics teams are still buying AI, robotics, visibility, and automation, but the bottleneck is increasingly governance, integration, and operating discipline. The new coverage tightened five themes — agentic planning, integration debt, practical robotics, capacity-quality risk, and sustainability as execution logic.
Agentic planning moved from dashboards toward AI teammates
Amazon Connect Decisions gave the agentic-planning trend a concrete enterprise example. Supply Chain Dive reported that the tool combines more than 25 specialized supply chain tools into AI “teammates” and draws on Amazon's experience managing 400 million-plus SKUs. The important shift is interface design: planners do not need another wall of alerts. They need systems that rank tradeoffs, explain consequences, trigger workflow steps, and preserve the human decision point where risk is high.
That framing connects directly to the AI budget-governance post. Gartner coverage showed supply chain organizations spent an average of $24 million on AI in 2025, while many projects ran over budget and may not show results for at least a year. The practical answer is not slower AI adoption. It is stricter deployment discipline: 90-day operational kill criteria, clear decision rights, and pilots tied to exception triage, appointment scheduling, detention prevention, or customer-status latency.
Integration debt became the real logistics IT bottleneck
Inbound Logistics' 2026 market research showed demand is not the problem: 65% of logistics technology providers reported sales growth of at least 10%, and 52% expanded their customer base by 10% or more. AI and optimization were each offered by 77% of providers, data management and analytics by 72%, process improvement by 62%, modeling and predictive analytics by 54%, and machine learning by 48%.
That is a crowded tool market. The risk is stack sprawl. The winning logistics teams are not the ones with the longest vendor list; they are the ones connecting TMS, WMS, ERP, carrier data, freight audit, telematics, and customer workflows without creating new manual reconciliation work. Integration debt is now a measurable operating liability.
Robotics adoption matured, but first-time buyers still need business-case discipline
The 2026 Intralogistics Robotics Study sharpened the automation story. 52% of surveyed warehouse, distribution, and manufacturing operations already run robots, another 32% plan to within three years, and 74% of deployers report hitting business goals. But the adoption gap remains real: 47% of companies planning their first robotics initiative are still in the education stage.
The e-commerce fulfillment post showed where practical automation is heading. Container-aware workstations can process up to 600 bins per hour while collapsing picking, packing, weighing, and exception handling into a tighter workflow. Mordor Intelligence projects the North America e-commerce warehouse market at $13.45 billion in 2026, rising to $16.45 billion by 2031, while free-return policies can force 15-20% of facility footage into reverse-logistics zones. The robotics business case is no longer about replacing labor in abstract. It is about reducing handoffs, protecting space, and making exception work faster.
Capacity risk became a quality, safety, and maintenance problem
The May 9 freight-market posts made one thing clear: capacity is not just a price. FreightWaves reported long-term contract rates up roughly 8% since last fall, with tighter markets forcing more lanes into secondary capacity. A routing guide that looks fine on paper can still miss budget if primary compliance breaks and loads roll to second, third, or brokered options.
Deferred maintenance adds another hidden constraint. FreightWaves' maintenance coverage cited a 21.6% vehicle out-of-service rate across 3.3 million inspections, translating to 700,000-plus vehicles removed from the road annually. Safety is moving the same way. J. J. Keller's fleet-management survey of 550 professionals showed fleets prioritizing prevention, real-time insight, and executive safety culture rather than recordkeeping alone. For shippers, carrier selection needs to account for maintenance resilience, safety maturity, and service reliability — not just the lowest linehaul rate.
Regionalization and sustainability both became execution problems
Manufacturing coverage showed regionalization is being driven by multiple pressures at once. ISM manufacturing PMI held at 52.7, supplier deliveries rose to 60.6, prices stayed hot, and survey comments cited war in 47% of responses and tariffs in 18%. Regional sourcing is not just a geopolitical hedge. It is becoming a quality, freight reliability, and inventory-control strategy.
The sustainability post made the same operating-model point. IDC expects 80% of sustainability services engagements to focus on operationalizing sustainability strategy by 2027. SupplyChainBrain noted that roughly 8% of global stock ends up wasted, packaging represents about 40% of plastic waste, and food loss contributes 8-10% of global greenhouse gas emissions. The useful sustainability systems will not just report emissions after the fact. They will help dispatchers consolidate loads, choose closer inventory, rebalance stock, switch modes, reduce waste, and still protect the customer promise.
New Insights from May 8, 2026 Posts
Ten May 8 posts added a clear new chapter to the 2026 story: logistics technology is becoming less about knowing what happened and more about changing what happens next. The new coverage sharpened six operating themes — open logistics networks, capacity whiplash, tariff-driven supply-chain restructuring, parcel portfolio design, compliance evidence, and warehouse automation moving upstream into production.
Open logistics networks became a shipper-control problem
Amazon's decision to open Supply Chain Services to all businesses pushed the 3PL market into a new phase. The scale is hard to ignore: more than 200 fulfillment centers, 80,000 trailers, 24,000 delivery vans, and 100 aircraft are now part of a network that non-marketplace shippers can evaluate. That does not make Amazon the automatic answer. It makes independent rate, service, inventory, and exception data more important because shippers now have to compare private logistics networks against traditional 3PLs, parcel carriers, and owned fulfillment capacity on a lane-by-lane basis.
UPS showed the same trend from another angle. Ground Saver's USPS handoff reached 977,000 daily parcels in Q1 and was ramping toward 1.5 million daily parcels in Q2, while UPS continued network changes including 27 additional facility closures and a $3 billion cost-reduction target. Economy parcel is no longer a simple low-cost service tier. It is a portfolio design decision across carrier assets, postal injection, promised delivery speed, claims exposure, and customer experience.
Freight capacity snapped tighter faster than budgets could adjust
April's Logistics Managers' Index turned the freight-market discussion from theoretical to immediate. Transportation capacity fell to 28.4, pricing reached 95, and the spread between the two hit 67 points. DAT and Logistics Management data reinforced the same direction: van demand and tender rejections were rising while spot rates moved back toward pressure levels. The planning lesson is blunt: annual procurement cycles are too slow for a market moving this quickly.
The cold-chain post added a useful nuance. Storage capacity is growing — global cold-chain capacity is above 460 million cubic meters, and the U.S. cold-chain logistics market is projected to rise from $97.13 billion in 2026 to $133.87 billion by 2031 — but reefer freight can still tighten ahead of produce season. Facility investment does not automatically solve transportation scarcity. Food, pharma, and grocery shippers need lane-level reefer coverage, appointment discipline, and temperature-risk escalation before peak seasonal demand arrives.
Tariffs pushed restructuring into the SMB market
The SMB tariff story may be the most important behavioral signal from the May 8 batch. Netstock and FreightWaves data showed 97% of SMBs actively using tariff mitigation strategies, with 35% diversifying suppliers and 74% using price increases. That means tariff response is no longer limited to enterprise procurement teams with customs counsel and network-design software. Smaller importers are changing suppliers, lengthening planning horizons, adjusting inventory, and creating more fragmented freight flows.
USMCA risk moved in the same direction. Chinese investment in Mexico — roughly $2.3 billion from 2017 to 2024 — is turning cross-border freight into an evidence problem. The 2026 USMCA review is not just a policy event; it is a routing and documentation event. Rules-of-origin records, manufacturing evidence, supplier lineage, and broker workflows now need to be tied to the shipment before the truck reaches the border.
Execution speed became the technology differentiator
The May 8 technology roundtable synthesis clarified the year's most important software lesson: visibility without governed action creates latency. Deloitte expects 40% of enterprise applications to integrate task-specific AI agents by the end of 2026, but Gartner's May 2026 finding that AI is not yet driving broad supply chain operating-model transformation is the warning label. The gap is not ambition. It is governance, process ownership, data readiness, and trust boundaries.
That makes execution speed the new competitive metric. The best systems will not merely show a late shipment, a bad forecast, or a capacity gap. They will recommend a reroute, reserve capacity, adjust safety stock, notify the customer, validate the accessorial implication, and preserve an audit trail. In other words: the winning logistics stack is shifting from dashboard visibility to controlled action.
Warehouse automation moved upstream into production
Warehouse automation coverage also widened. Vertical farming and production-linked automation showed that the warehouse is becoming part of the product, not just the place where finished goods wait to ship. With the warehouse automation market projected at $34.17 billion in 2026 and $65.74 billion by 2031, the strategic question is no longer whether automation belongs in fulfillment. It is whether the execution system can manage inventory from creation through storage, picking, shipping, and exception handling.
The ISPM 15 pallet-stamp story made the same point at the operational-basics level. A missing hyphen on a pallet mark can delay U.S.-bound freight. Packaging compliance, origin evidence, and shipment documentation are now part of the same execution fabric as routing and rating. Small warehouse details have become border-risk data.
New Insights from May 6, 2026 Posts
Two May 6 posts tightened the retrospective's freight-cost thesis: accessorial fee management is now a structured margin-recovery discipline, and Cass's March data confirmed Q2 procurement risk is being driven by supply-side rate pressure rather than broad demand recovery.
Accessorial fee breakdowns became a freight-spend control system
The May 6 accessorial guide pulled together the line-item problem that had been appearing across parcel, LTL, and audit coverage all year. Accessorial charges are no longer incidental fees; they are one of the largest uncontrolled variables in freight budgets when annual GRIs are running 5-9% and carrier surcharge tables keep expanding. The operational taxonomy matters: delivery area surcharges, residential misclassification, liftgate, detention, address correction, reweigh, fuel percentage layers, and duplicate invoices each require different evidence and different recovery workflows.
The error math is sharp enough to deserve board-level visibility. 15% of parcel invoices contain at least one billing error. Duplicate invoices represent 15-20% of recoverable spend, rounding errors can add 2-4% of total parcel spend annually, and systematic audit programs commonly recover 1-5% of total freight spend. AI-powered parcel audit typically lands in the 2-5% recovery range, while many shippers without charge-level validation are likely leaving 3-5% of freight budget on the table.
The real insight is not that carriers make mistakes. It is that accessorial data has become negotiation currency. A shipper that can show 90 days of misclassified residential surcharges, duplicate invoice patterns, lane-specific reweigh anomalies, and contract-rate mismatches walks into carrier negotiations with evidence instead of complaints. That turns freight audit from after-the-fact recovery into procurement intelligence.
Cass March data confirmed a supply-constrained freight rally
The May 6 Cass Freight Index analysis gave Q2 strategy a cleaner frame: shipment volume is improving sequentially, but cost pressure is rising faster than demand. March shipments were down 4.5% year over year but up 3.0% month over month, while expenditures were up 4.2% year over year. That is not a classic demand boom. It is a supply-constrained rally.
The driver availability signal made the point harder to ignore. ACT's For-Hire Driver Availability Index fell 4.8 points to 35.0 in March, below the threshold that marked the start of past rate cycles. LTL rate increases in the 5-8% range were already appearing in May. For shippers, the Q2 playbook is straightforward: lock committed capacity where service matters, treat spot savings as tactical rather than structural, validate accessorial exposure before rate increases compound, and revisit intermodal on lanes where rail can absorb long-haul pressure.
New Insights from May 2-3, 2026 Posts
Five posts published May 2-3 added dimensions that hadn't yet appeared in the retrospective's synthesis sections: a fresh market sizing for connected worker platforms, a three-layer freight audit stack framework, updated May LTL pricing data, a new multimodal visibility market figure, quantum computing trial evidence, and the RELEX annual supply chain survey — the most directly relevant AI planning survey published this year.
Connected worker platforms reached $20 billion — the frontline finally got its upgrade
The connected worker platform market — IIoT-powered wearables, voice picking, AR-guided workflows, and real-time task orchestration for warehouse and dock workers — crossed into the mainstream with a confirmed market trajectory. Valued at USD 8.62 billion in 2025, the market is projected to reach USD 20.18 billion by 2030 at 18.5% CAGR (MarketsandMarkets), with other estimates putting the 2030 figure at USD 24.81 billion. The drivers are structural: warehouse turnover above 60% annually makes training-cost-per-worker a first-order problem, private wireless and 5G made in-building connectivity viable, and industrial-grade wearables finally became durable enough for freezer environments and drop cycles.
The operational results are concrete: 25-40% reduction in task execution time, 35% reduction in error rates, and voice picking accuracy reaching 99.9%. Facilities deploying full-stack connected worker platforms are executing more picks per labor hour at higher accuracy than paper-based operations — translating directly to cost per order and on-time fulfillment rates that drive customer retention in contract logistics. DHL alone has roughly 1,500 operators using TeamViewer Frontline Pick across U.S. sites, with 15% productivity gains and training time cut from weeks to hours.
The integration insight that matters for TMS strategy: the real value isn't the device. It's the data flowing between the device and the system that plans the work. A voice-directed picking system updated dynamically by a TMS that just received a revised delivery schedule — that's an operational capability. A TMS built to serve as that intelligence layer, translating plan changes into real-time task assignments, is the infrastructure most operators are still missing.
The PwC finding that cuts through the noise: 42% of respondents rank integration with existing systems as a top-three digital adoption challenge. The devices work. Getting them to talk to WMS, TMS, and ERP without custom development is still hard. Platform selection should be evaluated on integration cleanliness, not just device features.
Three-layer freight audit stack: the framework the best operators are running
The May 3 freight audit post introduced a synthesis framework that ties together data points scattered across the year's coverage into a coherent stack. The insight: most shippers recover money from only one layer of freight billing errors. The operators pulling ahead are running three simultaneously.
Layer 1: Parcel audit catches FedEx, UPS, and DHL invoice errors — weight adjustments, address corrections, DIM miscalculations, residential surcharges on commercial deliveries, fuel surcharge overages. Shippers recovering 2-5% of parcel spend are common; high-volume e-commerce operations regularly recover 6-20%. The key metric is recovery rate (what percentage of identified errors are actually collected), not gross savings.
Layer 2: Truckload and LTL freight audit catches linehaul errors, misapplied accessorial charges, and fuel surcharge miscalculations. Accessorial overcharges alone account for roughly 40% of all freight billing errors. This layer also generates the clean, validated freight spend data needed for every downstream decision — carrier selection, mode optimization, contract negotiations.
Layer 3: Contract compliance audit — the largest and least-discussed recovery opportunity — answers whether carriers are billing at contracted rates, not just whether invoices contain arithmetic errors. In a dynamic pricing environment where carriers change rates and surcharges faster than ever, the gap between contracted rates and actual invoiced rates is widening. For large shippers with complex multi-year agreements and dozens of rate tables, this is not a manual process.
The number that changes the economics: combining TMS with freight audit consistently saves shippers an average of 8 to 12 percent over freight audit savings alone, per CTSI Global. Audit without TMS is reactive — find the error after you've been charged. TMS integration enables rate validation at the time of shipment, catching the problem before it becomes an invoice. The three-layer freight audit stack — parcel, TL/LTL, and contract compliance — run against a TMS backbone with clean rate data, is now table stakes for any logistics operation spending more than $5 million annually on transportation.
LTL pricing May 2026: the data got harder
May confirmed the pattern April had signaled. The Cass Truckload Linehaul Index showed a 1.8% year-over-year increase in March 2026 — 15 consecutive months of YoY gains. LTL followed, running 7.2% above year-ago levels in March on a producer price index basis. TRAFFIX's Q2 2026 market update characterized the environment as a new cycle phase: rising rates, tightening capacity, and sharply higher diesel costs — and recommended treating current rate levels as a new floor, not a temporary peak.
The catalyst stack hasn't changed from earlier coverage — driver shortage, EPA 2027 pre-buy constraining fleet growth, carrier rate discipline, and fuel — but the May data gave it sharper form. The spot-contract divergence is the tactical problem: shippers on annual contracts negotiated in late 2025 are meaningfully better positioned than those riding spot or month-to-month. TRAFFIX recommends securing committed rail pricing now before peak season demand pushes transactional rates higher. The modal shift signal is real: intermodal is getting a closer look on long-haul lanes where rail access exists, with economics increasingly compelling relative to truckload at current rate levels.
Multimodal visibility market hit $1.2 billion — fragmentation is now a competitive risk
The end-to-end multimodal shipment visibility market crossed $1 billion in 2025 and is now tracked at $1.2 billion in 2026, growing at 13.7% CAGR through 2036 per FutureMarketInsights. The market's growth reflects a bottom-up calculation by logistics leaders who've done the fragmentation math: operating across five to 10 platforms simultaneously — TMS, WMS, carrier portals, rail tracking, financial reconciliation — costs more in operational drag than the visibility platforms do.
The business case for consolidation rests on three operational facts: predictive ETA accuracy above 90% within a four-hour window (letting warehouse teams stage receiving rather than guess), exception management workflows that trigger at the point of disruption with suggested alternatives and pre-drafted customer notifications, and cross-modal inventory positioning decisions that depend on seeing inbound ocean containers alongside domestic truckload movements alongside air freight in one timeline. The last point is a working capital question as much as an operational one.
The market is undergoing structural convergence as platforms race to build the multimodal stack — driven by buyer demand, not vendor idealism. The practical evaluation criteria that separate real operational value from a polished slide deck: mode coverage on your actual top-20 lane/mode combinations, exception workflow automation (not just alerting), ERP/TMS integration depth, data latency SLA by mode, and a vendor who can quantify the cost of your current fragmentation state before they quote a price.
Quantum computing in supply chain: from theory to field trials with real results
The quantum computing narrative crossed into operational evidence in May. McKinsey's Quantum Technology Monitor 2026 now describes a "commercial tipping point," with travel, transport, and logistics companies actively adopting quantum approaches. Three documented trials illustrate where the technology actually stands:
DHL and IBM have been running combinatorial optimization problems for network routing — the class of problem that grows exponentially harder as you add stops, constraints, and time windows, and where classical algorithms start hitting walls at 500+ node networks. DHL's Asia Pacific Innovation Center has been explicit about the use case: quantum exploring all route combinations simultaneously where a classical computer cannot.
Volkswagen and CARRIS (Lisbon) ran a real-time quantum bus routing trial in Lisbon during rush hours — dynamically recalculating optimal routes as traffic conditions changed across the city. Waiting times on certain routes were cut by tens of minutes during peak congestion. The limitation: the trial operated a limited fleet under controlled conditions. Scaling to a national trucking network or global ocean operation is a different engineering challenge.
The realistic timeline: 3-7 years to meaningful commercial scale for operational logistics problems. The barriers are qubit count scaling and error rate reduction in the hardware, not algorithm maturity. But the strategic implication is immediate: companies should begin quantum readiness programs now — experimenting with cloud-based quantum systems (IBM Q, Amazon Braket, Azure Quantum) and building the data and integration foundations that make quantum adoption practical when it matures. Clean data architecture is the prerequisite. Quantum solvers are only as good as the data fed into them.
RELEX State of Supply Chain 2026: the most directly relevant AI planning survey of the year
RELEX Solutions' State of Supply Chain 2026 report — based on a January 2026 survey of 514 retail, manufacturing, wholesale, and supply chain leaders — gives the cleanest read on where AI planning actually sits in live operations.
The headline numbers: 67% of respondents say their confidence in using AI for supply chain decision-making has increased over the past year. Nearly half are already using or planning to use AI-driven inventory and supply optimization. But the most operationally revealing finding is the trust gap:
- 54% prefer AI to make recommendations while humans make the final call
- Only 10% would trust AI to make fully independent supply chain decisions
- 71% are planning to invest in generative and agentic AI over the next 3-5 years
- 60% are investing in predictive AI over the same horizon
- 44% cite consumer demand volatility as a top supply chain challenge over the next three years
The deployment data confirms three categories at scale: demand forecasting (54% using ML models trained on POS data, promotion calendars, and external signals like weather and macroeconomic indicators), replenishment automation (48% replacing calendar-based purchasing with dynamic reorder point calculation), and inventory optimization (43% using AI-driven category management to reduce SKUs while improving in-stock rates — Lowe's has been explicit about targeting inventory reductions as a margin play, not just an efficiency play).
The logistics operational implication: AI-driven planning upstream creates downstream obligations. When a retailer's forecasting system calls for 15% more volume at a specific DC on Tuesday, that signal needs to propagate into transportation tendering, carrier appointment scheduling, and dock capacity planning within hours. A TMS that only knows what to ship after the purchase order arrives is increasingly a liability. The operators who will win over the next three to five years are building the connective tissue between AI-driven planning systems and day-of-execution transportation management.
Healthcare cold-chain 3PL buildout is a signals story worth reading carefully
The Geodis post on its first dedicated Americas healthcare cold-chain cross-dock facility at Chicago O'Hare was easy to miss — it dropped on a Tuesday between earnings calls and tariff headlines. But it is one of the more significant data points in the 2026 3PL story.
The numbers tell the structural case: the healthcare cold-chain 3PL market is growing at 7.6% CAGR, projected to reach $4.65 billion by 2030. Cold chain already represents 27% of total warehousing investments in 2026, up from roughly 19% five years ago. And the GLP-1 drug category — semaglutide, tirzepatide, and the broader class of weight-loss and diabetes biologics — has created demand for 2–8°C refrigerated storage at volumes that would have seemed implausible a few years ago.
But the facility-level detail is more revealing than the macro numbers. Geodis built its Chicago cross-dock within its forwarding network — meaning a single operating system tracks temperature-sensitive freight from pickup through the cold-chain node to final delivery, rather than passing it off to a separate handler at each transfer point. That continuity of custody is the product, not the square footage. DHL's parallel expansion of its Brussels-Cincinnati airfreight cold-chain corridor — a 45,000 square meter pharma-only zone at BRUcargo — follows the same logic: treating cold-chain nodes as network infrastructure rather than one-off facility decisions.
The implication for shippers is concrete: the 3PLs building dedicated healthcare cold-chain networks are doing so because pharma and healthcare shippers with high-value, temperature-sensitive freight are migrating toward them. The evaluation criteria are also more demanding than for standard freight — temperature validation data, GDP compliance documentation, IATA-certified handling staff, and real-time monitoring integration are table stakes. But coverage remains geographically concentrated. Sub-Saharan Africa, rural Southeast Asia, and portions of Latin America still have structural cold-chain gaps that no amount of 3PL investment in Chicago or Brussels fully addresses.
New Insights from May 1, 2026 Posts
Electric trucks crossed $100 billion — Tesla Semi hit high-volume production
The electric truck market crossed a milestone that shouldn't require caveats anymore. According to Mordor Intelligence, the global electric truck market reached USD 19.31 billion in 2026 and is on pace for USD 72.11 billion by 2031 at 30.15% CAGR. Even the conservative GlobaNewsWire projection puts 2030 at $37.95 billion, with 2026 alone at $8.54 billion — a 45% year-over-year jump.
The production inflection point is concrete: Tesla's Semi began rolling off a high-volume production line on April 29, 2026, targeting 50,000 units per year from the Nevada facility. DHL confirmed a multi-unit order with real-world test data showing 1.72 kWh per mile on a fully loaded 390-mile route — operational intelligence, not a prototype run.
The NACFE TCO projection that changes the long-term calculus: battery electric vehicles are forecast to achieve the lowest net TCO across all modeled duty cycles by 2035, driven by a projected 45% drop in vehicle purchase prices and superior energy efficiency versus diesel. Return-to-base and drayage operations are already at TCO parity or better in many scenarios.
The practical constraint is infrastructure, not economics. Mobile energy storage solutions like Xos's Hub units — offering 210-630 kWh configurations — are bridging the charging gap for fleets that can't wait for utility upgrades. Hydrogen remains the wildcard for routes where battery weight cuts into payload or where dwell time for charging is operationally unacceptable.
For shippers, the lane-level implication is direct: routes with predictable origin-destination pairs and depot-adjacent operations have a strong near-term electrification case. Shippers using TMS platforms with integrated carrier sustainability scores can route based on EV availability by lane, simultaneously reducing costs and satisfying Scope 3 reporting mandates.
BCG's five-stage autonomous supply chain maturity model — most operators are still at level 2 or 3
BCG's framework for autonomous supply chains introduced a five-level maturity model that gives logistics operators a diagnostic tool they've been missing:
- Basic / Rule-Based — Static workflows, manual exception flagging, no AI
- Descriptive Analytics — Dashboards and reports, humans interpret data
- Predictive Analytics — AI forecasts demand, lead times, and disruptions
- Prescriptive / Agentic AI — AI recommends and takes action within defined guardrails
- Autonomous / Self-Steering — AI manages the network end-to-end with minimal human intervention
Most mid-market logistics operators sit between levels 2 and 3. The leading cohort — BCG's "companies putting agents in pilots and testing them" — are at level 5, running autonomous exception management and network rebalancing.
The two forces driving the shift: 74% of business leaders now view resilience as a growth driver (not just risk mitigation), and the logistics agentic AI market reached $8.67 billion in 2025, projected to hit $16.84 billion by 2030. The technology has moved from experimental to operational. The autonomous exception management entry point makes sense: investment is relatively low, data infrastructure is often already in place, and the operational impact is immediate.
The stakes are concrete: Oliver Wyman found 80% of U.S. and European firms claim to be highly resilient — yet disruption events continue growing in frequency and severity. The gap between perceived and actual resilience is where autonomous supply chain capability becomes a competitive differentiator.
Accessorial charge management: the $15–25 per package leak
The accessorial post that ran May 5 gave the residential surcharge problem its sharpest form yet. The anatomy of the leak:
- Residential surcharge base: $4–$7 per package
- Address misclassification premium: $3–$6 per package on packages incorrectly billed as residential
- Delivery area surcharge: $2–$4 per package for extended zone addresses
- Fuel stacking on accessorials: percentage uplift carriers increasingly integrate into pricing formulas rather than listing separately
- Address correction fees: $25.50 per occurrence (per LateShipment's 2026 rate analysis)
For a shipper running 50,000 packages per month with 35% residential content and $8.50 average base freight cost, total avoidable exposure lands at approximately $143,500/month — before base freight charges. A 40-60% effective accessorial management and address validation program generates $57,000–$86,000/month in savings. Annualized: $685,000 to over $1 million.
The audit-to-negotiation loop is the key insight: misclassification patterns over a 90-day window, total erroneous surcharges by category, and error rates by lane — these data points are contract negotiation currency. Shippers who show up to carrier meetings with data shift the leverage. Shippers who show up without it get priced on worst-case assumptions.
Seven posts published May 1 added final dimensions to the retrospective — three days after the April 30 data and one day closer to mid-year.
BCG's operating system frame is the most important AI planning narrative of 2026
The May 1 BCG post reframed the AI planning story in a way that changes how logistics leaders should think about their technology investments. The February 2026 BCG report's central finding — that organizations investing heavily in AI are often the same ones struggling to translate those investments into measurable performance gains — is uncomfortable because it challenges the industry's default assumption that better technology equals better results.
The four-pillar frame (People, Processes, Data, Governance) deserves particular attention because it is not abstract. "People" means planners who can interpret outputs and challenge model assumptions — not interchangeable system users. "Processes" means the process has to be fixed before AI automates it. "Data" means the data inconsistencies, incomplete definitions, and unclear accountability that undermine AI effectiveness are data problems, not people problems. And "Governance" means clear decision rights about who overrides the model and on what basis.
The Hackett Group data point that closes the loop: procurement workloads projected to increase 10% while budgets grow just 1% — a 9% efficiency gap that only well-implemented technology can close. The gap is not AI capability. It is the infrastructure to deploy it at scale.
The $300 billion tariff rerouting problem is now a freight forwarder compliance liability
The May 1 post on tariff arbitrage introduced a dimension that had been implicit but not formally named in earlier coverage: the compliance risk does not sit only with the importer of record. Freight forwarders and logistics providers who structure or facilitate transshipment routes are increasingly in CBP's crosshairs under EAPA.
The Bloomberg figure — roughly $300 billion in goods annually reaching US shores via Southeast Asia and Mexico rather than China — is now a structural feature of the tariff environment, not a temporary workaround. The enforcement logic is straightforward: goods simply passing through a third country without "substantial transformation" don't earn a new country of origin under US customs law. The documentation trail required to prove that — production records, bill-of-materials breakdowns, manufacturing facility audits — is not what most rerouting operations were built to provide.
The IEEPA criminal exposure point elevates this from civil penalty territory to a risk management issue with potential 20-year sentences for willful evasion. For freight forwarders, that is a different kind of conversation with shippers than the one about routing efficiency.
FedEx's multi-vendor robotics pivot validates the specialist ecosystem model
The May 1 FedEx post was notable less for the specific partnerships (Berkshire Grey, Dexterity, Nimble, Aurora Innovation) and more for what FedEx leadership explicitly admitted: robotics development is "next level" harder than sensor hardware, and the economics of partnering with specialists who have spent years focused on one problem domain now beat internal R&D timelines.
The Scoop robotic trailer unloader example illustrates why. FedEx had attempted to automate bulk unloading before and failed — the variety of package shapes, weights, and configurations arriving at any given door made the task resistant to earlier off-the-shelf solutions. Berkshire Grey's multi-year collaboration produced a system that handles bulk bundles without requiring single-item picking precision. The key insight: bulk unloading requires judgment, but not granularity. That combination — judgment without granularity — is the sweet spot for current automation.
The competitive context is Amazon's 750,000+ robots. FedEx generating $88 billion in annual revenue cannot fall further behind on automation efficiency without seeing direct per-unit cost consequences. The multi-vendor bet is a compression strategy: pilot partner technology in months, scale what works, avoid years of proprietary R&D.
The inventory AI gap is a visibility-to-execution problem, not an AI readiness problem
The May 1 inventory post sharpened a distinction that matters for every logistics team trying to justify AI investment. McKinsey's 20–30% inventory reduction figure is real and achievable. The reason 70% of shippers aren't capturing it is not AI readiness — it is the visibility-to-execution gap: the distance between what supply chain data reveals and what a logistics team can actually act on in time to matter.
The 62% of supply chain leaders using AI for demand forecasting versus the 30% who have real-time execution-ready data is the operative statistic. Forecast accuracy does not guarantee product availability at the node level. Inventory distortion — stockouts and excess coexisting — is the symptom. Data latency is the disease.
The safety stock shift is the most concrete evidence of the transition underway: safety stock as a primary resilience strategy dropped from 43% in 2025 to 28% in 2026, as companies shifted toward data-driven agility. But 66% of companies are still running static formulas or don't have the visibility to know if their safety stock levels are appropriate for current conditions. That 66% is carrying excess inventory cost they don't need to carry, while simultaneously experiencing stockouts they don't need to experience.
LTL capacity tightening is arriving ahead of schedule
The May 1 LTL post confirmed what April's CASS data and NY Fed GSCPI were already signaling. ACT Research now characterizes 2026 as a supply-driven transition year — tightening capacity, improving pricing dynamics, and gradual margin recovery replacing the post-2023 correction. C.H. Robinson's March 2026 update projects truckload costs up 16–17% year over year, with the trough estimate for spot rates revised upward to $1.72 per mile.
The RXO Q1 Truckload Market Guide's framing — "accelerated carrier attrition has set up a more challenging shipper's market later in 2026" — is worth taking seriously because the catalysts are multiple and overlapping: EPA'27 low-NOx regulations, non-domiciled CDL enforcement removing drivers from the pool, insurance companies unwilling to underwrite affected carriers, and Class 8 orders that take 12–18 months to become operational capacity. Load board postings up 6% year-to-date signal demand recovery that an already-fragile carrier base cannot easily absorb.
The shipper action list is blunt: audit your current contract position before Q3 renewals, diversify carrier relationships now, audit accessorial exposure (a 5% base rate increase can become a 9% effective increase with accessorial creep), consider FTL modal shifts where rate-to-service ratios are improving, and build buffer into your freight budget against a 16–17% year-over-year cost reality.
New Insights from May 12 Coverage
The May 12 posts sharpened one of the year's strongest conclusions: logistics technology value is migrating from visibility into governed execution.
Digital logistics buyers are rejecting dashboard sprawl
The digital logistics market reached an estimated $55.57 billion in 2026 and is projected to reach $150.79 billion by 2031. The SCM software market told the same story at $36.39 billion in 2026, with growth toward $56.01 billion by 2031. But growth alone is not the interesting part. The buyer requirement changed. Freight forwarders and logistics teams are asking whether software owns exceptions, connects workflows, automates handoffs, and gives operators rules they can trust. A dashboard that explains a delay after the fact is losing ground to an execution system that prevents or reprices it while there is still time to act.
Safety, classification, and yard data became routing inputs
Carrier safety data moved from compliance file to routing-guide logic. Roadcheck's 72-hour inspection window, the 21.6% vehicle out-of-service benchmark, and rising small-carrier financial stress make safety maturity a capacity reliability signal. The same operating logic now applies to classification and yard management. Section 232 derivative tariffs — including 25% steel and 50% aluminum exposure — mean HS codes, supplier declarations, and landed-cost assumptions can change freight economics before a shipment moves. Meanwhile, dock and yard research showing 40.3% manual-process bottlenecks, 59.1% dock scheduling or staging problems, and 55.7% yard visibility gaps proves that manual facility work now creates transportation risk.
Integration-first automation beat automation theater
P&G's Supply Chain 3.0 rollout gave 2026 one of its clearest enterprise case studies. The signal was not just robotics or AI. It was integrated planning, procurement, inventory, and transportation execution tied to a $1.5 billion productivity target, 50% forecast-error reduction, and 15% inventory reduction. That aligns with the broader CXTMS thesis: point automation creates local wins, but orchestration turns those wins into network performance.
Upstream buffers and blank sailings proved capacity is managed, not discovered
Target's $265 million, 1.2 million-square-foot Houston receive center showed that inventory buffers are moving upstream when volatility makes store-level replenishment too reactive. On the ocean side, trans-Pacific rates rising despite soft demand proved the inverse lesson: effective capacity is managed through blank sailings, not simply revealed by booking volume. Both cases point back to the same requirement for 2027: TMS workflows need to model capacity quality, timing, and control points — not just price.
New Insights from May 19, 2026 Posts
Ten May 19 posts made the year's operating lesson more concrete: logistics technology now has to govern the messy physical and legal constraints around freight, not just optimize ideal movements. Ports, bridges, van rules, rack engineering, rail steel, fleet leadership, and corridor politics all showed up as technology problems because each one creates data, timing, compliance, and exception decisions that execution systems must capture.
Liability, infrastructure, and facility engineering became planning inputs
The Baltimore bridge settlement turned maritime liability into a supply chain planning issue. Maryland's $2.25 billion settlement with the Dali owner and operator dwarfed the attempted $43.7 million liability cap, which is exactly the point for shippers: legal exposure and operational exposure are different numbers. A single-gateway network needs alternate-port math, carrier notification logic, rerouting rules, customer promise updates, and claims evidence before the disruption happens.
Brunswick's $100 million fourth RoRo berth delivered the same lesson in a more constructive form. Finished-vehicle logistics capacity is being built through vessel draft, berth length, rail expansion, yard elevation, storage, flood resilience, and inland handoffs. The port handled 770,000 vehicle units and more than 53,000 heavy machinery units in 2025, so the bottleneck is not just ocean capacity — it is the data-connected chain from berth to yard to rail or truck.
Seismic warehouse rules added a facility-level warning for automation projects. A 120-foot AS/RS carrying 150,000+ pounds is not just a warehouse technology investment; it is a slab, soil, rack, permit, and professional-engineering problem. Automation readiness now includes the building envelope.
Compliance moved deeper into procurement and sourcing
The EU's July 1, 2026 van regulation reset showed how quickly last-mile procurement can become a compliance strategy. International light commercial vehicles over 2.5 tonnes now need operating assumptions that account for smart tachographs, border-crossing records, driver-hour rules, a 45-minute break after 4.5 hours, and daily-rest constraints. The practical question is no longer only who can quote the lane. It is who can legally and reliably run it.
Tariff-adjusted landed cost also replaced unit price as the more honest sourcing metric. CBP refund processing at $35.46 billion across 8 million-plus entries — with $127 billion in refund steps completed across 53 million shipments and 330,000+ importers — proves landed cost can change after goods move. Add ISPM 15 pallet-mark enforcement and tariff volatility, and sourcing teams need live landed-cost logic tied to broker evidence, supplier documents, and shipment history.
Labor, robotics, and rail reliability converged
Japan Airlines' humanoid ground-handling trial pushed robotics into airside labor resilience. The trial runs from May 2026 through 2028 against a Japanese demographic backdrop that could leave the country short 11 million workers by 2040. The parallel North American signal was practical rather than futuristic: companies ordered 9,055 robots worth $543 million in Q1 2026, while collaborative robot orders rose 55.6% year over year.
Fleet leadership turnover added a less glamorous but equally important labor risk. When a fleet manager leaves, preventive maintenance, DOT compliance, inspection schedules, work orders, and vendor controls can degrade fast. The best early-warning metrics are operational: overdue inspections, open work-order age, repeat repairs, road calls per 100 vehicles, and downtime by asset class.
Union Pacific's domestic steel rail contract tied infrastructure sourcing directly to rail reliability. The seven-year agreement for 100-meter premium rail lengths — requiring 80% fewer welds than standard 80-foot rail — landed as U.S. rail carloads were up 3.6% year over year through the first 18 weeks of 2026. Rail capacity is not only a carrier procurement issue. It depends on the material supply chain that keeps the network physically reliable.
Corridor optionality stayed strategic
Turkey's Europe-Gulf corridor plan reinforced the Middle Corridor theme. The network is expected to take four to five years to build, with Mordor Intelligence assigning Middle Corridor revival a +0.7% forecast CAGR impact on Turkey's logistics market. That is not enough to rewrite routing tomorrow, but it is enough to start building optionality models now: origin fit, customs friction, rail handoffs, port alternatives, lead-time variability, and disruption fallback rules.
New Insights from May 21, 2026 Posts
May 21's coverage sharpened the retrospective around one practical point: logistics teams need to separate signal from noise faster. Fuel, inventories, customs deadlines, enforcement events, inventory availability, and policy commitments all looked like news items on the surface. Operationally, each one became a workflow trigger.
Rate, fuel, and energy signals split apart
DAT's April data showed why truckload planning cannot treat volume and rate as one indicator. Van volume softened 3% from March and reefer fell 9%, yet spot van rates rose $0.15 to $2.67 per mile and reefer rose $0.14 to $3.11 per mile because fuel surcharges did the heavy lifting. With diesel at $5.596 per gallon and crude inventories down a record 17.8 million barrels, the lesson is blunt: freight teams need demand dashboards, linehaul dashboards, and energy-risk dashboards, not one blended transportation-cost view.
Compliance and policy became capacity signals
The tentative EU-U.S. trade deal looked like tariff relief, but it immediately created operational work: effective dates, sunset clauses, refund eligibility, origin evidence, safeguard monitoring, and customer quote logic. CBP's $35.46 billion refund pipeline across 8 million-plus entries proves the data stakes are enormous. Roadcheck Week made the same point from the trucking side: about 5% fewer one-vehicle fleets are active during the event, so compliance windows change available capacity before a single citation hits a carrier record.
Resilience widened from bottlenecks to theft and infrastructure
The 2026 federal freight plan connected bottlenecks, workforce, cargo theft, infrastructure funding, and emerging technology into one resilience agenda. That matters because cargo theft is no longer a side risk; ATRI's $18 million-plus per day loss estimate makes carrier verification, route security, geofencing, facility handoffs, and claims evidence part of the same control tower conversation as congestion and capacity.
Retail and warehouse automation moved closer to the product
Fill rate emerged as the cleanest KPI for whether logistics actually serves the customer. Target's $265 million Houston receive center and leadership changes show availability is now an executive supply chain scoreboard, not a replenishment metric buried in planning. In the warehouse, Locus Robotics buying Nexera signaled the next automation battleground: manipulation. AMRs reduced travel; physical AI now has to touch, sort, pick, and handle product reliably inside messy real facilities.
Sourcing and trade commitments became inventory-control inputs
O'Reilly's private-label and supplier-diversification work reinforced that optionality is only valuable if item, route, supplier, and fill-rate data stay connected. The proposed U.S.-China agriculture board added the trade-policy version of the same lesson: a $17 billion purchase commitment and 400-plus renewed beef facility listings are not just diplomatic signals. They are early warnings for reefer demand, port slots, railcars, inspections, export documents, and agricultural equipment positioning.
New Insights from May 22, 2026 Posts
May 22's posts moved the retrospective from technology platforms into operating context. The strongest thread was that logistics systems now have to ingest signals that used to live outside the TMS: roadside-enforcement funding, inland-port economics, renewable-energy claims, lift-truck interface design, safe parking, fuel indexes, and tariff operating rules.
Compliance infrastructure became more connected
FMCSA's $217 million 2026 grant package, including roughly $89.4 million for CDL program modernization, shows that roadside enforcement is becoming a data network. Carrier master data, inspection history, CDL status, safety trends, and compliance-window calendars increasingly belong inside procurement and routing-guide governance.
Resilience infrastructure outlasts weak volume
Savannah's 443,650 April TEUs, down 14% year over year, did not weaken the inland-port case. It clarified it. Georgia's $134 million Gainesville Inland Port is designed to move 26,000 containers from truck to rail in year one and up to 200,000 annually at full build-out, proving inland rail optionality matters most when demand is uneven.
Energy and facility data entered planning logic
GM's renewable-electricity milestone turned plant power into supply chain planning evidence. With U.S. sites at 100% renewable electricity, global electricity matching at 70%, and Scope 1 and 2 emissions down 52% since 2018, supplier-energy profiles are becoming procurement, emissions, and customer-commitment data — not sustainability-department trivia.
Adoption became the warehouse automation bottleneck
Autonomous forklifts have a strong market story — $3.21 billion in 2026 rising to $5.72 billion by 2031 — but May 22's lift-truck coverage made the practical point: integrated screens and simple operator workflows may matter as much as autonomy features. Hardware only pays when workers can coordinate it without slowing the dock.
Human operating conditions became service-reliability data
Truck-stop safety moved from amenity discussion to carrier-management signal. If truck stops account for 23% to 30% of reported harassment incidents against women drivers and 42% of affected women do not report incidents, route quality and facility access become retention, safety, and service reliability variables.
Fuel and tariffs became formal operating triggers
FTR's -18.9 Shippers Conditions Index reading created a clean escalation model for transportation budgets: below -10, review; below -15, audit surcharge exposure; below -18, prepare exception budgets; below -20, reforecast. Tariff pressure followed the same logic. Infios' 1 million-plus customs-entry analysis and Gartner's 92% tariff-cost concern signal show tariff optimization is now a standing operating model across origin strategy, mode selection, customs data, and supply chain finance.
New Insights from May 23, 2026 Posts
May 23's posts added a practical correction to the year's technology story: the next advantage is not always a new platform. Often it is cleaner operating evidence — produce quality scores, SKU counts, port throughput, delivery service tiers, plant-to-DC savings bridges, packaging disposition proof, carrier safety status, and fuel triggers — flowing into the systems that already decide cost and service.
AI quality data moved upstream in fresh food
Albertsons' AI-powered produce inspection tool showed how fresh supply chains can turn subjective dock checks into structured quality data. When food surplus is valued at $382 billion, better produce scoring is not a nice analytics layer. It is shrink prevention, supplier accountability, claims evidence, and replenishment intelligence.
Network simplification became execution work
Danone's plant-based dairy closure, J&J Snack Foods' Project Apollo savings target, and Under Armour's 25% SKU cut all carried the same operating lesson: simplification only creates value when execution systems absorb the new pattern. J&J's $20 million annual savings target includes $15 million from plant consolidation, but the remaining distribution savings depend on lane design, regional DC positioning, cold-chain handling, and fuel exposure. Under Armour's SKU reduction similarly reduces slotting noise, replenishment complexity, and transportation variability only if item data, WMS rules, and TMS constraints move together.
Sustainability required disposition proof
The Starbucks cup-tracking story made packaging sustainability more concrete. A recyclable package is not a recovered package unless reverse logistics can prove where it went. EPR reporting, recycling economics, customer claims, and waste-hauler handoffs now require the same chain-of-custody discipline logistics teams already use for high-value freight.
Capacity planning shifted from raw trucks to usable trucks
The trucking coverage sharpened the capacity discussion. If roughly 1.2 million trucks operate with no FMCSA safety rating and about 300,000 have conditional ratings, legal risk can reduce usable capacity before demand spikes. Routing guides need carrier-vetting logic, safety status, insurance evidence, and secondary-capacity rules built before the rejection wave.
Service design became a cost-control lever
Contactless big-and-bulky delivery and furniture fuel exposure both showed why shippers need service segmentation inside transportation planning. The difference between a doorstep delivery, threshold delivery, room-of-choice delivery, and white-glove setup is not just customer experience. It changes labor, dwell time, claims risk, fuel exposure, routing density, and surcharge recovery.
New Insights from May 27, 2026 Posts
May 27's posts added a grounded finance-and-flow lesson: the same execution systems that move freight now have to preserve refund evidence, qualify suppliers, diversify automation vendors, and prove physical safety. The technology trend was not another shiny dashboard. It was tighter operating control over the records, partners, buildings, robots, and packaging choices that determine whether logistics plans survive contact with peak volume, tariffs, and warehouse reality.
Customs recovery became a finance workflow
CBP tariff refunds reaching $85 billion turned duty recovery from a customs side quest into a cross-functional workflow. Importers need entry records, origin evidence, HTS classifications, broker correspondence, tariff-payment history, routing changes, and finance approvals in one auditable trail. Refund opportunity is now tied directly to transportation data quality.
Warehouse footprint planning moved back into transportation strategy
Logistics real estate tightening changed the leasing conversation. Construction starts around 190 million square feet, down from roughly 200 million, and low vacancy signals mean shippers cannot solve footprint gaps with generic space hunts. The better model connects warehouse leases to drayage, parcel zones, labor markets, inventory buffers, service promises, and exception cost before a site is signed.
Supplier readiness became a data-quality test
Walmart's inbound simplification story made supplier compliance more operational. Clean POs, ASNs, appointment data, carrier identity, label discipline, and receipt accuracy now decide whether suppliers can flow through a simplified retail network. Bad inbound data is no longer paperwork noise. It becomes detention, chargebacks, missed receipts, and unreliable store replenishment.
Automation risk expanded from hardware to vendor concentration
Robot supplier diversification extended the year's resilience theme into the warehouse. If 75% of operators are using or planning automation and robot life cycles can run 10 years or more, single-vendor lock-in becomes an operational risk. Mixed-fleet orchestration, spare-part access, middleware portability, and exit plans now belong in automation procurement.
Physical safety and load quality became data layers
Pedestrian safety and unitizing coverage showed that warehouse throughput depends on better sensing and packaging evidence. Forklift-pedestrian risk needs proximity data, telematics, aisle design, AI detection, and event follow-up. Load stability needs stretch-wrap settings, carton quality, pallet condition, and damage records connected to shipping performance. Safety and packaging are now execution data, not back-room compliance chores.
New Insights from May 28, 2026 Posts
May 28's posts pushed the retrospective from visibility and execution into proof, corridor design, and trigger-based resilience. The new lesson is uncomfortable but useful: resilience does not live in a strategy deck. It lives in refund records, free-time clocks, service-tier cost signals, LNG project milestones, plant-restart playbooks, cold-chain labor triggers, and maritime investment decisions that are connected to transportation workflows before the exception arrives.
Documentation became financial infrastructure
The de minimis refund dispute and Maersk detention-charge settlement showed that logistics documentation now determines real cash outcomes. Importers chasing tariff refunds need entry histories, origin evidence, duty-payment logic, broker correspondence, and legal eligibility separated cleanly. Ocean shippers need milestone proof, free-time ownership, and invoice review before detention and demurrage become unrecoverable cost. The common thread is simple: if the record is fragmented, the money is exposed.
Corridor resilience expanded into maritime and energy infrastructure
The $200 million maritime efficiency fund and Germany-Canada LNG deal both point to freight corridors as investment systems, not just routes. Ports, inland links, project cargo, clean fuels, shipbuilding capacity, and energy sourcing now sit inside the same planning conversation. A new LNG corridor covering up to 1 million metric tons per year does not matter operationally unless port readiness, heavy-lift capacity, customs documents, and disruption scenarios can move with it.
Cold-chain and industrial recovery needed trigger rules
Cargill's beef labor standoff and Novelis' aluminum restart made resilience painfully concrete. Cold-chain planners need labor-risk thresholds, reefer secondary-capacity rules, and customer-allocation logic before product is stranded. Industrial shippers need fire-damage contingency playbooks, substitute-source records, allocation rules, and transport milestones before a plant with 1.7 billion pounds of annual capacity goes offline.
Rate optimization became service-design math
Carrier rate optimization for e-commerce looked less like shopping for the cheapest label and more like controlling the inputs behind the label. Mattress Firm's contactless model — about 25% of deliveries, compared with paid in-home service starting at $109.99 — showed why dimensions, dwell time, delivery promise, returns, and service tiers need to feed carrier selection. The wrong service promise can erase any nominal rate discount.
Resilience rules beat heroic response
The strongest May 28 theme was operational discipline. Carry buffers where recovery time exceeds customer patience. Dual-source when supplier risk outweighs freight savings. Switch modes when delay cost crosses margin cost. Preserve margin when service recovery is unlikely. Review resilience exceptions like financial variances. That is how resilience becomes executable rather than aspirational.
New Insights from May 29, 2026 Posts
May 29's posts added the execution-control layer to the year-end picture. The same systems that move freight now have to refresh inventory availability during demand spikes, coordinate postal handoffs, prove marketplace compliance, catch freight-spend errors, synchronize supplier quality with production rate, and translate workforce, stockpile, autonomy, export, and rail-merger signals into live operating decisions.
Inventory availability became a speed problem
Active caching made a blunt point: stale availability data is now a transportation risk. When the average disruption is estimated at $1.5 million per day, only 6% of companies report full end-to-end visibility, and 94% say disruptions have hurt revenue, batch refreshes are too slow. Inventory, order promising, allocation, and routing need faster shared state.
Final-mile partnerships became network design
The DHL-USPS agreement, worth well over $10 billion, showed that parcel strategy is moving from carrier selection to handoff architecture. USPS access to 41,000-plus ZIP codes and 170 million-plus delivery points gives shippers reach, but only if sortation timing, induction logic, scan visibility, exception ownership, and customer promises are modeled together.
Freight spend controls moved into executive governance
Hub Group's $77 million purchased-transportation understatement turned freight audit into board-level risk. The lesson for shippers is direct: accessorials, accruals, carrier-rate evidence, invoice exceptions, and GL reconciliation need to connect before a small transportation-data error becomes a finance credibility problem.
Compliance shifted to SKU and seller evidence
Temu's €200 million unsafe-products fine made marketplace import compliance a logistics workflow. Product safety, seller identity, customs documentation, inspection holds, returns disposition, and recall readiness all need SKU-level evidence that survives regulatory scrutiny. Speed without proof is now a liability.
Physical AI, supplier quality, and labor orchestration converged
Autonomous truck coverage, Boeing's 737 Max supplier-quality ramp-up, and workforce orchestration all landed on the same operating truth: automation only scales when physical execution is synchronized. Level 4 autonomy, part traceability, quality holds, labor availability, task queues, and cutoff times are not separate planning problems anymore. They are one execution-control problem.
Resilience planning got more specific
Critical-goods stockpiling, Europe export-productivity risk, and UP-NS rail-merger scrutiny all pushed resilience away from generic optionality. Stockpiles need replenishment logic. Export networks need productivity assumptions and cost-to-serve visibility. Intermodal shippers need fallback terminals, contract protections, and lane-level alternatives before rail concentration changes the map.
New Insights from May 30, 2026 Posts
May 30's posts added a scorecard-and-optionality layer. The common theme was not another shiny technology category. It was proof: proof that a fulfillment network can hit the service promise, proof that warehouse errors are leaking into freight bills, proof that rail service data can support procurement decisions, proof that tariff refunds are finance workflows, and proof that dual sourcing, air capacity, and store fulfillment only work when transportation data is clean enough to govern the decision.
Fulfillment redesign became a network-control problem
E-commerce network redesign and Walmart's 30-minute delivery coverage made the same point from different angles. Centralized fulfillment is cheap until distance breaks the customer promise. Store fulfillment is fast until inventory accuracy, labor, dispatch windows, and last-mile handoffs become the constraint. Walmart's ability to reach 36% of U.S. households within 30 minutes turns proximity into a measurable network-design benchmark, not a marketing slogan.
Warehouse inefficiency became freight spend leakage
The hidden WMS-cost story connected warehouse discipline directly to transportation margin. Bad dimensions, late waves, rework, poor cartonization, and missed cutoffs become accessorials, expedited freight, failed pickups, and unreliable carrier scorecards. With warehouse robotics projected from $29.98 billion in 2025 to $65.74 billion by 2031, automation investment only pays if the warehouse data feeding freight execution is clean.
Rail and ocean decisions demanded better scorecards
Ocean contract delays and rail service reporting both pushed procurement toward evidence-based controls. Ocean shippers need lane-level contract coverage, spot triggers, and index discipline when rates sit materially below historical norms but reliability and demand remain uneven. Rail shippers now have stronger building blocks through OETA and ISP reporting, but the real value comes when carrier metrics, facility dwell, shipment milestones, and financial consequences sit in one scorecard.
Refunds, tariffs, and dual sourcing became finance-grade workflows
Tariff refunds and SharkNinja's dual-sourcing playbook showed that trade strategy is only as good as its operational evidence. Refund processes spanning $35.46 billion in payments and $85 billion in accepted refunds require entry history, origin proof, duty payments, broker records, and transportation context. Dual-sourced SKUs need the same rigor: origin, landed cost, transit time, inventory position, and mode optionality all have to move together.
Speed capacity needed governance
UPS's $50 million Mexico air-freight investment confirmed that automotive and industrial shippers are buying time, not just capacity. The trick is deciding when speed is worth the premium. Approval rules, customs readiness, part criticality, production risk, and post-shipment cost review need to be tied to the air move before emergency freight becomes a habit.
Procurement AI worked best as a narrow pilot
The procurement AI story reinforced the broader 2026 AI lesson: start small, keep humans in the loop, and connect sourcing recommendations to downstream execution. Agents can summarize bids, flag supplier risk, and prepare negotiation evidence, but they cannot fix messy supplier, transportation, customs, and finance data by magic. Narrow pilots beat platform theater.
New Insights from June 1, 2026 Posts
June 1's posts added an execution-record layer to the retrospective. The new throughline is trust: not vague visibility, but a defensible operating record that connects shipment events, inventory, customs data, supplier status, labor risk, cold-chain condition, chain-of-custody evidence, customer promises, and financial approval.
External networks made independent data control more important
Amazon Supply Chain Services showed that freight, fulfillment, parcel, air, customs, bulk storage, and distribution are being sold as one flexible network. The scale — 200-plus fulfillment centers, 80,000 trailers, 24,000 intermodal containers, and 100-plus aircraft — is impressive, but the real technology implication is data portability. Shippers need their own TMS/control layer to compare outsourced performance, preserve order truth, and avoid going blind inside someone else's network.
Secure control towers became execution infrastructure
Penske-style secure logistics platforms reframed the control tower around trust: normalized shipment events, role-based access, audit trails, API connectivity, document status, and customer-facing exception ownership. With disruption exposure rising and only 19% of companies deploying AI tools at scale, messy data is no longer an inconvenience. It is the thing that prevents automation from acting safely.
Cold chain and critical minerals pushed proof into the shipment record
Clinical trial and cobalt coverage showed two different versions of the same requirement. Trial logistics needs temperature, customs, protocol, depot, site, and patient-window context before a delay happens. Critical minerals need origin, export permits, ESG evidence, sanctions screening, quota status, chain of custody, and customer eligibility tied to each move. In both cases, freight without proof is not execution. It is exposure.
Labor and aerospace supplier risk became logistics metrics
Samsung's 45,000-plus worker strike exposure and Airbus' supplier-constrained delivery targets made upstream production signals part of transportation planning. Labor deadlines, supplier promise adherence, quality holds, document dwell, expedite spend by part family, and shortage-to-shipment cycle time now belong in the same operating review as carrier performance. Freight cannot create supply; it can only move what the network can release.
AI ROI came down to ownership
The June 1 technology-ROI post reinforced the year's central AI lesson: buying software is easy, redesigning execution is hard. Gartner's 17% versus 83% AI operating-model split explains why many programs still underperform. Predictions and alerts create value only when the workflow already defines owners, severity, escalation, customer messages, downstream updates, and post-event review.
New Insights from June 2, 2026 Posts
June 2's posts added an upstream-signal layer. The core lesson: by the time a rate changes, a facility misses a ship date, or a postal network restricts service, the real signal has usually been visible somewhere else first — in rail funding, labor contracts, supplier footprints, manufacturing PMI, cash controls, emissions proof, or carrier credit data.
Infrastructure resilience became a regional capacity variable
The Fort Smith port rail rebuild showed why inland infrastructure belongs in shipper risk models. An $8.1 million grant is not just a local project when a flood previously damaged 20% of port capacity and regional rail demand is rising. Small ports, sidings, transload points, and rail-served industrial parks are now optionality assets.
Supplier moves and trade rules converged
Autoliv's Turkey manufacturing wind-down affecting 2,200 jobs reinforced that supplier exits are logistics events long before the final production date. Origin qualification, tooling moves, safety-stock windows, carrier contracts, and customer commitments need to move together — especially when tariff exposure can reach 25% on non-originating flows.
Parcel strategy shifted from strike risk to network health
Canada Post labor peace removed an immediate labor cliff, but it did not remove postal dependency risk. With DHL-USPS moving 170 million parcels annually under a $10 billion-plus agreement and USPS watching 2027 cash pressure, parcel planners need service-design dashboards that track labor, cash, induction performance, and alternate-carrier readiness together.
Sustainability proof moved into yard and facility operations
Green supply chain coverage made the sustainability point more operational. Yards, shuttles, electric equipment, appointment discipline, idle time, and move-level evidence are where emissions programs become real. Road transportation's 68.7% share of transportation emissions makes the case for measurable lane and facility action, not broad claims.
Production and credit signals joined rate intelligence
May PMI at 54, production at 55.9, supplier deliveries at 54.3, and prices at 60.6 showed freight demand can tighten before order books scream. Trucking credit metrics made the mirror-image point: carrier finances, failures, insurance pressure, and usable capacity should sit beside spot rates and tender rejections in procurement reviews.
Next-day retail and heavy air cargo proved speed is selective
Target's $265 million, 1.2 million-square-foot receive center and Asia-U.S. heavy air cargo pressure both point to disciplined speed. The winners will not expedite everything. They will decide which SKUs, nodes, suppliers, and customers deserve premium capacity — and they will have the data to defend those decisions.
What 2026 Taught Logistics Leaders
A few lessons kept repeating across this year's reporting:
- Narrow AI beats vague AI. Focused workflows with clear data and measurable outcomes won.
- Integrated systems beat point tools. The best results came when TMS, WMS, audit, visibility, and automation layers shared data.
- Resilience has to be executable. Scenario modeling without workflow integration is just a prettier spreadsheet.
- Infrastructure matters, but digital coordination matters first. Physical constraints, maintenance bottlenecks, and equipment imbalance can kill a digital strategy fast, but smarter orchestration can also unlock hidden capacity.
- Control of the data layer matters more in a consolidating market. If someone else owns the workflow, they eventually own the leverage.
- Technology has to reduce human chaos. If a new tool makes operators busier without making decisions cleaner, it is probably bullshit.
- The multimodal divergence demands mode-specific procurement discipline. Treating ocean, trucking, and air as one bucket in a spreadsheet is how companies get surprised in 2026.
- The trucking capacity cliff is real and near-term. Early tender, carrier relationship investment, and modal optionality are not contingency measures — they are the baseline.
- The 60% AI planning failure rate is a people problem, not a tech problem. Planning maturity, data governance, and change management are the real investment priorities.
- Ocean's buyer's window has a closing date. Hybrid index-linked structures and Red Sea normalization clauses belong in every Q2 renewal conversation.
- Tariff rerouting documentation is now a forwarder liability. CBP enforcement is sharpening and IEEPA criminal exposure is real.
- FedEx's robotics pivot validates the specialist ecosystem model. Internal R&D timelines cannot match focused specialists working on one problem domain for years.
- The visibility-to-execution gap is the real inventory AI bottleneck. 62% use forecasting AI, only 30% have execution-ready data.
- Cold-chain infrastructure is now a strategic 3PL category. Healthcare cold-chain networks are being built as forwarding-integrated infrastructure, not warehouse add-ons. GLP-1 volumes and biopharma complexity are pulling temperature-sensitive freight toward operators that can guarantee chain-of-custody continuity.
- The connected worker upgrade is real — but the integration bottleneck is the actual competitive differentiator. $20B market, 25-40% task time reductions, 99.9% voice picking accuracy. The devices work. Getting them to talk to TMS, WMS, and ERP without custom development is still the hard part — and the 42% of operators who rank integration as a top-three digital challenge are the ones who haven't captured the productivity upside yet.
- The three-layer freight audit stack is table stakes at $5M+ freight spend. TMS + freight audit consistently delivers 8-12% savings over audit alone. Most operators are still leaving 60-70% of their recoverable freight dollars unexamined because they only run parcel audit — missing TL/LTL billing errors and contract rate misapplications that are larger and less obvious leaks.
- Accessorial fee control is now procurement intelligence. The May 6 charge taxonomy showed why invoice validation, duplicate detection, and surcharge categorization have to feed carrier negotiations — not just refund requests.
- The RELEX trust gap defines the AI deployment model for the next three years. 54% of AI users want human final call; only 10% trust fully autonomous decisions. This is not a temporary holdout — it is the operating model. The AI planning value chain works when TMS and execution systems are built to act on AI outputs at the speed the business requires.
- WMS is the fastest-growing supply chain execution category — and it's creating a fulfillment stack upgrade imperative. $4.77B in 2026 growing to $10.89B by 2031 at 17.98% CAGR. The Google Trends signal for "WMS for ecommerce" at 300 confirms e-commerce complexity has outgrown legacy systems. The OMS + WMS unified stack is replacing standalone WMS, and the evaluation criteria shifted from features to integration depth with order sources, returns workflow automation, and bin-level real-time accuracy. Shippers who haven't re-evaluated their WMS in three years are likely carrying hidden fulfillment cost.
- Integration debt is the tax on every logistics technology purchase. May 9 data showed strong software demand, but the real advantage goes to operators that connect planning, execution, audit, safety, maintenance, sustainability, and customer workflows without adding reconciliation labor.
- Capacity quality now matters as much as capacity price. Secondary capacity, deferred maintenance, safety maturity, and vehicle out-of-service risk belong inside procurement and routing-guide governance, not in post-failure root-cause reports.
- Safety data is routing data. Roadcheck, CSA patterns, maintenance quality, and vehicle out-of-service exposure now belong in carrier selection logic, not only compliance review.
- Classification is cost control. Section 232 derivative tariffs made HS-code discipline, bill-of-materials evidence, and supplier declarations part of freight budget governance.
- Dock and yard execution is transportation execution. Manual appointment, staging, and trailer-location work creates detention, missed pickups, bad ETAs, and unreliable carrier scorecards.
- The winning digital logistics platform is an execution system. The May 12 market data confirmed buyers are not short on dashboards. They are short on systems that turn events into governed workflow.
- The yard gate is now a control point. Arrival identity, seal condition, detention timing, security evidence, and dock readiness need to be captured before the trailer is already a problem.
- Physical flow still decides automation ROI. Conveyors, packaging output, vertical movement, and cartonization are not old-world details. They are the infrastructure robots and AI depend on.
- Lightweight parcel pricing needs SKU-level math. USPS Ground Advantage changes, fuel surcharges, dimensions, zones, and sub-pound ounce bands can wipe out margin if parcel logic lives outside the TMS.
- Physical constraints are now data constraints. Bridges, RoRo berths, seismic rack rules, rail steel, and van tachographs all create operational data that has to flow into planning before it becomes disruption.
- Tariff-adjusted landed cost beats unit price. Refunds, duties, pallet marks, origin evidence, and broker timing now change sourcing economics after the purchase order is cut.
- Fuel and volume are different freight signals. April truckload data proved weak TVI readings can coexist with rising all-in rates when diesel and surcharges move faster than demand.
- Compliance calendars are capacity calendars. Roadcheck, tariff deadlines, safeguard windows, and customs refund portals change routing, tendering, quoting, and documentation before the formal event is over.
- Fill rate is the customer-service KPI hiding in logistics. Availability now depends on whether inventory, WMS, TMS, supplier, and receive-center data can explain the missing 5% before customers feel it.
- The TMS boundary is expanding. Renewable-energy data, safe-parking access, inland-port rail options, CDL modernization, and tariff-finance rules now shape transportation decisions as directly as rates and transit times.
- Operator adoption is automation infrastructure. A lift-truck screen that prevents workflow friction can matter more than another flashy autonomy claim.
- Simplification is only real when execution systems change. SKU cuts, plant closures, and service-tier redesigns create savings only when WMS, TMS, inventory, and finance logic stop operating as if the old complexity still exists.
- Sustainability claims need logistics evidence. Recyclable materials, renewable-energy commitments, and EPR reporting all need chain-of-custody data before they become defensible operating claims.
- Refund recovery is now logistics data work. Tariff refunds, duty recovery, and classification changes only pay out when customs, transportation, broker, and finance records are connected.
- Automation sourcing needs a resilience plan. Robot vendors, middleware, parts, safety certifications, and exit paths now deserve the same diversification discipline as critical material suppliers.
- Inbound compliance is supplier enablement. Retail simplification fails unless suppliers can produce clean PO, ASN, appointment, carrier, label, and receiving data at the speed the network expects.
- Availability data has to move at demand speed. Active caching, inventory signals, allocation rules, and transportation promises now need refresh logic that can survive demand spikes.
- Parcel partnerships are handoff systems, not just contracts. DHL-USPS-style scale only works when induction timing, scan ownership, exception rules, and service promises are visible end to end.
- Freight finance controls are operational controls. Purchased transportation expense, invoice accuracy, accruals, and carrier-rate evidence now belong in the same governance model as service performance.
- Marketplace compliance is SKU-level logistics. Product safety, seller proof, inspection outcomes, returns, and customs records have to travel with the shipment data.
- Store fulfillment is network design now. Fast local delivery only works when inventory, labor, dispatch, carrier handoff, and exception data are governed together.
- Warehouse errors are freight costs. Late waves, poor dimensions, and rework belong in transportation cost analytics before they become accessorials and expedited moves.
- Rail scorecards need facility truth. OETA and ISP metrics matter most when they are tied to shipment milestones, dwell, contract terms, and financial impact.
- Dual sourcing without transportation optionality is theater. A second origin only helps if landed cost, mode choice, inventory position, and customs evidence are executable.
- The execution record is the new control tower. June 1 coverage made this explicit: logistics systems need to prove what changed, who owns the exception, what it costs, which documents support it, and whether the customer promise still holds.
- Externalized networks require internal truth. Amazon-scale outsourced logistics can be useful, but shippers still need independent data portability, performance benchmarks, exception governance, and exit-ready operating records.
- Capacity risk starts before the tender. June 2 coverage showed that PMI, supplier exits, port grants, labor contracts, carrier credit, postal cash, and emissions proof all become transportation signals before rates move.
- Speed needs selectivity. Next-day retail and heavy air cargo both work best when premium capacity is tied to SKU economics, customer promise, inventory position, and risk tolerance.
- Planning speed now tests governance speed. June 7 optimization coverage showed that shrinking analysis from weeks to hours is only useful if approval rights, carrier commitments, inventory assumptions, and customer-impact rules can keep pace.
- Infrastructure funding is now a data product. Grant readiness depends on being able to prove bottlenecks, emissions, safety, economic impact, resilience value, and private operating commitments with shipment-level evidence.
New Insights from June 4-7, 2026 Posts
June 4's posts added an execution-governance layer; June 5's posts added the interface-and-capacity layer beneath it; June 6 added the capacity-evidence layer; June 7 added the planning-compression and infrastructure-readiness layer. The central lesson: logistics teams are no longer short on signals, portals, AI demos, or market warnings. They are short on clean ownership, proof trails, capacity context, budget triggers, and workflows that convert signals into decisions before cost, service, compliance, inventory, or shelf-life failures surface.
- 3PL outsourcing now requires stronger shipper-side control. With 94% of domestic Fortune 500 companies using at least one 3PL and some large accounts exceeding $100 million, outsourcing has become the operating model. But Volkswagen-style multi-3PL complexity shows why shippers need independent data rights, KPI governance, and exception ownership.
- Brownfield modernization is beating automation theater. Physical constraints and tighter capital are pushing teams toward targeted WMS fixes, AMRs, middleware, and workflow redesign inside existing buildings instead of risky big-bang resets.
- Robotics is mainstream, but coordination is the bottleneck. The 52% adoption signal changes the question from “should we test robots?” to “can we orchestrate fleets, maintenance, safety, labor, inventory, docks, and transportation as one flow?”
- Cold-chain maps must update at operating speed. Americold cost takeout and DHL/RLCold expansion show the network itself is changing; static facility maps cannot protect shelf life, appointment recovery, reefer capacity, or food-safety evidence.
- Trade proof belongs in the shipment record. Forced-labor proposals across 60 trading partners, CBP's $1.7B detention history, and Section 232 steel/aluminum relief rules all point to the same control: origin, supplier, HS, plant, and raw-material proof must travel with the load.
- Market intelligence has become a daily ritual. FreightWaves' June market readout, Q2 brokerage rate pressure, 6% producer price inflation, carrier exits, and 16% YoY spot-rate increases show monthly transportation reviews are too slow.
- Summer volatility rewards density discipline. The 19% increase in average orders per consolidation load proves operators are already changing behavior; the next advantage is dynamic cutoffs, consolidation rules, mode-switch triggers, and customer-specific service promises.
- Automation resilience depends on integration. June 4's automation coverage reinforced the year's core thesis: technology does not create resilience unless alerts, owners, escalations, documents, and execution changes are connected.
- The defensible software layer moved below the interface. June 5's AI and ShipStation Global coverage showed that screens, copilots, and portals are becoming easier to copy; defensibility now lives in carrier integrations, clean master data, exception taxonomies, benchmarkable rates, proof trails, and workflow ownership.
- Physical capacity is back inside the technology conversation. Data-center flatbed demand, Port Houston truck-flow investment, Great Plains fulfillment, India last-mile density, Japan cold-chain 3PL services, EXPO PACK automation, and RFID packaging all say the same thing: digital orchestration only wins when it understands dock doors, gates, cartons, vehicles, labor, and capacity constraints.
- Capacity tightness now needs earlier evidence. June 6 freight-market and maintenance coverage showed capacity risk can appear through bankruptcies, broker vetting, fuel, maintenance deferral, auction behavior, compliance pressure, and equipment reliability before broad demand looks healthy.
- Parcel strategy has become portfolio strategy. The fall of UPS/FedEx/USPS share from 85% to about 60%, Amazon's 6.7B parcels, and flat-volume revenue growth prove e-commerce shippers need allocation logic, surcharge analytics, and carrier-diversification rules rather than a national-carrier default.
- Ocean margin protection depends on surcharge governance. China-U.S. East Coast rates moving above $5,000 and four-figure Mediterranean surcharges show forwarders need quote-validity, pass-through, and customer-approval workflows before peak-season pricing surprises hit invoices.
- Food and healthcare logistics are becoming proof-heavy specialties. Perishable inventory waste, cold-chain visibility gaps, and UPS Healthcare's Andlauer deal all reinforce the same point: temperature-sensitive logistics now competes on documented control, not just refrigerated capacity.
- Critical minerals are now freight-planning objects. Rare earth export controls make component origin, license status, production priority, and mode choice part of logistics planning even when the physical shipment is small.
- Planning cycles are collapsing from weeks to hours. AI optimization, digital twins, and mathematical solvers can now turn routing, fleet, sourcing, and hub-and-spoke scenarios around fast enough to affect live freight, but only if finance, procurement, and operations agree on decision rights before the model runs.
- Budget reforecasting cannot wait for invoices. The April LMI reading of 69.9, transportation prices at 95.0, transportation capacity at 28.4, and record price-capacity spread make monthly variance review too slow for 2026 freight economics.
- Freight infrastructure is becoming a grant-readiness workflow. DOT planning, BUILD America 250, port bottlenecks, rail crossings, inland hubs, and private facility expansions all require logistics teams to document economic impact, congestion exposure, safety, emissions, and resilience before funding windows open.
- Truck-air and same-day LTL are converging around regional speed. FedEx's Netherlands road-hub expansion and same-day LTL models both show that premium service increasingly depends on regional cutoff control, dock-door throughput, pallet visibility, and alternate-capacity rules.
- Weather is now an operating input, not an exception note. The record Operational Pressure Index reading and rising disruption frequency make maintenance, routing, inventory buffers, facility staffing, and customer-status workflows weather-sensitive by design.
- Service-parts logistics is specializing fast. UPS's automotive and industrial push shows high-value parts networks need SKU-level availability, RFID visibility, Mexico air-ground options, same-day final mile, and time-definite promises in one execution layer.
- Warehouse buyers want relief, not checklists. The 2026 warehouse fulfillment and robotics data reinforces that WMS value is judged by labor relief, decision speed, exception reduction, and automation utilization, not brochure-length feature inventories.
- Trade deceleration turns inventory timing into risk control. A softer WTO goods barometer alongside sourcing shifts and digitization plans means purchasing calendars, buffer policies, and supplier geography need tighter feedback from freight and customs data.
New Insights from June 10-12, 2026 Posts
The June 10-12 posts added a portfolio, regional-growth, and workforce-readiness layer to the retrospective. The biggest update: logistics technology is no longer just optimizing shipments already in motion. It is increasingly deciding which carrier portfolio, market corridor, customs path, workforce process, and exception record makes a promise executable before the shipment is created.
- Parcel strategy moved from refunds to portfolio governance. Late-delivery refunds recover only a small slice of parcel leakage; the bigger savings live in accessorial review, dimensional accuracy, address quality, residential surcharge control, carrier allocation, and economy-service tradeoffs.
- Cloud TMS has crossed from modernization project to operating baseline. June 10 market data around cloud TMS growth reinforces that transportation teams need configurable execution workflows, API connectivity, and live cost governance rather than disconnected rating and tracking tools.
- Amazon's open logistics network changes parcel benchmarking. Shippers now have to compare Amazon Supply Chain Services, UPS/FedEx, USPS handoffs, regional carriers, and multi-carrier platforms as one portfolio instead of treating national-carrier contracts as the default.
- Ocean and Hormuz risk require surcharge controls before invoices arrive. Peak-season surcharges and war-risk premiums make quote validity, pass-through rules, customer approvals, and alternate-mode triggers part of the operating workflow.
- API-native brokerage is compressing tender cycles. Freight brokerage is becoming more machine-mediated, but speed only helps if carrier identity, price history, capacity confidence, and exception handoffs are governed in the same system.
- ASEAN and Saudi growth favor value-added fulfillment and customs speed. Regional logistics expansion is not just more delivery volume; it is bonded-zone orchestration, returns, inventory services, parcel evidence, and faster document movement.
- Customs brokerage is becoming a nearshoring constraint. Mexico, Texas, and China cross-border coverage all point to the same bottleneck: growth lanes fail when paperwork, classification, release status, and broker capacity do not scale with freight volume.
- Smart containers are becoming pre-clearance infrastructure. Container telemetry now matters because it can support release decisions, insurance evidence, temperature/security proof, and dwell-time intervention before cargo reaches the bottleneck.
- Regional freight growth needs local lane discipline. Argentina, Canada, Mexico, and MEA coverage showed that visibility must adapt to geography: road reliability, corridor redundancy, customs regimes, infrastructure gaps, and market-specific carrier behavior.
- Frontline AI adoption is now a logistics execution risk. June 12 coverage made the uncomfortable point clear: AI projects fail when warehouse, dispatch, brokerage, and customer-service teams do not trust or understand the workflow change. Upskilling is not HR theater; it is operational risk control.
- Event logistics stress-tests master delivery scheduling. World Cup coverage showed major events compress road access, venue delivery windows, labor availability, security checks, and city freight flows into a live scheduling problem.
New Insights from June 14, 2026 Posts
June 14's posts added an identity, API-control, and origin-proof layer to the retrospective. The core lesson: logistics technology can only automate decisions safely when it knows who is acting, which signal is authoritative, which proof travels with the order, and which mode or port choice protects the promise.
- Fraud prevention became an identity workflow. Deceptive pickup coverage showed why release authorization, carrier identity, appointment changes, driver verification, seal checks, and unusual ETA changes need to be captured before freight leaves the facility. Paper controls are too slow for fraud schemes that exploit legitimate-looking carrier networks.
- ETA changes became compliance triggers. Visibility is no longer passive. A late truck, early arrival, route deviation, or appointment shift can trigger customs, theft, safety, spoilage, customer-notification, or escalation workflows. The control tower has to know which ETA changes matter and who owns the response.
- Blockchain narrowed to exception proof. The practical value is not putting every document on a ledger. It is preserving tamper-resistant evidence for handoffs, releases, condition changes, seals, identity checks, and disputes where multiple parties need the same record.
- APIs need product discipline. Freight data, load-board, and order-tag coverage all pointed to the same operating problem: more signals do not help if refresh rules, decision rights, confidence thresholds, exception owners, and reference fields are unclear. Automation needs a data contract, not just another endpoint.
- Driver-first apps became retention infrastructure. Better driver workflows reduce check-call noise, dwell ambiguity, milestone gaps, and carrier frustration. Driver UX is now part of data quality.
- Origin and port optionality moved upstream. Local-content rules and Japan-U.S. port-call expansion both showed that sourcing, origin proof, port choice, inland cost, and SKU allocation now have to be modeled before the freight plan is locked.
- Mode downshifts became budget intelligence. Moving truckload freight into LTL can protect budgets, but only when dimensional data, service promises, accessorial exposure, consolidation logic, and customer priority are governed inside the TMS.
New Insights from June 15, 2026 Posts
June 15's posts added a planning-slack and process-debt layer to the retrospective. The core lesson: the freight market is not giving operators enough room to keep stale assumptions alive. Costing, traceability, cold-chain design, import timing, pallet supply, cyber exposure, and warehouse automation all now need evidence-rich workflows before disruption hits.
- Carrier costing became margin governance. Rising operating costs, tariff-driven routing changes, accessorial exposure, and lane instability mean transportation teams need lane-level costing that reflects actual carrier behavior, not static bid assumptions.
- Traceability became recall-scope optimization. Grocery and cold-chain teams are not just proving compliance; they are using lot, pallet, trailer, temperature, and stop records to limit how much product gets quarantined when something goes wrong.
- India cold chain growth needs regional node discipline. National growth headlines hide local risk. Reefer capacity, handoff timing, exception ownership, and regional demand shifts have to be modeled node by node.
- The May LMI turned market data into planning triggers. A 69.5 headline index, inventory costs at 84.1, elevated warehouse prices, and accelerating transportation prices all point to more frequent lane, storage, and budget reviews.
- Peak-season frontloading became a finance decision. A 51% weekly Asia-U.S. West Coast rate jump is not just a transportation signal; it changes landed cost, working capital, storage exposure, tariff timing, and markdown risk.
- Rail intermodal became a truckload budget valve again. Strong May rail and intermodal gains, shorter truckload haul lengths, and 10%-20% intermodal contract savings make modal conversion a live procurement workflow, not a sustainability sidebar.
- Pallet sourcing became shipment readiness. Pallet availability, repair cycles, export treatment, reusable-pool imbalance, and dock throughput now need to be visible before a load is tendered.
- Software vendor risk became operational continuity risk. TMS, WMS, carrier portals, APIs, and AI tools now sit inside freight execution. Platform selection has to include security posture, incident response, data portability, and fallback workflows.
- Warehouse automation exposed process debt. Robotics adoption is climbing, but the value leaks away if old exception processes, tribal knowledge, poor slotting, and dock workarounds survive underneath the automation budget.
New Insights from June 16, 2026 Posts
June 16's posts added a readiness, permissions, and route-economics layer to the retrospective. The core lesson: logistics technology is no longer judged only by whether it can optimize a load. It is judged by whether the right role can see the right data, whether the workforce can execute the next step, and whether the asset, package, fuel window, route, or corridor can support the promise before automation acts.
- Freight AI moved from planning to engineering. C.H. Robinson's 92% autonomous planning benchmark is important, but the next frontier is continuous improvement: finding recurring consolidation waste, handoff failures, detention patterns, and master-data problems while they are still forming.
- Defense logistics reframed AI as demand-supply alignment. Dashboards do not improve readiness if demand signals, inventory, supplier promises, transportation status, and exception ownership still move on different clocks.
- Packaging became a safety-control point. Food logistics teams now need package version IDs, supplier-change alerts, hold/release triggers, scan rules, and transportation specs because packaging changes can alter recall scope, airflow, pallet stability, and traceability.
- Franchise logistics needs one playbook. Gong cha's expansion showed why fast-growing brands need governed item data, regional replenishment math, customs/import discipline, warehouse process controls, and exception measurement before store count multiplies hidden variation.
- Rail visibility moved below the mileage map. Total railway kilometers are market context; the operational advantage comes from terminal dwell, ETA confidence, security events, chassis status, and truck-rail handoff control.
- Fuel risk moved upstream. India's diesel and jet-fuel export taxes, U.S. diesel above $5, and air-cargo fuel exposure all showed why fuel clauses, lane sensitivity, policy triggers, and surcharge reviews belong inside execution workflows.
- Maritime labor became schedule risk. Crew availability, crew-change constraints, shore-side knowledge, fuel-transition training, and exception-aging signals now belong in ocean contingency planning.
- Warehouse modernization became workforce design. A less experienced workforce can move faster only when receiving, picking, packing, staging, dock handoffs, and exceptions are guided by clean workflow data instead of tribal memory.
- EV truck pilots need lane economics. The 44.7% diesel-savings signal matters because it came from a dense, return-to-base, multi-stop route; the scalable question is charger utilization, dwell visibility, route predictability, and exception recovery.
- Role-based freight data became the national visibility test. DOT's dashboard concept will only work if ports, carriers, railroads, truckers, retailers, and agencies share the right exception data with the right party at the right time—not if everyone gets another map.
New Insights from June 17, 2026 Posts
June 17's posts moved the retrospective from readiness into point-of-execution control. The core lesson: AI, automation, infrastructure funding, and platform outsourcing only create durable logistics value when they govern the messy edge of the network — the terminal, the store, the rural delivery route, the importer record, the production cell, and the freight-density decision.
- Port automation became terminal execution software. Adani Ports' Kaleris deployment showed AI moving into berth, yard, gate, drayage, and exception workflows across 15 terminals, not just crane or equipment automation.
- AI infrastructure became a logistics constraint. Dell and HPE memory pressure turned DRAM/HBM allocation, supplier promises, and premium freight decisions into customer-delivery risk for server supply chains.
- Importer identity became a daily control. New enforcement pressure makes importer-of-record data, bond coverage, beneficial ownership, POA governance, and audit trails operational controls rather than customs-department paperwork.
- Food-cost transparency became logistics data. EU farm-cost rules point toward product-level transport, cold-chain, storage, handling, and waste-cost evidence that logistics teams will need to produce quickly.
- Store-level AI still needs execution judgment. Grocery Outlet's 550-store Afresh rollout and Tractor Supply's rural routing push showed AI works best when it supports local assortment, perishability, density, and route decisions instead of pretending every node behaves the same.
- Infrastructure funding became corridor planning. The $580B highway bill matters operationally because bridge work, truck parking, closures, drayage access, and EV fees change reliability before they change headline capacity.
- Robotics still depends on physical flow. Industrial robot rebound is tied to AI factories, but missing parts, maintenance kits, packaging fit, and inbound milestone failures can idle expensive automation just as fast as bad code.
- Simplification beat tool sprawl. Kimberly-Clark's productivity program reinforced that density, value-stream cleanup, network design, and automation discipline can outperform another disconnected software layer.
- SCaaS sharpened the build-versus-buy question. Lower cloud implementation costs and a $71.5B SCaaS market make platform outsourcing more attractive, but provider consolidation raises continuity, pricing, and roadmap risk.
New Insights from June 18, 2026 Posts
June 18's posts made adaptability the retrospective's newest operating theme. The core lesson: volatility is no longer something logistics teams manage after a disruption appears. It has to be interpreted inside the system of record, with proof, scenario options, and execution ownership ready before the plan breaks.
- AI-over-legacy became the pragmatic TMS path. Intelligent layers are winning because they can add prediction, exception handling, and workflow guidance without forcing every shipper to replace entrenched transportation systems at once.
- Medical-device distribution moved closer to manufacturing. Boston Scientific's Indiana DC showed regulated logistics depends on proximity, traceability, quality records, and service execution as much as square footage.
- Forced-labor evidence became import readiness. Canada's watchdog shift did not lower risk; it raised the value of origin records, supplier evidence, product classification, and shipment-level documentation before enforcement changes land.
- Gulf Coast optionality became strategic capacity. DP World's Corpus Christi bid showed shippers need port alternatives that can absorb Texas and Gulf demand when Houston, rail, weather, or geopolitical conditions tighten.
- Port imbalance became a peak-season planning signal. Los Angeles imports rising 26% while exports fell 10% exposed empty-equipment, drayage, yard, and inland-flow risks that need earlier scenario planning.
- Adaptability became the KPI. CSCMP's $2.4T logistics-cost benchmark reinforced that static annual freight plans are too brittle for a market shaped by tariffs, labor risk, fuel swings, and modal divergence.
- Labor trust became automation risk. West Coast port negotiations may sit on the 2028 calendar, but automation, terminal ownership, and worker trust already belong in the risk dashboard.
New Insights from June 19, 2026 Posts
June 19's posts moved the retrospective from adaptability into accountable risk ownership. The useful pattern was not another software category. It was a broader management shift: supplier conduct, RFP timing, grocery costs, committed capacity, inventory buffers, circular returns, fuel surcharges, fertilizer timing, manager skill sets, and sanctions ambiguity all now require executable records and named owners.
- Supplier governance became operational evidence. Animal-welfare risk now needs contracts, audit trails, transportation controls, and escalation workflows, not just ESG language.
- AI procurement proved speed can beat data purism. Bristol Myers' RFP compression showed logistics teams can start with centralized, governed data and improve quality through workflow use rather than waiting for a mythical perfect dataset.
- Food inflation exposed upstream logistics constraints. Canada's grocery probe and fertilizer bottleneck coverage connected consumer prices to production, cold chain, rural trucking, rail, storage, and input-timing execution.
- Committed capacity moved beyond spot recovery. BidBoardX-style marketplaces show shippers and carriers want structured lane commitments before route guides fail.
- Planning shifted from buffers to constraints. AstraZeneca's constraint-based planning story reinforced that working capital falls when capacity, materials, demand, and service promises are visible in one planning model.
- Circular logistics became margin protection. EU unsold-goods rules turn returns, grading, repair, resale, donation, recycling, and disposal prevention into measurable inventory workflows.
- Surcharge governance became a live cost control. FedEx's export fuel-table change showed fuel exposure has to be modeled by customer, lane, product, and service level before invoices arrive.
- Logistics leadership became cross-functional control. Salary and responsibility data confirmed the role now spans tech adoption, risk sensing, finance, capital decisions, and real-time disruption response.
- Sanctions risk demanded sense-making. Compliance checklists are too slow when banks, insurers, forwarders, ownership structures, and corridors can change before formal guidance catches up.
New Insights from June 20, 2026 Posts
June 20's posts made the retrospective more physical and more operational. The through-line was execution adaptability: AI, automation, drones, electric trucks, rail plants, air gateways, and brokerage platforms only matter when they help teams make better decisions under real constraints.
- Parcel AI became exception management. UPS's new tools matter less as tracking features than as workflows for prioritizing recoverable exceptions, returns, claims, service promises, and customer communication before avoidable touches multiply.
- AI became a workforce design problem. Gartner's Top 25 coverage and AI-skills hiring data showed that logistics operators need role clarity, escalation paths, decision rights, and senior operational judgment around automation.
- Cycle counting became continuous inventory control. GNC's drone deployment proved that inventory accuracy is shifting from periodic audit work to always-on confidence for replenishment, ship-rate protection, and order promises.
- Electric drayage became route design. Long Beach's green truck corridor showed that charging assets, appointment discipline, container density, dwell control, and inland staging have to be designed together.
- Packaging plants needed freight optionality built in. International Paper and CPKC showed that rail-served industrial sites should plan raw-material flow, outbound distribution, cross-border reach, and truck backup before production starts.
- Air cargo became corridor-specific. FedEx and China Southern's Guangzhou cooperation reinforced that forwarders need gateway alternatives because spot rates and load factors are diverging sharply by region.
- Brownfield automation became the practical capex story. Walmart's Texas remodel showed that phased upgrades to existing DCs can matter more than headline-grabbing new buildings when the network footprint already works.
- Retail growth became a demand-sensing test. May sales gains were uneven enough that transportation teams need to translate category growth into SKU, labor, node, parcel-zone, LTL, and service-promise exposure quickly.
- Freight brokerage shifted toward reliability metrics. BidBoardX-style committed freight makes the useful question less about quote speed and more about tender acceptance, lane fit, recovery cost, dwell, and awarded-service performance.
- Humanoid robotics needed a harsher buying standard. Automate 2026 will generate hype, but the practical tests are grasping, mobile manipulation, safety zones, WMS/WES integration, exception recovery, and engineering-time reduction.
New Insights from June 21, 2026 Posts
June 21's posts moved the retrospective into measurement discipline. The common thread was simple: teams do not need more passive dashboards. They need triggers that say when a scan is unreliable, when air freight deserves a mode shift, when rail infrastructure changes network design, when a carrier is unsafe for hazmat, when LTL costs are hiding in damage and delay, and when a WMS purchase is solving the wrong problem.
- Barcode scanning became exception intelligence. AI-assisted scanning matters because it can catch unreadable labels, motion blur, glare, and bad handoffs before inventory records, ASNs, receipts, or freight documents drift out of sync.
- Air-freight volatility needed lane-level triggers. A 41% spot-rate jump is not a command to buy premium capacity everywhere; it is a signal to define service-risk thresholds by lane, SKU, customer, and promised date.
- Inland intermodal became network strategy. BNSF's Barstow project showed that long-cycle rail capacity can reshape port-to-DC flows years before the facility is fully online.
- Retail automation depended on sortation discipline. Burlington's Georgia DC proved square footage matters less than conveyor logic, custom software, receiving visibility, and the ability to translate variety into store-ready flow.
- Rail reliability started moving upstream. FRA automated track-inspection testing could make infrastructure health part of shipper service expectations rather than something discovered after delays hit.
- Hazmat compliance became carrier-management evidence. Language, endorsement, placard, shipping-paper, and emergency-response failures need to be caught during qualification and tendering, not at roadside after an incident.
- LTL scorecards got more honest. Damage, density, delay, accessorial leakage, reweighs, reclasses, appointment failures, and claims now belong beside rate per hundredweight.
- Cass data sharpened the cost-per-shipment problem. Mild shipment recovery does not fix budgets when expenditures rise faster than volume; transportation teams need owners for charge mix and preventable exception cost.
- WMS buying had to start with workaround maps. The right selection process begins with manual exceptions, integration risks, user adoption, and transportation impacts before vendor demos create feature fog.
New Insights from June 22, 2026 Posts
June 22's posts added a trust-and-fallback layer to the retrospective. The issue was not whether logistics systems can move faster; it was whether the data, people, vendors, carriers, and contingency paths are strong enough to let faster decisions operate safely.
- Truckload demand signals needed accepted-volume context. Tendered volume, accepted freight, spot rates, and paid-invoice data now have to be read together before procurement teams reset routing guides or declare a market inflection.
- AI controls became operational safety equipment. Hallucination risk is now a logistics governance issue: source grounding, confidence thresholds, human approval, and audit trails have to sit inside procurement, compliance, and customer workflows.
- Autonomous freight required fallback design. Middle-mile autonomy works best where lane geometry, payload, dock timing, calendar discipline, remote oversight, and conventional-carrier recovery are designed before launch.
- Driver training became network infrastructure. CDL hubs near terminals are not just HR programs; they shape labor availability, dispatch resilience, safety culture, and regional capacity reliability.
- Safety sensors became carrier-scorecard evidence. Cameras, braking systems, lane-departure alerts, and maintenance signals are moving into carrier qualification, claims defense, routing-guide design, and insurance conversations.
- Tech-budget pressure sharpened vendor-risk review. Logistics teams need to connect layoffs, roadmap credibility, support depth, integration ownership, and operational dependency before renewing or expanding software relationships.
- Regional 3PL acquisitions reinforced optionality. Warehouse density, labor pools, port proximity, carrier access, and recovery capacity are becoming practical resilience assets, not just footprint expansion.
- Hormuz exposure became surcharge governance. Energy and maritime-security disruption need contract triggers, cost-code separation, customer pass-through rules, and lane-specific alternatives before fees hit invoices.
- Data silos became an AI blocker. Fragmented shipment, inventory, carrier, safety, customs, and finance records limit automation more than model quality; consolidation is now a prerequisite for trusted execution.
- Carrier qualification became legal infrastructure. Nuclear-verdict exposure and subcontracting failures make safety evidence, insurance, hours-of-service controls, and tender restrictions part of defensible transportation management.
New Insights from June 24, 2026 Posts
June 24's posts pushed the retrospective from proof-at-the-edge into governed optionality. The new coverage was less about adding another technology category and more about proving that backup providers, alternate corridors, compliance packets, inventory buffers, and routing choices are real before the network needs them.
- 3PL procurement became segment-specific. Armstrong data showed the U.S. 3PL rebound is real but uneven: brokerage, international forwarding, dedicated carriage, and value-added warehousing now need different scorecards, risk triggers, and operating metrics.
- M&A turned scarce nodes into shipper risk. PwC's deal-size data showed buyers paying premiums for cold chain, healthcare, reverse logistics, dedicated fleets, port access, cross-border infrastructure, automation, and AI-enabled visibility — the exact control points shippers cannot casually replace.
- Supplier economics became logistics evidence. Apparel T-shirt pricing, Bangladesh wage pressure, and forced-labor enforcement showed that low unit cost can be an early warning for missed milestones, subcontracting opacity, weak documents, and premium freight.
- Policy and infrastructure risk moved into live routing. Germany's pharma pricing probe and rail IT outage showed that trade policy and telecom resilience now belong inside lane maps, broker instructions, cold-chain contingency plans, customer communication, and mode-switch triggers.
- Demand and corridor optionality need pre-modeled triggers. ISM's expansion forecast, manufacturers' inflation-era investment, and Mexico's Interoceanic Corridor pilots all made the same point: growth, inventory placement, and alternate routes only help if the execution system already knows when to activate them.
New Insights from June 25, 2026 Posts
June 25's posts added an execution-accountability layer to the retrospective. The strongest new signal was not a single technology category. It was the widening definition of what logistics systems must prove: aircraft availability, temperature custody, WMS launch readiness, carrier compliance, chemical chain of custody, vendor access controls, pallet identity, delivery-promise economics, sourcing impact, and ocean recovery timing.
- Maintenance data became an air-capacity signal. The A380 inspection order showed that freight planners need aircraft-type exposure, belly-cargo dependence, alternate gateways, and time-critical shipment rules before maintenance advisories turn into missed uplift.
- Cold chain moved from capacity to accountability. UPS's 27 temperature-controlled cross-docks and FedEx's healthcare growth reinforced that pharma logistics now competes on handoff control, intervention speed, temperature proof, and custody evidence rather than refrigerated space alone.
- WMS cutovers became revenue events. Lands' End showed that a one-week backlog can show up in ecommerce revenue, which means WMS go-lives need transportation buffers, backlog triggers, carrier appointment plans, and finance-aware premium-freight rules.
- Compliance preparation became capacity planning. Roadcheck data showed announced inspection windows can improve behavior but also reduce available small-carrier capacity, making safety records, tender timing, maintenance readiness, and critical-lane exposure part of operating calendars.
- Chemical logistics became environmental evidence. The Chemours PFAS settlement made clear that regulated chemical movement needs connected records across sites, containers, storage, carrier handoffs, waste profiles, sampling, treatment, and exception closure.
- Vendor vetting needed proof over forms. AI-filled questionnaires are not enough when logistics vendors touch TMS, WMS, payment, visibility, and customer data; access tiering, SOC evidence, least privilege, and recovery testing now belong in freight-continuity planning.
- Pallets became automation infrastructure. Pallet quality, RFID, reusable pooling, plastic-pallet life cycles, and pallet-level recovery records now affect automation uptime, claims, food/pharma traceability, and transportation exception management.
- Free-delivery math became promise governance. The 2.7-day expectation and rising home-delivery cost base showed retailers need segmented promise logic, carrier portfolios, order thresholds, address quality, and AI ETA controls rather than blanket speed promises.
- Procurement and supply chain converged into one control loop. Kraft Heinz and Kroger showed sourcing, tariff exposure, fulfillment design, freight cost, supplier reliability, inventory placement, and margin now have to be optimized together.
- Ocean recovery moved in network weeks. Hormuz coverage showed that reopening headlines do not restore container networks immediately; shippers need surcharge visibility, selective booking buffers, transshipment tradeoffs, and weekly forecast updates until vessel rotations normalize.
New Insights from June 26, 2026 Posts
June 26's posts added a cost-and-control layer to the retrospective. The day's coverage connected money, law, buildings, docks, and supplier handoffs into the same operating lesson: logistics systems now have to understand the financial and physical constraints around a shipment before the shipment is created.
- First-mile retail freight became a supplier scorecard. Walmart's Prepaid Consolidation Program showed that PO structure, case accuracy, pallet readiness, appointment timing, SKU visibility, provider coordination, and price-per-case economics now define supplier performance before freight reaches the regional network.
- LTL repricing exposed mode-mix discipline. ABF's 5.9% rate increase, heavier asset-based tonnage, and rising LTL PPI showed that shippers need density, dimensions, accessorials, freight class, claims risk, and customer promise data before shifting freight between truckload, LTL, and parcel.
- Detention became auditable evidence. Edge AI, geofencing, dock timestamps, and threshold alerts turned driver waiting time into a managed cost line that can be billed, disputed, recovered, and fixed at the facility level.
- Carrier vetting became legal infrastructure. The broker liability ruling made historical carrier qualification evidence, insurance, safety signals, tender rationale, and exception approval part of defensible freight operations rather than routine onboarding paperwork.
- Parcel robotics moved upstream to the inbound trailer. FedEx's Scoop plans showed that automation value increasingly starts at the dock door, where unload pace, door readiness, induction timing, equipment status, and detention exposure determine network flow.
- Interest rates entered the freight planning model. Inflation and capital-cost pressure made inventory buffers, warehouse commitments, supplier terms, expedited freight, and mode selection finance-linked supply chain decisions.
- Importer identity became shipment visibility. New importer-of-record restrictions pushed ownership disclosure, broker due diligence, entry type, bond status, and document completeness into transportation workflows before freight moves.
- Warehouse rent became a network trigger. Prologis rent and vacancy data showed that lease decisions need to be tested against drayage, parcel zones, labor, service variance, returns flow, and transportation cost per order.
- Long-lead project logistics moved before construction. Nuclear supply chain funding showed that heavy components, supplier milestones, route surveys, permits, staging, inspection hold points, and site readiness must be governed years before oversized cargo ships.
- Retail contracts became governed optionality. Burlington and Dollar Tree showed that resilience now comes from combining contracted capacity, DC placement, cube utilization, import timing, route optimization, and controlled spot exposure rather than chasing the lowest weekly rate.
New Insights from June 27, 2026 Posts
June 27's posts added a data-readiness layer to the retrospective. The day's coverage connected customs AI, tariff refunds, parcel dimensions, apparel environmental taxes, vertical LTL, freight distress, port-capacity pauses, quantum computing, inventory reductions, and trade imbalance into one practical rule: logistics technology now has to prove the quality of the data behind the move before automation, compliance, finance, or network optionality can work.
- Customs data became enforcement-facing. CBP's AI expansion and refund-scale workflows showed that commercial invoices, HTS evidence, supplier identity, origin logic, broker tasks, and audit trails need to be ready before cargo moves.
- Parcel dimensions became a July cost-control deadline. USPS divisor, rounding, reporting, sub-pound, and noncompliance changes turned package cube into a WMS, manifest, rate-shopping, and invoice-audit control point.
- Product attributes became logistics data. Fashion environmental taxes and textile circularity rules pushed material composition, packaging, repairability, resale eligibility, and disposal restrictions into shipment execution.
- LTL service design became vertical. FedEx Freight's revenue mix showed carriers are optimizing around higher-margin healthcare, grocery, technology, and data-center freight, which means shipper scorecards need to segment service by commodity, promise, claims, accessorials, and exception recovery.
- Vendor distress became an early-warning signal. Trucking bankruptcies, warehouse WARN notices, cold-storage filings, tender drift, dwell, claims, invoice disputes, and response delays now belong in one provider-risk layer.
- Port capacity became dynamic. South Carolina's Leatherman pause showed that gateway planning has to model terminal availability, drayage appointments, chassis, rail timing, and empty-container flow even without a classic congestion crisis.
- Trade data became a freight trigger. The widening U.S. goods deficit, rising capital-goods imports, weaker exports, and inventory growth gave planners a macro signal for inbound receiving, equipment balance, warehouse labor, and contract timing.
- SKU cuts needed transportation discipline. Duluth's inventory reduction showed that cleaner assortments only protect service when receipt calendars, DC throughput, carrier capacity, consolidation, and replenishment are governed together.
- Quantum moved into constraint mapping. The practical value today is not near-term TMS replacement; it is identifying which routing, maintenance, inventory, and network problems are dense enough to require cleaner constraints and better data architecture now.
New Insights from June 28, 2026 Posts
June 28's posts added a data-governance and liability layer to the retrospective. The day's coverage connected insurance, tax recovery, personal export-control exposure, biometric consent, paperless enforcement, supplier cost programs, commodity timing, container interoperability, AI infrastructure power projects, and marketplace sanctions risk into one operating lesson: logistics data now has to be usable by people outside the transportation department before the shipment is considered controlled.
- ELD data became insurance infrastructure. Progressive's Smart Haul requirement showed that ELD provider choice, telematics fields, safety evidence, renewal timing, and carrier profile management can now affect whether a fleet can even qualify for coverage.
- Reefer fuel became recoverable evidence. Prime's $11 million IRS lawsuit showed refrigerated freight needs clean separation between propulsion fuel, reefer fuel, trip purpose, equipment assignment, invoice detail, temperature record, and tax-recovery ownership.
- Export controls became personal-risk workflows. The freight forwarding sentencing story made denied-party screening, commodity classification, destination checks, escalation notes, and approval history part of staff-protection infrastructure.
- Driver data consent became a logistics control. The ULH biometrics class-action expansion showed that gate access, dashcams, timekeeping, telematics, and safety-coaching tools need consent, retention, vendor-access, and jurisdiction rules built into operating systems.
- Paperless enforcement raised the recordkeeping standard. FMCSA's less-paper push means driver qualification files, roadside documents, insurance, authority status, inspection data, and ELD records need to be audit-ready before an enforcement request arrives.
- Supplier cost optimization moved into flow control. Kroger's supplier work showed that cost reduction depends on order cadence, consolidation, inbound appointments, packaging quality, dwell control, and freight attribution, not just better buying.
- Commodity relief still needed logistics translation. J.M. Smucker's green coffee price relief reinforced that lower input costs only become margin or customer-price changes when purchase timing, inventory valuation, freight commitments, and landed-cost assumptions line up.
- Container visibility became a standards test. DNV joining the DCSA+ data exchange showed that ocean freight interoperability now depends on shared event definitions, document data, emissions records, carrier APIs, and cross-party exception handoffs.
- AI infrastructure created heavy-equipment logistics demand. Chevron's Microsoft data-center power deal showed that AI growth is also a turbine, transformer, crane, permit, route-survey, and construction-sequencing problem.
- Marketplace fulfillment became sanctions-aware. Alibaba's blacklist fight showed that ecommerce logistics teams need restricted-party screening, seller evidence, product-origin checks, route holds, and compliance exception review before platform exposure becomes shipment risk.
New Insights from July 1-12, 2026 Posts
The July 1-12 posts made the retrospective more specific and more unforgiving. The new theme is execution evidence: routing guides, carbon claims, parcel allocation, warehouse exceptions, frontline tasks, tariff dates, battery chemistry, quality events, and AI infrastructure milestones all have to become structured records before software can make reliable decisions.
- Routing guides became live stress tests. Dry van spot pressure showed that primary acceptance, tender depth, backup carrier response, spot exposure, dwell, appointment constraints, and budget triggers need to be reviewed before the invoice proves the guide has cracked.
- Contract logistics consolidation raised data-dependency risk. CMA CGM's $1.4B FedEx Supply Chain deal reinforced that bundled warehouse, air, ocean, fulfillment, and returns networks can help shippers, but only when the shipper keeps an independent execution record.
- Carbon validation moved from ESG reporting into shipment evidence. EcoVadis data showed buyers are deploying AI faster than suppliers can provide granular carbon records, which means freight systems need source, supplier, emissions, route, and audit evidence in one workflow.
- China-origin parcel disruption forced fulfillment trigger models. The roughly 85% decline in China-origin parcel air cargo after de minimis changes made direct parcel, bonded storage, cross-dock flow, and domestic fulfillment portfolio choices rather than one default model.
- Electric fleets became energy-constrained dispatch systems. Charging windows, demand charges, battery health, grid constraints, route variability, payload, weather, and customer promises now belong in transportation execution, not sustainability side files.
- Rail ramp choice became service design. Maersk's Southern California rail shift showed that port pair, rail ramp, dray market, demurrage clock, receiver priority, and peak-season surcharge logic determine the actual product a shipper receives.
- Cross-border brokerage moved closer to transportation control. Ruan's customs brokerage expansion, Mexico theft risk, HOS exemption requests, and forced-labor public records all pointed to one pattern: documents, driver rules, route risk, carrier identity, and release status have to sit near dispatch.
- Warehouse readiness became a launch and exception-taxonomy problem. Site readiness, WMS/WES exception language, connected lift-truck batteries, intralogistics M&A, robotics task evidence, and warehouse associate role design all showed automation depends on structured physical-work records.
- Specialized logistics needed commodity-level proof. Class 9 battery freight, life-sciences quality events, outage-critical utility freight, aerospace compliance calendars, and capital goods imports require chemistry, condition, custody, quality status, part criticality, permits, staging, and milestone records before capacity is useful.
- Frontline worker tech became the control layer. Transportation and logistics is forecast as the fastest-growing North American frontline worker technology segment because dock checks, safety tasks, exception photos, handoffs, and worker confirmations are now part of the freight record.
- Tariff and refund workflows needed effective-date ledgers. McCormick's $28M refund, Reuters tariff pass-through reporting, and June container frontloading showed finance, customs, sales, and logistics need shipment-level dates instead of monthly averages.
- Regional optionality got more formal. India value-added warehousing, MEA maritime growth, Hawaii island resilience, and DHL-USPS parcel allocation all showed that resilience is increasingly a designed portfolio of nodes, modes, partners, and trigger rules.
- AI infrastructure became a physical supply chain story. Deloitte, McKinsey, and Reuters coverage tied AI growth to chips, power gear, land, buildings, transformers, long-lead industrial equipment, export controls, and site sequencing. The data center boom is now a project logistics and critical-freight planning problem.
New Insights from July 13, 2026 Posts
July 13 added a closed-loop execution layer to the retrospective. The day's coverage connected freight fraud, plant launches, fuel exposure, customs promises, services growth, furniture distribution, shipment verification, warehouse exits, and supply chain AI into one practical lesson: technology only matters when the operating record proves what happened after the recommendation.
- Carrier onboarding became a live control. AI-enabled freight fraud and strategic cargo theft showed that authority checks, insurance, pickup identity, driver match, tender history, route behavior, and geofence exceptions have to stay active after onboarding.
- Automotive launch readiness moved upstream. Toyota's $3.6 billion San Antonio expansion showed that plant launches need inbound capacity, supplier sequencing, returnable packaging, yard flow, rail options, labor timing, and dealer replenishment planned before first production.
- Contract freight became a fuel-cost hedge. Lovesac's cargo partnerships and high-energy-price pressure showed bulky retailers need lane-level fuel tables, effective dates, surcharge formulas, tender acceptance, accessorial audit, and rerate triggers before energy volatility hits margin.
- Cross-border ecommerce promises became customs-first. A market growing toward $26.15 billion still punishes loose delivery promises when entry type, HTS confidence, duty exposure, carrier handoff, bonded inventory, and release status are not connected.
- Energy prices turned freight demand into a margin test. Fuel supply-crunch signals and high transportation price readings showed volume alone is a weak planning metric unless systems connect fuel lag, customer terms, mode options, service failures, and contribution margin.
- Furniture network savings needed SKU-level proof. La-Z-Boy's consolidation plan showed that square-foot and mileage savings only hold when damage, appointment compliance, cube, handling time, return rates, and final-mile accessorials are measured by product and lane.
- Item-level verification became ASN discipline. RFID-supported accuracy gains showed that shipment notices need item, carton, PO, order, lot, carrier, seal, exception, and receiving proof before inventory data can support faster fulfillment.
- Services growth complicated freight planning. The 24th straight month of services expansion reinforced that service parts, repair loops, warranty returns, field inventory, technician windows, and emergency transportation create demand that standard forecast cycles miss.
- Supply chain AI needed execution feedback. Scotts Miracle-Gro's AI partnership made the key point: forecasts only improve operations when recommendations are checked against order release, warehouse readiness, carrier capacity, delivery performance, inventory position, and margin.
- Warehouse closures became network-risk events. Levi Strauss' delayed transition showed closures need cutover calendars, open-order rules, inventory transfer records, carrier commitments, customer communication, exception owners, and invoice cleanup before the lease ends.
New Insights from July 14, 2026 Posts
July 14 added a granular-capacity layer to the retrospective. The day's coverage showed that 2026's technology story is increasingly about turning physical constraints into live decision records: aircraft uplift, package format, bridge choice, water depth, driver depth, warehouse dock slots, high-altitude securement, truckload rate pressure, and inventory restocking all need trigger logic before the exception becomes visible to the customer.
- AI hardware changed the premium-air allocation model. Semiconductor demand can represent less than 10% of air cargo volume and still set marginal capacity prices on Transpacific lanes, which means shippers need SKU priority, rate ceilings, and customer-penalty rules before recovery freight competes with AI infrastructure freight.
- Packaging flexibility became a logistics constraint. General Mills' $3B savings program showed that package versions, channel formats, pallet patterns, cube, storage, automation fit, and transportation outcomes have to be governed together.
- Border capacity became a structured routing variable. The Gordie Howe Bridge adds redundancy to a corridor where the Ambassador Bridge handles about 40,000 daily crossings and $323M in daily goods, but that optionality only matters if carrier eligibility, broker readiness, crossing time, and customer promises are represented in the routing file.
- Damage prevention moved to lane-level securement rules. High-altitude routes and LTL handling exposed why product crush profiles, dunnage standards, carrier instructions, claim history, and elevation risk need to travel with the shipment plan.
- Inventory restocking collided with tight capacity. June's 71.1 LMI reading, transportation prices at 92.4, warehouse capacity at 47.5, and transportation capacity at 30.8 showed that inventory decisions now need live storage, dock, lane, and carrier checks.
- Mexico capacity became a workforce file. A 14% driver vacancy rate, 90,000 idle trucks, and 92.44% road share for U.S.-Mexico cross-border freight turned driver depth, bilingual dispatch, border dwell, and recovery history into core carrier-scorecard fields.
- Inland waterway risk needed gauge-based triggers. Rhine low-water risk showed that load factors, low-water surcharges, rail fallback, truck backup, emissions impact, and customer ETA changes need threshold rules before barges sail partly loaded.
- Truckload pricing power required active rate governance. Rates up roughly 45% YoY, forecast 2027 contract increases of 17%, spot-rate forecasts up 35%, and capacity reductions from enforcement all showed annual procurement cycles are too slow for a capacity-driven recovery.
- Warehouse robotics moved the bottleneck to outbound flow. Exotec's $335M round, fivefold picking-speed claims, and Decathlon's 55-Skypod rollout showed that faster goods-to-person automation needs dock slots, trailer capacity, carrier cutoffs, and outbound wave planning in the same execution model.
New Insights from July 15, 2026 Posts
July 15 added a decision-governance layer to the retrospective. The day's coverage showed that logistics technology is being judged less by whether it can produce a recommendation and more by whether it can prove the operating evidence behind that recommendation: tariff dates, import motives, intermodal conversion thresholds, project-cargo deadlines, component origin, roadway access, 3PL event ownership, last-mile promise economics, and AI guardrails all need auditable decision records.
- Tariff calendars became import-planning infrastructure. Ocean booking spikes are not self-explanatory; teams need departure dates, arrival dates, tariff effective dates, HTS exposure, broker readiness, inventory motive, and rate validity before frontloading becomes an expensive reflex.
- Intermodal planning needed an earlier trigger. IANA's 106.8 July IVI estimate and 4.4% May volume growth showed rail conversion should be evaluated before truckload rates force the issue.
- Project cargo became a policy-deadline workflow. Renewable safe-harbor timing, FEOC uncertainty, heavy-haul permits, component origin, site readiness, and commissioning windows now have to live in one project logistics control file.
- Electrical component proof became receiving evidence. Section 232 tariff pressure, domestic content rules, critical-mineral exposure, and storage buildouts showed infrastructure freight needs origin and exemption status attached before delivery.
- Port access moved from map data to operating data. Savannah's $126M Brampton Road Connector showed drayage planning has to account for roadway design, rail crossings, appointment buffers, driver instructions, and shared 3PL assumptions.
- End-to-end 3PL scope required event-level accountability. The Strauss-DHL deal showed broad outsourcing only scales when order, personalization, inventory, pick, pack, tender, POD, billing, and exception events are visible in one file.
- Last-mile promises moved back into network economics. With last mile reaching as much as 54% of delivery cost, delivery speed promises need order margin, address confidence, density, carrier fit, failure cost, and customer penalty logic.
- System trust moved beyond uptime. Gartner's decision-governance theme made the point cleanly: EDI reliability matters, but autonomous logistics workflows also need decision logs, confidence thresholds, override reasons, and feedback loops.
- Technology buyers asked for orchestration proof. The useful software-selection question became whether a platform can connect TMS, WMS, AI, robotics, audit, parcel, and compliance actions into daily execution evidence.
New Insights from July 16, 2026 Posts
July 16 added a peak-pressure layer to the retrospective. The day's coverage showed that rates, fulfillment fees, tariffs, provenance rules, cross-border parcel data, air cargo capacity, warehouse automation, and public trend noise are all pushing logistics teams toward the same operating requirement: every important cost, compliance, and service decision needs a current record with an owner and a trigger.
- Rate highs made accessorial discipline a planning requirement. TL and LTL indexes hit fresh highs, LTL rate-per-pound reached 76.5% above the 2018 baseline, and fuel surcharges were more than 60% above June 2025 levels, making invoice audit and shipment-level cost records part of Q3 planning.
- Mid-sized shippers lost budget slack. Rates up roughly 45% YoY, 2027 contract forecasts up 17%, and spot forecasts up 35% showed that smaller procurement teams need tender-depth, backup-carrier, fuel, and accessorial triggers before routing guides fail.
- Air cargo became governed optionality, not just expedite spend. DHL's 100-ton Boeing 777 Transpacific service showed that high-value and oversized freight needs pre-approved air fallback rules tied to ocean risk, customer penalties, and handling limits.
- Cross-border ecommerce shifted from speed to data quality. A $17.55B U.S. market in 2026, 8.30% CAGR, and China-to-U.S. capacity exposure above 50% showed that item data, landed cost, returns, and customs proof now drive delivery reliability.
- Holiday fulfillment fees became a margin model. Amazon's Oct. 15-Jan. 14 peak fees, average $0.32 per unit increase, and 3.5% fuel surcharge showed sellers need inventory timing and fee exposure modeled before promotions lock.
- Product provenance became shipment-level operating data. Gartner's provenance trend reinforced that origin, certification, chain-of-custody, claim, and sustainability evidence has to travel with freight instead of sitting in compliance archives.
- Smart conveyors moved downtime into freight planning. A $6.1B-to-$27.8B smart conveyor market forecast showed automated warehouses need downtime reason codes, maintenance response, WMS/WES state, dock schedules, and carrier cutoffs in one flow record.
- Sanctions and tariff uncertainty became routing scenarios. The revised Russia sanctions bill, moving from a possible 500% tariff concept to a maximum 100% tariff on top energy purchasers, showed that supplier geography belongs in freight planning.
- Auto port choice became distribution design. Mitsubishi's Port Freeport move proved RoRo port selection should be measured through vehicle processing, storage, rail/truck access, dealer distance, and dwell performance.
- Trend chatter needed operating filters. RFID, helium supply, humanoid robots, reverse logistics, and AI-provider growth are useful signals only when teams assign each one to the right owner, data check, and decision workflow.
New Insights from July 17, 2026 Posts
July 17 added the handoff-governance layer to the retrospective. The day's coverage showed that 2026's logistics technology story is no longer just about more visibility, automation, or outsourcing. It is about whether each partner, alert, shipment, facility, vendor, lane, and critical material has a named owner, a threshold for action, a fallback path, and an audit record before volatility reaches the customer.
- 4PL growth became an accountability test. A market projected to grow from more than $86.2B to over $163.7B by 2035 showed shippers are buying outcome ownership, but outsourced orchestration only works when scope, mode control, decision rights, savings baselines, KPI definitions, and exception accountability are explicit.
- Rail consolidation turned strategy into evidence. The proposed UP-NS merger review, with an $85B transaction, 52,215 route miles, 43 states, roughly 100 ports, and $2.75B in expected annual synergies, showed rail optionality must be mapped by lane, interchange, terminal, drayage, fallback mode, and emissions assumption before filings become service changes.
- Fleet emissions data moved into carrier qualification. Diesel-enforcement uncertainty did not erase shipper risk; it made equipment type, onboard diagnostics status, maintenance signals, inspection history, state exposure, customer sustainability requirements, and tender eligibility part of the carrier evidence file.
- Border-aware fulfillment became a node-design rule. Lululemon's Brampton DC and AutoStore deployment showed North American retail networks need allocation logic that sees SKU velocity, duty exposure, parcel zones, store impact, customs data, return paths, and customer promise before an order crosses a border.
- Execution technology needed handoff rules before more pilots. Robotics, IoT, digital twins, blockchain, agentic AI, edge computing, and 5G only created value when teams defined the system of record, trigger event, owner, allowed automation, override path, audit log, and performance metric.
- Third-party cyber risk became logistics continuity work. With 65% of large companies ranking third-party and supply-chain vulnerabilities as their greatest cybersecurity challenge, logistics teams need vendor criticality, connected-system maps, fallback processes, recovery SLAs, affected-customer views, and manual release authority for bookings, EDI, labels, documents, customs, and POD flows.
- Order cycle time exposed broken handoffs. The useful version of the KPI split order receipt, allocation, pick start, shipment-ready, tender, pickup, transit, delivery, proof, exception, and customer-notification timestamps so operations can see who owns delay before a late order becomes a postmortem.
- Manufacturing labor gaps became freight-readiness risk. The 354,000 unfilled durable-goods manufacturing openings in May showed staffing pressure can surface as late releases, weak ASNs, dock misses, item-verification shortcuts, packaging exceptions, and avoidable expedite spend.
- Construction logistics needed material risk registers. Tariffs of 25%-30% on construction goods, steel and aluminum tariffs up to 50%, and an 88.2% YoY increase in project abandonment activity showed critical-path materials need supplier geography, permits, site constraints, substitution rules, delay cost, and escalation owners before the jobsite loses time.
- Always-on supply chains needed exception ownership. The finding that 67% of companies started transformations but only 10% hit their top three strategic targets reinforced the core operating lesson: more signals help only when each exception has severity, deadline, owner, allowed action, customer impact, cost exposure, and closed-loop learning.
New Insights from July 18, 2026 Posts
July 18 added the control-file layer to the retrospective. The day's coverage showed that logistics teams are no longer managing volatility only through dashboards or quarterly planning. They need live operating files that connect the volatile input, source evidence, owner, threshold, customer impact, and recovery path before a shipment, order, facility, or partner dependency breaks.
- Semiconductor ramp logistics became input governance. Bosch's $225M U.S. semiconductor milestone showed sample production depends on cleanroom supplies, specialty gases, calibration parts, inspection steps, export controls, and high-value freight moving as one controlled system.
- Packaging commodity volatility became transportation planning data. Steel and aluminum tariffs rising from 25% to 50%, U.S. dependence on imported tinplate, and resin price jumps showed package format, cube utilization, pallet design, and supplier exposure now belong inside freight planning.
- ERP cutovers became fulfillment risk events. Levi's decade-long move from nine ERPs toward one standardized cloud ERP showed data migrations need item, inventory, allocation, order, carrier, returns, and exception controls before they touch customer promises.
- Food acquisitions needed first-90-day logistics playbooks. Marzetti-CSC coverage showed brand integration should preserve SKU, lot, allergen, temperature, customer, carrier, and recall evidence before organizational handoffs blur accountability.
- Inventory timing tightened the replenishment clock. May inventories rose only 0.3% while sales accelerated, making supplier lead time, inbound appointment risk, dock capacity, and expedite thresholds more useful than broad inventory comfort.
- Tariff refunds did not solve landed-cost governance. Helen of Troy's $9.2M expected refund, $1.8M secured, and $71M still outside phase one showed refunds only matter when tied to shipment costs, duties, accessorials, currency, SKU margin, and finance ownership.
- Sustainability reporting needed shipment-level evidence. PepsiCo's sustainable sourcing progress and delayed climate reporting showed Scope 3 freight data needs carrier, mode, supplier, origin, fuel, and methodology controls while freight is still fresh.
- Supplier compliance became a release gate. Renfro's AI compliance expansion showed supplier approval, origin proof, traceability, labeling, release timestamp, and exception ownership should travel with shipment readiness, not sit in a separate portal.
- Singapore optionality became control-tower work. A $6.02B Singapore 3PL market and 37% China-to-U.S. West Coast spot-rate pressure showed hub decisions need feeder-lane, inventory, customs, alternate-hub, and recovery-cost logic before congestion spreads.
- Postal middle-mile risk needed scenario rules. USPS' $10B+ UPS air contract, 24.1% Priority Mail volume decline, and First-Class Mail air shift from 2% to 50% showed parcel teams need air-vs-ground assumptions, induction cutoffs, fallback nodes, and delivery-promise thresholds.
New Insights from July 19, 2026 Posts
July 19 added the live-trigger layer to the retrospective. The day's coverage showed that the next logistics technology advantage is not just faster automation or richer dashboards. It is the ability to connect market signals, facility constraints, project milestones, procurement interactions, and compliance evidence to a specific action owner before an exception turns into customer risk.
- AI server infrastructure became a freight planning constraint. Semiconductor revenue above $1.3T, hyperscaler infrastructure spend up more than 50%, and high-purity helium concentration around Qatar showed AI racks need custody rules, cooling and power dependencies, site-readiness checks, and commissioning milestones in the freight record.
- Infrastructure acceleration turned project cargo into priority freight. China's state-backed project push, a $487.62B global project logistics market, and China's $9.14B project logistics market showed critical-path materials need milestone, material-class, long-lead, permit, and priority-owner controls before public schedules compress.
- Cold-storage energy moved to load-level accountability. The Top 25 temperature-controlled providers' 7.76B cubic feet of space and a $97.13B U.S. cold-chain market made appointment discipline, reefer status, door dwell, and temperature-band exceptions part of cost governance.
- Elevated rates needed a cost calendar. TD Cowen/AFS rate signals, $2.4T in U.S. logistics costs, and trade-policy shifts averaging every 1.5 weeks showed finance and operations need lane-level effective dates, index periods, accessorial exposure, and customer pass-through rules.
- Automation buyers had to assess vendor support capacity. Exotec's 25,000-square-meter headquarters, 700+ employees, 11 operational systems, and Komar's expected 50% throughput lift showed warehouse automation decisions now depend on support depth, validation capacity, software cadence, and outbound transportation readiness.
- Logistics tech teams needed handoff discipline. DHL's 2,000-associate technology organization and the MHI/Deloitte AI disruption signal showed robotics, WMS, IoT, AI, blockchain, and edge workflows only scale when the system of record, owner, override path, and audit trail are explicit.
- Ocean procurement moved away from annual assumptions. More than 1M June TEUs at Los Angeles, Hormuz premiums 33x normal, and fuel-risk pressure showed ocean bid windows need rolling carrier commitments, volume bands, surcharge triggers, and chokepoint contingency rules.
- Stronger indexes became exception triggers. June LMI rising to 71.1, the first 70+ reading since March 2022, showed macro strength should convert into dock utilization thresholds, ETA variance rules, tender-depth checks, inventory-to-sales controls, and warehouse dwell triggers.
- Trade fraud made origin proof a release control. DOJ recoveries crossing $1B, including a $549.5M settlement and 563 jewelry shipments worth $693M, showed supplier identity, HTS rationale, origin basis, valuation support, broker status, and release approval need to sit with the shipment.
- Voice load search compressed procurement cycles. Truckstop.com's AVA, Envoy AI's autonomous freight workflow, and Gartner's $234B agentic software exposure forecast showed carrier availability is becoming live operating data across tenders, rate counters, compliance checks, bookings, and performance feedback.
New Insights from July 20, 2026 Posts
July 20 added the outcome-proof layer to the retrospective. The day's coverage showed that the market is asking harder questions of every logistics technology, operating promise, fuel choice, and infrastructure program: what proof exists, who owns it, what threshold changes the plan, and how does the record survive when a customer, carrier, regulator, or AI agent asks for the answer?
- AI software value moved from seats to proof files. Gartner's $234B agentic AI spend-risk signal showed logistics buyers will ask renewals to prove tender improvement, faster exception resolution, detention recovery, lower manual invoice review, dock-dwell reduction, and service outcomes rather than just workflow coverage.
- Marine fuel optionality needed lane-level evidence. Brazil's ethanol-powered boxship signal, bunker-method data, and propulsion market growth showed alternative ocean fuels only become useful when fuel pathway, bunkering access, emissions claim, fallback fuel, surcharge handling, and customer allocation are governed by lane.
- Fleet cameras became evidence systems. AI camera coverage showed video has to be tied to consent, retention, coaching, claims, detention disputes, deletion rules, and shipment records before more footage creates operational trust.
- DDMRP turned buffers into freight release rules. Manufacturing buffer signals only helped when they changed supplier release, dock appointment, expedite approval, customs readiness, and customer-commitment decisions before shortages reached shipment time.
- Diesel risk became allocation work. Russia's roughly 12% share of global diesel exports, elevated rate indexes, and oil-and-gas input-cost pressure showed fuel shortage risk needs lane ranking, reefer protection, customer priority, surcharge rules, and carrier acceptance plans.
- Finished vehicles exposed staging as capacity. A $40.29B U.S. finished-vehicle logistics market and faster warehouse/distribution growth showed vehicle processing centers, EV battery handling, yard dwell, dealer priority, and unit visibility now determine throughput as much as railcars and haulaway trucks.
- Retail supplier changes needed transportation models first. With 66% of surveyed retail respondents willing to restructure supply chains if input costs rise, nearshoring and supplier diversification had to be tested against lead time, customs, capacity, landed cost, and service promise before sourcing awards.
- Defense manufacturing became port-readiness logistics. Saronic's planned $3B-plus Brownsville shipyard showed project freight depends on port acreage, channel depth, docks, security, supplier sequencing, and heavy-lift readiness long before production reaches scale.
- Saudi project logistics needed milestone control. A $2.27B Saudi project logistics market and strong heavy-lift growth showed industrial freight has to be managed around permits, cranes, route surveys, site access, delay ownership, and critical-path dates rather than generic capacity.
- Third-party GenAI made delivery answers a governance problem. Customer-facing AI tools are starting to answer delivery, return, duty, and exception questions, which means logistics teams need controlled answer sets, source authority, freshness rules, and escalation paths before AI fills gaps with guesses.
New Insights from July 23, 2026 Posts
July 23 added the effective-capacity layer to the retrospective. Across trucks, rail lanes, ports, chassis, technical labor, parcel labels, agricultural inputs, weather-exposed routes, and local lockers, the day's coverage showed that nominal availability is a weak planning measure. Capacity becomes executable only when eligibility, condition, custody, timing, and fallback rules are visible at the point of decision.
- Inspection readiness became a dispatch gate. Roadcheck out-of-service rates of 18.1% for vehicles and 5.9% for drivers showed that equipment location and empty time do not equal usable capacity without valid condition, credential, hours, and document records.
- Rail growth needed lane-level service proof. CSX's $3.94B quarter, 10.1% revenue growth, and improved 61.7% operating ratio made a case for controlled rail trials, but dwell, connection performance, transit variance, accessorials, and recovery still need lane-specific scorecards.
- Hormuz avoidance became a repeatable gateway option. Fujairah's planned 2.5M-TEU capacity moved eastern UAE routing from emergency theory toward network design, provided inland transport, customs, inventory, and activation costs are modeled.
- Chassis totals gave way to usable-equipment control. ITE's 60,000-unit platform and pandemic-era dwell inflation showed intermodal throughput depends on chassis location, condition, release rules, repair status, and repositioning—not aggregate fleet count.
- Automation adoption exposed the technician bottleneck. A projected 2.1M unfilled skilled-trades roles and high expected robotics and AI adoption showed that shared training pipelines, competency records, and response coverage are now automation infrastructure.
- Shipping-label authority became a warehouse security control. The alleged $2M Nike diversion case showed label creation, reprints, address changes, permissions, and physical scan reconciliation need one auditable chain.
- Port labor risk needed a same-day diversion clock. Oakland's short walkout showed alternate gateways and drayage capacity lose value quickly unless assessment, reservation, decision, and release gates are pre-approved.
- Fertilizer scarcity became shipment-level allocation. Potash constraints and the Jansen delay to mid-2027 showed supplier commitments need customer priority, confidence status, transport milestones, expiry rules, and named reallocation owners.
- Slow-moving weather required granular freight triggers. Tropical Storm Bertha showed lane segments, facility access, appointment windows, cargo sensitivity, and next-review times are more actionable than broad regional alerts.
- Smart lockers became custody-and-dwell networks. USPS Local XChange's $5.51 price, 700-location footprint, and five-day pickup clock showed last-meter logistics needs deposit, notification, occupancy, counter-transfer, and return events connected to customer service.
New Insights from July 24, 2026 Posts
July 24 added the reversible-control layer to the retrospective. The day's coverage showed that holds, reroutes, bookings, ownership assumptions, facility plans, release decisions, and delivery promises cannot be one-way status changes. They need thresholds, owners, evidence, and a controlled path to revision.
| Signal from July 24 coverage | Reported statistic | Technology use case | Source |
|---|---|---|---|
| Black Sea voyage exposure | At least 124 Russia-linked vessels reportedly targeted July 8-20, including 89 tankers; the CPC terminal serves roughly 80% of Kazakhstan's crude exports | Voyage-level risk scoring, hold/reroute triggers, insurance review, and customer escalation | SupplyChainBrain |
| Dynamic cross-dock decisions | A published operation reported 20% higher productivity and 20% lower labor cost | Event-driven inbound/outbound matching, door reassignment, and missed-connection prevention | Logistics Management |
| Floating LNG schedules | Seven laden Qatari carriers held about 0.57M metric tons; nearly 1.9M tons of LNG tanker capacity sat inside the Gulf | Waiting-time thresholds, next-voyage impact, commercial escalation, and schedule recovery | Reuters / S&P Global |
| Airfreight customer concentration | Apex was valued above $4B in 2025 versus about $1.5B in 2021; a roughly 20% stake was under discussion | Customer, gateway, carrier, and purchased-capacity scenario testing | SupplyChainBrain |
| Anchor-customer facility exposure | Maersk's $100M, 617,000-square-foot hub targets up to 330,000 units daily and roughly 1,000 jobs | Effective-utilization, contract-runway, labor-flexibility, and retenanting scorecards | Supply Chain Dive / Logistics Management |
| Panama Canal water risk | Surcharges reached $100 per TEU as severe El Niño probability rose from 25% to 81%; 76%+ of canal cargo is U.S.-connected | Lane-level booking triggers, surcharge exposure, alternative routing, and decision logs | Supply Chain Dive |
| Pharmaceutical tariff countdown | Proposed generic-drug rates move from 0% for two years to 100% for one year and then 200% | Product classification, customs-entry calendars, sourcing gates, and shelf-life-aware inventory | Supply Chain Dive / Reuters |
| Rural same-day eligibility | Tractor Supply covers 2,400+ stores; failed delivery costs about $17, while advanced routing has cut delivery cost 20%-30% | Store-SKU-time eligibility, basket validation, capacity checks, and promise feedback | Supply Chain Dive / Inbound Logistics |
- New trade lanes required durable chain of custody. Iraq's Syria route and Syria's reported 16.8M barrels across 19 cargoes in 2025 showed that sanctions relief does not remove the need for party, vessel, bank, origin, quality, and handoff evidence.
- Recall logistics needed reversible states. FDA's reversal of the Taylor Farms lettuce finding showed that a hold, recall, release, and disposition must remain distinct, linked events so inventory can be released without erasing why it was stopped.
- Concentration became an operating KPI. Airfreight acquisitions and dedicated fulfillment hubs both showed that customer, lane, gateway, carrier, equipment, and labor concentration should be measured before a contract or ownership change turns specialization into stranded capacity.
- Eligibility became the last-mile promise engine. Store inventory alone was insufficient; regulated goods, basket composition, picker and driver supply, distance, weather, and local operating windows all had to validate the promise before checkout.
New Insights from July 25, 2026 Posts
July 25 added the constraint-evidence layer to the retrospective. Across trade compliance, ocean equipment, packaging, LTL, air cargo, warehouses, strategic inventory, reverse logistics, and highway infrastructure, the day's coverage showed that visibility creates value only when it proves that freight can legally and physically move.
| Signal from July 25 coverage | Reported statistic | Technology use case | Source |
|---|---|---|---|
| Semiconductor export enforcement | Applied Materials agreed to a $252M settlement, twice the transaction value and the statutory maximum | Facility-level authorization checks, classification, end-user screening, diversion controls, and immutable booking evidence | Reuters |
| Conflict-driven container imbalance | 700+ vessels backed up, about 10% of the global container fleet affected, and roughly 2M TEUs exposed; selected ocean spot rates rose 29%-31% | Container-level location and custody, equipment forecasts, return-rule exceptions, repositioning priorities, and surcharge scenarios | Supply Chain Dive / FreightWaves |
| EU PFAS packaging controls | PPWR generally applies August 12, 2026, with thresholds of 25 ppb for an individual targeted PFAS, 250 ppb for their sum, and 50 ppm for total fluorine | Packaging-SKU bills of material, supplier declarations, test evidence, conformity archives, and shipment-release gates | Deloitte |
| Independent LTL capacity | FedEx Freight projects about $8.7B in first-year revenue and operates 26,000 doors across 355 terminals with 39,000 employees | Lane-level rate and service scorecards, terminal mapping, concentration monitoring, and ongoing bid governance | Logistics Management / Supply Chain Dive |
| Lithium-battery air compliance | Relevant shipments generally face a 30% state-of-charge ceiling; proposed FAA hazmat penalties totaled $430,000 | Battery-SKU compliance records, packing-instruction validation, document control, acceptance status, and fallback routing | IATA / FreightWaves |
| Warehouse heat and vehicle risk | About 95,000 forklift-related injuries occur annually; the proposed heat rule could affect roughly 36M workers | Zone-level exposure telemetry, training and inspection records, equipment eligibility, alerts, and corrective-action workflows | Inbound Logistics / Reuters / OSHA |
| Critical-mineral resilience | Project Vault combines a $10B EXIM loan with $2B private financing; China refines 47%-87% of several critical minerals | Lot-level provenance, secure custody, shelf-life and reserve drawdown rules, supplier concentration, and scenario planning | Supply Chain Dive / Reuters / IEA |
| Circular fulfillment | Electronics returns run 11%-20%; integrated reverse logistics can cut costs up to 25% and reduce 45-90-day backlogs to eight days | Persistent product identity, condition states, disposition routing, refurbishment milestones, and forward/reverse transport orchestration | Inbound Logistics |
| Driver-aware route capacity | A proposed $200M allocation could fund roughly 2,500 spaces at an illustrative $80,000 each; about 400,000 new CDLs are issued annually | Parking availability, hours-of-service, appointment, safe-stop, and route-plan integration | FreightWaves / Inbound Logistics |
- Compliance evidence moved upstream of tendering. Semiconductor licenses, PFAS declarations, and battery state-of-charge records must be validated before carrier selection, because a fast booking cannot rescue freight that is legally ineligible to move.
- Nominal capacity diverged from usable capacity. Terminal doors, containers, warehouse labor, air routes, and parking spaces counted only when location, condition, authorization, timing, and recovery rules were known.
- Product identity became lifecycle infrastructure. Critical-mineral provenance, packaging chemistry, battery configuration, and rental-product condition all require persistent records that survive supplier, warehouse, carrier, customer, return, and refurbishment handoffs.
- Human constraints became planning inputs. Heat exposure, forklift risk, driver rest, and technician or operator readiness belong in the same execution layer as rates, inventory, and transit time.
New Insights from July 26, 2026 Posts
July 26 added an eligibility-and-continuity layer to the retrospective. The day's coverage showed that capacity is not a provider list, tractor count, fuel claim, warehouse address, or national trade headline. It is the set of loads, assets, people, documents, and nodes that remain eligible, measurable, and recoverable under real operating conditions.
| Signal from July 26 coverage | Reported statistic | Technology use case | Source |
|---|---|---|---|
| 3PL growth and execution pressure | 84% of providers reported sales growth; 62% grew sales at least 10%; 66% cited operating cost, 52% capacity, and 46% compliance as major concerns | Shipment-level provider scorecards covering eligible tendering, milestone documents, exception closure, service, and invoice evidence | Inbound Logistics |
| Alcohol shipment eligibility | Alcohol distribution follows a three-tier model and jurisdiction-specific permissions | Machine-readable license, entity, product-class, consignee, lane, and expiration checks before tender, plus controlled overrides | Food Logistics / Inbound Logistics |
| Autonomous-yard productivity | A grocery network cut yard tractors from 22 to 14, about 36%, and expanded from one site to nine in six months; implied output per remaining tractor rose about 57% if work stayed constant | Yard-event baselines, moves per productive hour, dwell, empty travel, dock starvation, interventions, and counterfactual testing | FreightWaves / Food Logistics |
| CPSC product-certificate eFiling | Seven certificate fields connect product compliance to customs flow; broader customs reforms contemplate a minimum penalty floor of at least 50% | Product-certificate master data, pre-tender completeness gates, broker handoffs, and pre-arrival exception workflows | CPSC coverage / Supply Chain Dive |
| Broker transaction transparency | The proposal drew nearly 7,000 comments and contemplated requested electronic records within 48 hours; freight fraud costs exceed $1B annually | Immutable quote-to-settlement history, identity checks, tender and amendment logs, access controls, and timed disclosure workflows | FreightWaves / TIA |
| LNG lane qualification | LNG trucks may cut CO2 up to 30%; a roughly 265-DGE configuration can provide about 1,200 miles of range, with engines reaching 500 hp and 1,850 lb-ft | Fuel-station eligibility, range and reserve calculations, scheduled fueling events, payload effects, and emissions evidence inside dispatch | Reuters / FreightWaves |
| Production-distribution separation | PepsiCo's Tulsa warehouse shift affects 184 employees; 81% of surveyed 3PLs offer cross-docking, 77% fulfillment, and 67% DC management | Transfer-lane design, inventory and labor cutover files, carrier readiness, appointments, and total-cost network modeling | Supply Chain Dive / Inbound Logistics |
| Sodium-ion warehouse energy | Lead-acid powered an estimated 90% of electric forklifts in the cited benchmark; an eight-truck, 1.5-shift test found no adequate return from the higher-cost alternative | Controlled duty-cycle pilots combining runtime, charge behavior, temperature, cycle life, safety certification, serviceability, and shipment impact | Inbound Logistics / Modern Materials Handling / MHI |
| South Korea electronics surge | July 1-20 exports rose 52.3% YoY; May semiconductor exports rose 169.4% to $37.16B and April rose 151.4% to $32.83B | Separate value from physical volume, then trigger lane-level allocation using booking lead time, utilization, rollovers, rate spread, dwell, and shipment criticality | Reuters |
| Multi-node warehouse continuity | Two more Wildberries warehouses were attacked and 15 people were injured; general peak shipping runs June through October | Available-to-promise inventory by node, blocked-order state, alternate labor and dock capacity, carrier allocation, tiered rerouting, and chain-of-custody controls | Reuters / Supply Chain Dive |
- Eligibility became an execution primitive. Alcohol licenses, product certificates, carrier and broker records, alternative-fuel lanes, and shipment criticality all need machine-readable release rules before a load enters execution.
- Automation ROI required a counterfactual. Tractor reductions and new battery chemistries are credible only when normalized throughput, service, safety, work mix, and non-technology process changes are measured against a comparable baseline.
- Nominal growth needed operational decomposition. 3PL revenue growth and electronics export value can signal pressure, but neither proves usable provider capacity or physical freight volume without lane-, service-, and shipment-level evidence.
- Continuity moved from facility recovery to network orchestration. Production-node changes and warehouse shutdowns require synchronized inventory, labor, transport capacity, cutoff, safety, and customer-promise decisions across multiple nodes.
New Insights from July 27, 2026 Posts
July 27 added a decision-latency and qualification layer to the retrospective. The day's coverage showed that market signals only create value when they reach an accountable owner quickly, while carrier, customs, cold-chain, capacity, and sourcing decisions retain enough evidence to survive operational, financial, and legal scrutiny.
| Signal from July 27 coverage | Reported statistic | Technology use case | Source |
|---|---|---|---|
| Carrier-selection liability and fraud | A Dallas County jury issued a $604M advisory verdict; deceptive pickups rose 31% YoY and voluntarily reported 2025 cargo-theft losses reached $725M | Continuous carrier qualification, identity checks, tender rationale, insurance and authority monitoring, and load-level decision archives | Logistics Management / Inbound Logistics |
| Cold-chain response windows | The original Pfizer-BioNTech vaccine could remain refrigerated for five days versus up to a month for Moderna's vaccine | Unified temperature, inventory, custody, and exception events with product-specific thresholds and accountable response owners | Reuters / Food Logistics |
| Equipment-finance confidence | 22.7% expected business conditions to improve, 72.7% expected no change, and 28.6% expected lease and loan demand to increase | Asset replacement calendars, lease-versus-buy scenarios, maintenance risk, throughput requirements, and phased capacity approvals | Modern Materials Handling |
| Parcel peak-cost exposure | FedEx Ground residential demand fees reach $0.80 per package, enterprise residential charges reach $9.35, oversize reaches $117.25, and unauthorized packages reach $595 | Shipment-level fee simulation by date, ZIP, package dimensions, service, baseline volume, and alternate carrier | Supply Chain Dive |
| Forced-labor tariff transition | New 10% or 12.5% Section 301 tariffs cover 60 trading partners; USTR said the action reaches 99.4% of U.S. imports, while an analyst estimated the new rates apply to roughly 44% after exemptions and other duties | Entry-level effective-date controls, origin evidence, MFN netting, document holds, review gates, and auditable release | Supply Chain Dive / Logistics Management |
| Structurally slower truck-capacity rebound | Spot rates fell from $2.78 to $2.23 per mile in roughly three months in 2022; 2026 tender rejections reached 14.43% in late April | Routing-guide depth by qualified carrier, insurance and financing constraints, mini-bids, rejection triggers, and scenario testing | FreightWaves / Reuters |
| Provider-distress early warning | At least 1,222 layoffs and 10 Chapter 11 filings were reported from July 10-24 | Provider-health scores combining operating authority, service drift, labor signals, financial events, communication gaps, and staged backup capacity | FreightWaves |
| Ocean procurement timing | Asia-U.S. West Coast spot rates fell 6% to $7,067 per FEU while East Coast rates held at $9,102; bunker prices rose 12% | Contract-versus-spot allocation, schedule reliability, surcharge scenarios, equipment availability, and inventory-timing decisions | FreightWaves / Supply Chain Dive |
| Physical-edge decision latency | 60% of surveyed companies had comprehensive tier-one supplier visibility; digitally connected physical operations can deliver efficiency gains up to 40% | Event-to-decision cycle measurement across detection, validation, assignment, decision, execution, and confirmation | McKinsey / SupplyChainBrain |
| Supplier-sprawl freight tax | One manufacturer carried 12,000 caster SKUs; 98% of 300+ leaders were pursuing AI, while 54% of shippers cited transportation cost as a major challenge | Supplier-sprawl scores using SKU overlap, shipment fragmentation, consolidation loss, lead-time variance, expedites, and inbound landed cost | SupplyChainBrain / Inbound Logistics |
- Decision latency became a cross-functional KPI. The useful measure is not alert speed alone, but elapsed time from physical event through validation, ownership, action, and confirmation.
- Qualification records became board-level evidence. Carrier selection, tariff treatment, temperature response, and provider continuity require timestamped source data, thresholds, approvals, and overrides at the shipment level.
- Financial conditions became capacity signals. Equipment finance, insurance, litigation exposure, parcel fee calendars, bunker costs, and provider distress can delay or reprice usable capacity before traditional volume indicators catch up.
- Procurement choices created transportation consequences. Supplier diversification, carrier allocation, ocean contract mix, and asset investment all need inbound freight, service, compliance, and continuity evidence in the same decision file.
New Insights from July 28, 2026 Posts
July 28 added a capability-proof and escalation layer to the retrospective. The day's posts showed that broad claims—crossdocking, rail access, resilience, integration, predictive intelligence, or supplier recovery—only become useful when operators define the evidence, thresholds, decision rights, and service outcomes behind them.
| Signal from July 28 coverage | Reported statistic | Technology use case | Source |
|---|---|---|---|
| Crossdock capability proof | 81% of 3PLs offer crossdocking; one documented site moved 165,000 cases daily at 99.9% accuracy | Facility-level door assignment, dwell, scan compliance, damage, misrouting, and missed-transfer recovery scorecards | Inbound Logistics / Logistics Management |
| Rail access optionality | Proposed $85B UP-NS deal spans 50,000+ route miles, 43 states, and about 100 ports | Lane-level contract, interchange, facility, equipment, service, rate, data-rights, and remedy modeling | Logistics Management |
| Resilience investment governance | Conagra plans $125M in incremental supply chain investment while reviewing about 5,500 SKUs | Stage-gated capex tied to constraint proof, controlled pilots, inventory-and-transport tests, and recovery performance | Supply Chain Dive |
| Parcel fuel audit | DHL's table drops two percentage points; Q2 express fuel surcharges were up 65.4% YoY and ground surcharges up 40% | Shipment-level eligible-base reconstruction, contract-rule validation, before/after invoice audit, and savings attribution | DHL / Supply Chain Dive |
| Parcel acquisition integration | 87% of 3PLs offer TMS and 83% visibility, but 78% of shippers prioritize service over price | Pre/post-acquisition event normalization, SLA monitoring, claims continuity, label and tracking validation, and fallback routing | Inbound Logistics |
| Food-plant decision intelligence | 16B+ data points annually; predictive maintenance can cut downtime about 30% and labor cost up to 15% | Link equipment signals to food-safety risk, inventory holds, production changes, outbound priorities, data lineage, and human approval | Food Logistics |
| Resin allocation pressure | Polyethylene exports down 9.1M metric tons annualized, polypropylene production down about 3M metric tons, and local prices up 30% YoY | Material-to-SKU mapping, substitution gates, customer allocation, inventory protection, and mode-escalation rules | Supply Chain Dive |
| Procurement-to-freight escalation | Ocean freight up 150%, air cargo up 40%, and supplier delays worst since 2022 | Four-level monitor, mitigate, recover/allocate, and executive-intervention ladder with named decision owners | SupplyChainBrain |
- Capability menus lost value without facility-level proof. Crossdocking, WMS, TMS, visibility, and ERP integration are common; dwell, scan completeness, service continuity, and recovery performance are the real differentiators.
- Capital and network optionality needed stage gates. Resilience investments and rail-access agreements should enter planning models only after constraint, operability, economics, reliability, data rights, and fallback conditions are validated.
- Operational intelligence had to cross system boundaries. Maintenance alerts matter when they also govern food safety, inventory, production, freight priority, and accountable human decisions.
- Procurement volatility needed explicit escalation rights. Material shortages, resin allocation, supplier delays, and premium freight require shared thresholds so teams know when to monitor, mitigate, allocate, or escalate.
- Published rate changes required invoice-level evidence. A two-point fuel-table reduction does not produce the same saving across contracts; eligible charges, discounts, exclusions, and shipment mix determine the real result.
New Insights from July 29, 2026 Posts
Ten July 29 posts made data latency and evidence quality the day's unifying technology theme. The coverage showed that autonomy, tariffs, constrained components, port flow, carrier qualification, delivery promises, cold-chain consolidation, reusable packaging, regional fulfillment, and Scope 3 reporting all fail in the same place: a decision system cannot safely act on events that are stale, ambiguous, or detached from the shipment and asset they govern.
| Signal from July 29 coverage | Statistic | Technology and operating implication | Source |
|---|---|---|---|
| Agentic supply chain adoption | Agentic SCM software spending forecast at $53B by 2030; adoption forecast at 60%, up from 5% in 2025 | Graduated authority, event-quality contracts, and human approval thresholds must precede closed-loop execution | Gartner, McKinsey, and CXTMS July 29 analysis |
| Multi-tier supplier visibility | 95% of surveyed companies had supplier-risk processes, but only 42% had visibility to tier two or beyond | Component-to-product exposure graphs and timely supplier events are prerequisites for autonomous response | McKinsey 2025 supply chain risk survey |
| DRAM supply concentration | CXMT held about 7.7% of the 2025 global DRAM market; Q1 revenue rose 719% YoY to 50.8B yuan | Transportation priorities should reflect usable component supply and production-release value, not shipment size alone | Reuters and CXMT IPO prospectus |
| Tariff-change velocity | More than 2.5M rule changes forecast across 40+ tariff schedules in 18 months | Tariff feeds need effective-date validation, product matching, controlled holds, approvals, and an audit trail inside the TMS | FreightWaves and CXTMS July 29 analysis |
| Port Houston capacity | 2.23M TEUs in H1 2026; June volume 389,962 TEUs, up 18% YoY; loaded imports up 27% | Monthly forecasts must translate into terminal appointments, chassis, drayage, and warehouse receiving slots | Port Technology International and Port Houston |
| New-entrant carrier safety | New entrants' share of fatal large-truck and bus crashes rose from 4.6% in 2017 to 7.4% in 2022; 2022 incidents caused 494 deaths and more than $5.5B in costs | Carrier onboarding should move identity, safety, insurance, equipment, and document checks ahead of tender eligibility | FreightWaves and FMCSA analysis |
| Cold-chain co-loading | Better refrigeration could prevent nearly half of 1.3B tons of annual food waste; moving utilization from 50% to 75% can reduce theoretical trip demand by about one-third | Consolidation logic must preserve lot, temperature, shelf-life, custody, claims, and proof-of-delivery identity by customer | Inbound Logistics and CXTMS July 29 analysis |
| Regional fulfillment node | American Eagle's $41M, 472,980-square-foot DC has 84 dock doors, will create 200+ jobs, and is planned for early 2027 | New nodes need separate store and parcel flow tests plus launch gates tied to order cycles, cutoffs, and carrier scans | Supply Chain Dive |
| Sustainable material traceability | Gap reached 100% sustainable cotton and 65% recycled polyester; Scope 3 purchased-goods emissions were 20% below 2017 against a 32.5% 2030 target | Annual sourcing claims need purchase-order, facility, certificate, booking, and shipment-level evidence | Supply Chain Dive and Gap FY2025 reporting |
| Delivery reliability evidence | UPS RFID-enabled service covers more than 2.2M pieces per day | Promise variance and event completeness are stronger carrier-selection inputs than average transit time alone | Supply Chain Dive and UPS |
The practical use cases are clear. AI systems need minimum event-quality contracts and tiered authority. Trade systems need narrow, reversible shipment holds rather than network-wide stops. Port control towers need appointment shortfall and free-time triggers. Carrier platforms need pre-operation qualification. Cold-chain and reusable-asset networks need persistent digital identity and customer-specific custody. Sustainability systems need evidence attached to the purchase order and shipment, not only the annual report.
The broader conclusion is blunt: better models do not compensate for weak operational records. The logistics technology stack of 2026 is becoming a system of action, but its permission to act must remain proportional to the freshness, completeness, and traceability of its evidence.
New Insights from July 30, 2026 Posts
Ten July 30 posts shifted the focus from whether technology is available to whether its economics and operating performance are comparable. The common requirement was a normalized decision record: automation buyers need throughput baselines and acceptance tests; parcel and 3PL users need landed-cost and returns logic; fleet managers need portable telemetry; and transportation leaders need commodity, earnings, service, and shipment data that reconcile to the P&L.
| Signal from July 30 coverage | Statistic | Technology and operating implication | Source |
|---|---|---|---|
| AGV investment case | Market projected from $3.9B in 2024 to $12.8B by 2035, a 10.3% CAGR | Size fleets from measured flow, congestion, recovery, and labor economics rather than market forecasts | Modern Materials Handling |
| Integrated automation acceptance | Dematic invested nearly $50M in a 40,000-square-foot Solutions Center; warehouse automation is projected to reach $51B by 2030 | Contracts should test throughput, exceptions, software handoffs, degraded modes, and recovery with the buyer's order profile | Modern Materials Handling and Inbound Logistics |
| Omnichannel parcel optimization | Caraway volume scaled 280% in one year and live multi-carrier rate shopping cut parcel cost 20% | Rate shopping, inventory, carrier events, returns, and disposition should share one order-level integration contract | Supply Chain Dive |
| Returns cost exposure | Returns can cost 20%-30% of the original sale price; seasonal volume can rise 25%-50% | Reverse-logistics routing and disposition belong in the same margin decision as outbound fulfillment | Inbound Logistics |
| Parcel price normalization | 2026 general rate increases were 5.9%, while ground fuel surcharges rose 26% against a 4.7% diesel increase | Compare shipment-level landed cost across fuel tables, accessorial bases, service, coverage, and package mix—not headline rate cards | FreightWaves |
| Retail freight consolidation | Programs average 97% OTIF and can save up to 30% versus traditional LTL | Purchase-order eligibility, cutoff, dwell, appointment, label, and release rules must govern consolidation | Inbound Logistics |
| Big-and-bulky demand reset | The $10.6B market is forecast at 5.1% CAGR, down from 10.6%; home turnover hit a 30-year low | Reprice capacity lane by lane using stop cost, service tier, density, minimum charge, and housing-linked demand | FreightWaves |
| Ocean carrier earnings signal | CMA CGM shipping EBITDA rose 42.4% while container volume increased 6% | Earnings, margins, volume, and new capacity should feed lane-level procurement triggers before contract negotiations | FreightWaves |
| Commodity-level rail capacity | 234,100 carloads rose 1.4% YoY; 293,062 intermodal units rose 3.5%; petroleum rose 11.8% | Weekly commodity signals can trigger equipment, transload, drayage, and mode-switch reviews before broad indexes move | FreightWaves |
| Freight-to-margin reconciliation | Transportation commonly consumes 7%-10% of sales | A shipment-level margin bridge should isolate rate, mode, zone, weight, dwell, surcharge, and service-failure variance | Inbound Logistics |
The technology use cases now form a connected control loop. Warehouse systems establish a flow baseline, simulate the operating profile, and enforce acceptance gates before scaling automation. Fleet platforms preserve meter, battery, maintenance, charging, and task data across equipment brands. Transportation systems normalize parcel and ocean economics, govern consolidation releases, watch commodity and carrier signals, and reconcile every variance back to the shipment and financial ledger.
The new insight is that interoperability has an economic dimension. An API is not enough if two carriers calculate fuel on different bases, two forklift vendors retain incompatible histories, or an automation test uses a clean demo profile that hides real exceptions. The 2027 winners will make cost definitions, test conditions, data ownership, and outcome measures explicit before procurement—not after implementation.
New Insights from July 31, 2026 Posts
Nine July 31 posts made continuity under change the day's defining logistics technology theme. AI pilots, customs recommendations, automation assets, driver qualifications, yard moves, campaign freight, rail handoffs, and carrier portfolios all need persistent records that remain intelligible when a vendor changes its name, a business changes owners, a worker enters through a new credential path, or a model produces a recommendation.
| Signal from July 31 coverage | Statistic | Technology and operating implication | Source |
|---|---|---|---|
| AI value governance | 72% of supply chain organizations had deployed generative AI, but only 23% had a formal AI strategy | Maintain a value ledger that compares service and labor gains with model, integration, review, exception, and support costs before scaling | Gartner / McKinsey |
| AI logistics outcome proof | One distribution pilot improved on-time delivery 20% within six months and reclaimed more than two supervisor hours per day | Tie every AI output to a baseline, approved action, realized outcome, human-review cost, and stop/revise/scale gate | McKinsey |
| AI yard and production control | A plant producing up to 90,000 cans per hour handles 140-200 trucks daily; AI sequencing cut gate-to-gate time about 45% and achieved 85% on-time completion accuracy | Combine appointments, truck status, material priority, production readiness, dock capability, timestamps, and exception ownership in one yard-control record | SupplyChainBrain |
| Cross-border rail service | CPKC Q2 revenue reached C$4.2B, up 13% YoY; SMX cross-border volume rose 30% sequentially; June intermodal volume rose 11.6% YoY | Build train-level milestone ledgers across booking, cutoff, border, terminal, customs, free time, and drayage handoffs | FreightWaves / Logistics Management |
| Automation vendor identity | 55% of supply chain leaders were increasing technology investment; 42% planned to spend more than $10M; five-year robotics adoption was projected at 82% | Preserve vendor-name crosswalks across assets, software, warranties, parts, service entitlements, invoices, and lifecycle cost | MHI and Deloitte / Modern Materials Handling |
| Automation installed-base continuity | Automated material handling equipment is projected from $33.39B in 2025 to $51.22B by 2030, an 8.9% CAGR | Put controls, source code, cybersecurity, patches, spares, service capacity, and change-of-control obligations into a measurable continuity file | Modern Materials Handling |
| Veteran freight credentialing | More than 40,000 veterans had used the nationwide Military Skills Test Waiver by the June 30 update | Map military experience to CDL, medical, equipment, safety, insurance, training, and dispatch eligibility while measuring the full recruitment-to-retention funnel | FreightWaves |
| Food campaign capacity | Logistics represents roughly 7%-10% of food and beverage product cost | Plan each campaign around deadline, temperature, packaging, equipment, carrier cutoff, readiness gate, and margin rather than monthly volume averages | Food Logistics |
| Mode-level carrier risk | TFI adjusted EBITDA margin was 24.1% in truckload versus 18% in LTL; LTL represented 41% of revenue | Score financial health, service, network fit, claims, capacity, and backup options by mode and lane instead of relying on consolidated carrier averages | FreightWaves |
| Truck-demand signal | ATA's June For-Hire Truck Tonnage Index was 113.1, down 0.7% YoY after a 2.5% annual gain in May | Feed demand and provider financial signals into mode-specific procurement triggers without treating profitability as proof of service quality | Logistics Management |
The practical pattern is durable identity plus bounded authority. Private customs AI should accelerate research while preserving the source, tariff version, product facts, human approval, and entry-level outcome behind every answer. Automation teams need the same discipline when suppliers rebrand or ownership changes: the asset, software version, warranty, spare, vulnerability, and support obligation must survive the corporate event. Workforce systems need credential crosswalks that translate experience into dispatch eligibility without weakening safety controls.
July 31 also sharpened the economics of execution. Yard AI should be measured against factory flow, not dashboard activity. Campaign freight should be evaluated against deadline attainment and product margin, not monthly averages. Rail visibility should follow train and border handoffs, while carrier risk should be separated by mode. Across every category, the winning system is the one that keeps evidence and accountability intact while the surrounding organization changes.
- Proof moved from shipment status to operating identity and economic causality. August 1 coverage connected seafood chain of custody, tractor and trailer verification, carrier workforce stability, terminal optionality, bulk-flow recovery, cold-chain allocation, restructuring benefits, refined-product provenance, and truckload pricing cause codes into one rule: a trustworthy logistics record must prove not only what moved, but which asset, party, constraint, and business cause produced the outcome.
New Insights from August 1, 2026 Posts
The first August articles sharpened a theme running throughout the year: visibility is no longer enough unless the record can defend identity, causality, and commercial decisions. The new use cases span asset verification at the gate, lot-level sustainability claims, workforce stability in carrier scorecards, berth optionality in ocean procurement, quarterly recovery constraints in bulk freight, and normalized benefits ledgers for multi-year network transformations.
| Signal from August 1 coverage | Reported statistic | Technology and workflow implication | Source |
|---|---|---|---|
| Seafood identity risk | At least 32% of tested fish were mislabeled | Link supplier certificates, lots, cartons, custody events, substitutions, and customer claims in one evidence chain | Food Logistics / CXTMS August 1 analysis |
| Chemical carrier capacity | Roughly 90% of Univar's volume is liquid-bulk hazmat and about 50% moves with outside carriers; earlier hazmat/tanker rate increases reached 60%-70% | Add facility delay, safety, appointment, communication, and driver-treatment signals to carrier-attractiveness scorecards | FreightWaves / Inbound Logistics / CXTMS August 1 analysis |
| Terminal ownership and dwell | Stonepeak will invest $2.4B for 25% of a CMA CGM terminal venture covering 10 assets; a proposed dwell fee began at $100 after nine days | Score terminals and service strings by control, dwell, drayage recovery, demurrage exposure, and alternate-berth readiness | FreightWaves / Supply Chain Dive / CXTMS August 1 analysis |
| Driver stability as capacity | A 600-truck employee-owned fleet reported 35%-39% turnover versus truckload-sector levels approaching 100% | Treat turnover, seated-tractor share, tenure, and hiring friction as leading indicators of tender reliability | FreightWaves / Logistics Management / CXTMS August 1 analysis |
| Bulk-flow variability | Fortescue shipped 52.7M metric tons in the quarter, down 5% YoY, while full-year shipments reached a record 201.3M tons | Replace annual averages with quarterly constraint models spanning production, rail, port, vessel, and recovery windows | Reuters / Inbound Logistics / CXTMS August 1 analysis |
| Cold-chain allocation pressure | The U.S. Gruyère tariff rose to 12.5%, production was cut 5%, and temperature-controlled LTL represents only about 5%-10% of U.S. capacity | Combine tariff, lot age, shelf life, compatible capacity, temperature proof, and landed margin before reallocating product | Reuters / Food Logistics / CXTMS August 1 analysis |
| Transformation benefits evidence | J&J expects up to $750M in restructuring costs while planning $55B of U.S. manufacturing, R&D, and technology investment | Maintain a normalized benefits ledger that separates volume, fuel, launches, exits, service effects, and genuine transformation gains | Supply Chain Dive / CXTMS August 1 analysis |
| Asset-identity fraud | Authorities recovered 13 semis, three trailers, and two vehicles worth more than $1M; deceptive pickups rose 31% YoY | Verify tractor, trailer, VIN, plate, seal, telematics, driver, and dispatch identity at every custody handoff | FreightWaves / Supply Chain Dive / CXTMS August 1 analysis |
| Refined-product provenance | Russian gasoline output covered only 65% of demand before an unusual Morocco-origin cargo arrived | Preserve seller, vessel, cargo origin, payment, sanctions screening, approvals, and route changes as one auditable record | Reuters / CXTMS August 1 analysis |
| Truckload price causality | Tender rejections reached 15.44%, spot rates about $3.53 per mile versus a $2.79 annual average, and contract rates were 18% higher YoY | Cause-code rate changes by demand, available capacity, driver supply, compliance exits, lane imbalance, and service requirements | FreightWaves / CXTMS August 1 analysis |
Together, these posts extend the 2026 technology agenda beyond predictive alerts. The durable advantage is an execution system that can explain why a rate changed, prove which asset collected the freight, show which lot supported a product claim, and demonstrate whether a network intervention actually created value.
- Decision readiness became the constraint on automation and network change. August 2 coverage connected shipper-3PL AI accountability, earthquake recovery, LMI interpretation, automation interfaces, multi-site robot commissioning, fleet-replacement timing, food-waste feedback, data-error economics, parcel readiness, and warehouse consolidation into one rule: technology should not act until the data, authority, capacity, interface, and recovery evidence behind the decision are explicit.
New Insights from August 2, 2026 Posts
The August 2 articles moved the retrospective from evidence collection to decision readiness. Whether the decision is an AI-generated tender, a factory restart, a robot go-live, a truck replacement, a parcel label, or a warehouse closure, the operating system must define who can act, which inputs are trusted, what limits apply, and how the result will be measured and reversed.
| Signal from August 2 coverage | Reported statistic | Technology and workflow implication | Source |
|---|---|---|---|
| Shipper-3PL AI governance | 93% of responding 3PLs expect AI to be the industry's most disruptive technology, while 73% of shippers call AI implementation their leading challenge; only 15% of IT application leaders were considering, piloting, or deploying fully autonomous agents | Assign source-data, model-output, approval, communication, cybersecurity, and recovery ownership before AI changes freight decisions | Inbound Logistics / Gartner |
| Earthquake restart sequencing | A magnitude 7.1 earthquake halted three Toyota plants in southern Japan while TSMC resumed gradually | Gate recovery through people, utilities, equipment qualification, material availability, logistics readiness, and verified production output instead of declaring a site simply “open” | Reuters: Toyota / Reuters: TSMC |
| Inventory-capacity reconciliation | The LMI reached 71.1, its first reading above 70 since March 2022; warehouse capacity contracted at 47.5 while utilization reached 69.4 and prices 73.8 | Reconcile inventory age, throughput, storage, tender acceptance, and service outcomes before treating a composite index as one growth signal | SupplyChainBrain / FreightWaves |
| Automation interface economics | Hardware represents 42.6% of 2026 material-handling integration demand; the market is forecast to reach $129.53B by 2036 | Budget event definitions, middleware, testing, cybersecurity, fallback modes, training, and lifecycle ownership alongside equipment | Modern Materials Handling / MHI / CXTMS August 2 analysis |
| Multi-site AMR commissioning | O'Neill Logistics plans 24 robots across two warehouses; cited AMR examples improved picking from 30 to 110 picks per hour and productivity by 200% | Use one scorecard for safety, technical acceptance, workflow performance, workforce adoption, and customer outcomes while retaining site-specific baselines | Modern Materials Handling / Inbound Logistics |
| Class 8 replacement timing | PACCAR Q2 net income rose 24% sequentially to $752M; deliveries rose from 33,000 to 38,700 and Q3 guidance reached about 42,000 | Separate replacement from fleet growth and combine build slots, tractor age, maintenance, seated capacity, and lane performance into procurement triggers | FreightWaves |
| Predictive food-waste feedback | Roughly 30% of grocery-store food goes unsold, contributing to about 16B pounds of retail food waste | Feed item-, lot-, store-, markdown-, delivery-, and spoilage-level evidence back into replenishment before the next order cutoff | Food Logistics |
| Cost of bad decisions | Poor data quality costs organizations at least $12.9M per year on average, and 83% of logistics survey respondents called data quality the top AI barrier | Rank defects by the decisions and recurring cost they expose, then place prevention controls immediately before mode, tender, dock, inventory, and audit decisions | Gartner / Inbound Logistics |
| SMB parcel readiness | UPS SMB daily volume rose 4.3% YoY; its redesigned tools connect to more than 5,500 UPS Store locations | Validate address, package, service, accessorial, readiness, and customer-promise data before faster self-service tools purchase a label | Supply Chain Dive / Logistics Management |
| Warehouse consolidation risk | One network study tested 18 markets and 77 location combinations; only about 190M square feet of U.S. warehouse space is expected in 2026, the lowest delivery level in a decade | Price service penalties, transition inventory, peak capacity, labor, premium freight, and time to recover before facility savings clear an approval gate | SupplyChainBrain / Inbound Logistics |
Three new cross-cutting insights follow. First, AI governance and data quality are the same operating problem when a model can change a carrier, promise, inventory position, or cost. Second, automation value increasingly depends on interfaces and commissioning discipline rather than hardware alone. Third, resilience is becoming a gated sequence: restart, expansion, consolidation, and replenishment decisions all need explicit evidence before execution proceeds.
New Insights from August 3, 2026 Posts
August 3 coverage reinforced one broad conclusion: logistics technology is becoming an evidence-and-trigger layer across assets, sourcing, capacity, healthcare, and disruption response. The new material added ten use cases and the following sourced benchmarks.
| Signal | 2026 evidence | Technology and operating implication | Source |
|---|---|---|---|
| Equipment-level cargo security | CBP recovered 366 packages containing 910 pounds of cocaine, valued above $20M, from beneath a trailer floor | Persistent trailer identity, seal events, inspection history, telemetry, and custody holds must travel with equipment—not only the driver or shipment | FreightWaves; Inbound Logistics |
| Electronics demand-to-execution gap | Apple reported iPhone sales up 22%, Mac sales up 25%, revenue up 16% to $109B, and profit up 26% to $29B while warning of chip constraints | Forecast changes need shipment-level reconciliation across components, factories, allocation rules, bookings, and customer promises | SupplyChainBrain |
| Fuel-normalized freight bids | A baseline change from $1.25 to $1.50 in a worked fuel formula changes a 1,200-mile load by about $46, or roughly $460,000 across 10,000 loads | Procurement platforms must preserve original bids while normalizing fuel, accessorial, mileage, and service assumptions for comparison and invoice audit | FreightWaves |
| Secondary-airport capacity | DSV reached eight weekly operations at Rockford; the airport handled 498,432 metric tons in 2025, up 10.8% | Gateway selection should compare aircraft-to-consignee reliability, handling, customs, recovery trucking, total cost, and missed-connection risk | FreightWaves |
| Selective supplier consolidation | Nearly half of surveyed fashion companies expect fewer suppliers; only 21% expect more sourcing countries, yet 65% still source from at least 10 countries | Supplier rationalization needs country, lane, compliance, capacity, and concentration scorecards so fewer vendors do not erase geographic resilience | Supply Chain Dive; USFIA; McKinsey |
| Constraint-aware automotive sourcing | GM expects $9B of U.S. manufacturing investment in 2026, another $1B-$1.5B in 2027, and capacity of 2M vehicles | Battery rightsizing, memory commitments, production milestones, inbound lanes, and inventory buffers belong in one constraint-aware plan | Supply Chain Dive |
| Ocean newbuild optionality | HMM paused at least ten 13,000-TEU ships—130,000 TEU, roughly 13% of its current capacity base | Shippers should separate near-term spot-rate shocks from multi-year fleet decisions and connect both to allocation and contract triggers | FreightWaves |
| Auditable logistics AI | Freight logistics represents an estimated 7%-8% of global emissions; AI could reduce the footprint 10%-15% | RAG systems need sentence-level citations, timestamps, inherited permissions, deterministic release gates, and human approval for consequential actions | Reuters; SupplyChainBrain |
| Pharmacy micro-fulfillment | Walgreens' Kent hub is designed for 7M prescriptions annually across nearly 196 stores; its automated network handled 3.5M prescriptions weekly in 2025 | Automation throughput must connect to prescription-level cutoffs, custody milestones, local resilience buffers, and named exception owners | Supply Chain Dive |
| Belly-cargo disruption clocks | WestJet moved from a 72-hour notice to cancellations and a strike affecting about 250,000 travelers before an August 3 agreement | Air-cargo contingency systems need timed rebooking, truck-air substitution, gateway activation, and customer-notification triggers | Reuters |
Evidence moved from the shipment to the physical asset
The Calexico seizure showed that approved drivers and valid tenders cannot prove a trailer has not been swapped or structurally modified. Equipment identity, repairs, seals, inspections, coupling events, geofences, and custody transfers now form a security record that must survive load and carrier changes.
Forecasting and sourcing became executable only after freight reconciliation
Apple's demand surge and GM's battery-and-memory strategy exposed the same control gap from opposite directions. Demand, component supply, factory allocation, inbound capacity, finished-goods bookings, and customer promises must be reconciled at shipment level; otherwise every function can meet its local plan while the network misses the commercial outcome.
Commercial normalization became continuous governance
Fuel-normalized bid tools and HMM's newbuild pause both showed that headline prices are insufficient. Teams need comparable assumptions, preserved original terms, multiple planning clocks, and post-award evidence that distinguishes market movement from accessorial leakage, service failure, or a changed capacity thesis.
Optionality became a designed service, not an emergency improvisation
Rockford's recurring freighter network and WestJet's rapid strike sequence demonstrated that alternatives work only when capacity, handling, customs, trucking, cutoffs, and decision authority are verified before disruption. A backup airport or carrier without an executable handoff is just a map pin.
AI and automation inherited higher proof requirements
RAG in port logistics and Walgreens' pharmacy hub showed why faster decisions require stronger controls. Source citations, record freshness, permissions, hard workflow gates, patient or customer promises, custody milestones, and accountable exception owners must remain visible when software interprets evidence or physical automation concentrates volume.
Network simplification needed diversity guardrails
Fashion sourcing data showed suppliers can be consolidated without abandoning geographic resilience, but only when teams measure retained capacity, country concentration, compliance performance, substitution options, and lane exposure. Fewer relationships reduce complexity; fewer genuinely independent recovery paths increase risk.
- Execution economics moved below the network average. August 4 coverage showed that the most useful technology decisions now happen at the shipment, lane, facility, supplier, service-line, and fulfillment-node level. National indicators and portfolio headlines remain useful warnings, but reliable action depends on granular triggers, evidence, and outcome ledgers.
New Insights from August 4, 2026 Posts
The August 4 articles added a common operating rule: translate every broad signal into a controlled decision at the point where physical flow can still change. Manufacturing expansion needs release-level capacity rules; AI forecasts need shipment outcomes; cargo damage needs a total-loss ledger; cold-chain imports need regulatory milestones; and rapid delivery needs eligibility and fallback logic before checkout.
| Signal from August 4 coverage | Reported statistic | Technology and workflow implication | Source |
|---|---|---|---|
| AI planning tied to execution | AI forecasting can reduce errors 20%-50%; cited consumer-goods programs cut finished-goods inventory 6%-8% and improved fill rates 3%-5% | Connect each forecast revision to purchase orders, production, allocation, bookings, overrides, fill rate, and avoided expedites in an auditable benefits ledger | Supply Chain Dive / McKinsey |
| Total freight-damage economics | $250,000 in annual claims produced $855,000 in total impact, or $3.42 for every claim dollar | Score packaging, carriers, lanes, and handling points with shipment-level replacement freight, labor, penalties, cash-flow delay, lost margin, and recovery evidence—not paid claims alone | Inbound Logistics |
| Factory flow before premium freight | GE Aerospace cut critical-component lead time 60% and increased F110 engine deliveries 50% YoY | Link production milestones and confidence-rated shipment-ready dates to pickup appointments before buying faster transportation to mask internal queues | Supply Chain Dive |
| Manufacturing-to-freight triggers | July Manufacturing PMI reached 55.6, New Orders 56.7, and Production 58.5 | Treat PMI as an early warning, then require SKU-, plant-, lane-, equipment-, and release-level evidence before changing capacity commitments | Logistics Management |
| Defense supplier-capacity proof | The Army's Patriot award is worth up to $58.6B over seven years; planned PAC-3 capacity rises from roughly 600 to 2,000 interceptors annually | Govern the ramp through tier-level constraints, qualification dates, secure-freight milestones, acceptance evidence, and bottleneck variance rather than contract-value averages | Reuters |
| Inland export-terminal optionality | Los Angeles/Long Beach throughput is projected to grow from 16.6M TEUs in 2023 to 41M by 2040 | Compare empty release, exporter drayage, depot capacity, rail cutoff, on-dock handoff, vessel loading, and exception recovery as one multimodal route | Logistics Management / Inbound Logistics |
| Lane-specific truck capacity | Tender rejections approached 15%; spot truckload reached about $2.80/mile, up 23% YoY, while rail can save 20%-30% on some long-haul lanes | Combine lane rejection, tender lead time, spot premium, and service thresholds before activating backup carriers, mini-bids, or intermodal substitution | FreightWaves |
| Provider portfolio divergence | UPS Supply Chain Solutions revenue rose 7.8% to $2.86B while the company removed 500,000 Amazon pieces per day in Q1 | Map dependency by parcel, contract logistics, healthcare/cold chain, and returns; trigger contingency tests when a provider reallocates capacity or changes economics | FreightWaves / Supply Chain Dive |
| Drone-delivery eligibility | Walmart/Wing now covers 50,000+ Central Florida addresses and plans 270+ Walmart locations in 2027; delivery can arrive in 30 minutes | Validate node, inventory confidence, basket weight, address, weather, handoff deadlines, and ground fallback before presenting the promise | Supply Chain Dive |
| Regulated cold-chain availability | A Chile-Wilmington produce service pairs weekly sailings with destination fumigation after a six-month capacity expansion | Calculate cargo availability only after temperature, inspection, treatment, release, drayage, and receiving conditions are satisfied | Food Logistics |
Four insights cut across the day's coverage. First, outcome accounting is replacing proxy metrics: forecast accuracy, claim dollars, contract value, and headline volume are insufficient without service and cost evidence. Second, physical constraints must become explicit milestones—from fumigation and factory release to depot handoffs and drone eligibility. Third, capacity response should be granular: lane thresholds and service-line exposure maps prevent costly network-wide reactions to uneven signals. Fourth, automation is only dependable when it includes authority, deadlines, exception branches, and a measurable fallback.
- Eligibility, acceptance tests, and reversible evidence became execution controls. August 5 coverage connected driver-license expiry, consolidated B2B delivery, tariff refunds, backorder recovery, autonomous trailer loading, robot origin restrictions, manufacturing incentives, airfreight contingencies, trade litigation, and ESG claims into one rule: a plan should act only after it can prove who and what is eligible, which operating threshold has been met, and how the decision can be audited or reversed.
New Insights from August 5, 2026 Posts
The August 5 articles made evidence operational in three ways. Eligibility records now influence available trucking capacity, tariff recovery, automation sourcing, and delivery promises. Acceptance tests determine whether robotics and recovery workflows are genuinely production-ready. Reversible ledgers preserve the baseline when policy, allocation, sustainability calculations, or disruption status changes.
| Signal from August 5 coverage | Reported statistic | Technology and workflow implication | Source |
|---|---|---|---|
| Driver-credential capacity horizon | About 194,000 non-domiciled CDL holders may become ineligible to renew; transportation spending rose 28.1% YoY despite lower shipment volume | Replace a point-in-time license check with carrier- and lane-level expiry buckets, substitution difficulty, tender eligibility, and renewal scenarios | FreightWaves / Logistics Management |
| Consolidated B2B delivery | Amazon's branded-truck rollout spans 13 states; the company delivered 6.7B packages in 2025 | Govern order aggregation, pallet readiness, appointments, route density, receiving constraints, and exception fallbacks as one B2B service | Supply Chain Dive |
| Customer tariff-refund eligibility | The federal refund system covers about $166B; customs liquidation typically takes 314 days, with expected processing of 60-90 days | Link importer-of-record status, entry lines, invoices, seller policy, customer eligibility, claim status, and payment reconciliation to each purchase order | Reuters / Supply Chain Dive |
| Backorder recovery economics | Shipper spending increased 28.1% YoY while volumes fell | Rank recovery options by customer priority, inventory confidence, transport feasibility, appointment deadlines, incremental cost, and approved service tradeoffs | FreightWaves |
| Autonomous trailer-loading acceptance | FedEx loads tens of thousands of trailers daily; warehouse automation is projected to reach $51B by 2030 | Require production tests for load rate, cube utilization, damage, exception recovery, safe handoff, and departure impact before scaling robots | Logistics Management / Inbound Logistics |
| Automation country-of-origin exposure | China represented more than 80% of 16,000 humanoid robots installed worldwide in 2025 | Maintain origin, ownership, chips, software, communications, data flows, spares, support, and approved-substitute evidence for every automation asset | SupplyChainBrain / Reuters |
| India manufacturing landed cost | Made-in-India iPhones were expected at 25%-30% of global shipments versus 18% in 2024; selected parts duties fell to 10% from 15% | Model tax treatment, component duties, bill of materials, factory economics, customs time, premium freight, destination mix, and policy reversibility together | Reuters |
| Airfreight contingency clocks | Air cargo demand rose 4% in H1 2026 and 7% in June while capacity was nearly flat | Freeze uncertain milestones in 15 minutes, reconcile manifests in 30, notify customers in 60, and connect waybills, DG files, insurance, and alternate capacity | Reuters / FreightWaves |
| Reversible Section 301 scenarios | 25 states challenged tariffs of 10% or 12.5% covering 60 trading partners; earlier refund exposure reached roughly $166B | Preserve the pre-tariff baseline, current collection, exclusions, entry-line evidence, legal scenario, and refund owner without overwriting history | Supply Chain Dive / SupplyChainBrain |
| Supplier-and-carrier ESG proof | Walmart reported 50% renewable electricity, a 24.6% Scope 1 and 2 reduction, and 1.37B metric tons CO2e expected from supplier projects | Separate primary from modeled data and attach facility, supplier, shipment, carrier, methodology, boundary, approval, and recalculation evidence to every claim | SupplyChainBrain |
The cross-cutting insight is that logistics systems are becoming eligibility engines. They must know whether a driver, carrier, shipment, refund claimant, robot, supplier claim, inventory unit, or recovery route qualifies at the moment of action. The same systems also need explicit acceptance gates and immutable baselines so a policy reversal, failed test, changed allocation, or corrected emissions factor can be handled without reconstructing the decision after the fact.
- Operating context became as important as shipment status. August 6 coverage connected AI-infrastructure airfreight, carrier-recovery scorecards, inbound-management cutovers, lean peak inventory, cold-storage rebalancing, logistics decision rights, ocean contracting, inland rail gateways, reusable cold-chain assets, and freight-cost bridges into one rule: execution systems must preserve the commercial, organizational, asset, and network context that explains when a movement is viable and whether it created value.
New Insights from August 6, 2026 Posts
August 6 coverage showed that visibility alone is no longer enough. Logistics teams need decision-ready records that connect capacity, authority, service evidence, asset custody, and financial outcomes before changing a lane, provider, facility, operating model, or customer promise.
| Signal from August 6 coverage | Reported statistic | Technology and workflow implication | Source |
|---|---|---|---|
| AI-infrastructure airfreight | DHL Group Q2 operating profit rose 30%, DHL Express operating income 64%, and airfreight gross profit per unit 28%; Lufthansa Cargo logistics revenue rose 27% to €1B | Treat server racks as a distinct cargo class with main-deck capacity, shock/tilt evidence, security custody, site-readiness milestones, and installation-linked delivery control | FreightWaves — DHL / FreightWaves — Lufthansa |
| Carrier recovery evidence | Forward Air Q2 revenue reached $673M, up 9%, while adjusted EBITDA rose 18% to $93M; net debt remained $1.66B, or 5.2x trailing adjusted EBITDA | Keep tender acceptance, transit reliability, claims, invoice accuracy, and terminal exceptions on lane-level scorecards until financial recovery is visible in shipper service | FreightWaves |
| Inbound-management insourcing | An incumbent provider maintained 95%+ on-time delivery across 30-50 weekly inbound shipments during a grocery-network transition; cited TMS payback commonly runs 6-18 months | Use data-transfer ledgers, named decision owners, parallel decision runs, cutover gates, and explicit rollback thresholds when bringing transportation control in-house | Inbound Logistics / SupplyChainBrain |
| Lean peak inventory | Median inventory fell to 89.3 days on hand, down 5.9 days YoY, while Q2 shipment volume fell 2.8% and shipper spending rose 28.1% | Connect SKU-node inventory, arrival confidence, carrier alternatives, margin, and promise dates so expedite and allocation decisions occur before a stockout | Logistics Management / FreightWaves |
| Cold-storage rebalancing | Lineage has idled 15 facilities since last year while same-warehouse occupancy reached 75.8%; about 60% of U.S. markets reportedly lacked excess cold-storage supply | Rebalance by SKU, temperature class, shelf life, customer radius, reefer capacity, and service outcome rather than treating national vacancy as usable local capacity | FreightWaves |
| Decision rights for logistics leaders | Average logistics pay rebounded to $126,400; 32% of C-suite respondents and 25% of supply chain leaders expect AI to fundamentally reshape roles in 2026 | Put authority limits, required evidence, response deadlines, and escalation paths directly into transportation, compliance, automation, and emergency-spend workflows | Logistics Management / Food Logistics |
| Ocean contracting signals | ONE tripled its FY2026 profit outlook from $300M to $900M, despite Q1 net profit of only $31M on $4.539B revenue | Translate carrier headlines into lane-level allocation, blank-sailing, surcharge, equipment, and schedule-reliability evidence before changing contract commitments | FreightWaves |
| Inland rail gateway optionality | Port of Virginia offers a stated five-day Indianapolis service after an $83M rail-yard investment; U.S. intermodal volume rose 4.8% YoY in the week ending August 1 | Pilot gateways with port-to-door percentile transit, rail dwell, availability, final-mile appointment, free-time, and empty-return scorecards | Supply Chain Dive / FreightWaves |
| Reusable cold-chain assets | Cold-chain packaging is projected to grow at a 19.6% CAGR through 2030, while robust reusable containers can remain in service for 15+ years | Join shipment and asset records across issue, custody, delivery, return, cleaning, qualification, and redeployment; measure cost and loss per completed turn | Food Logistics / Inbound Logistics |
| Freight cost-to-volume disconnect | Shipper spending rose 28.1% YoY despite lower volume; LTL cost per shipment rose 0.7% sequentially while weight per shipment fell 4.8% | Build a weekly cost bridge separating volume, rate, mode, lane, shipment profile, fuel, accessorial, and service-failure effects before procurement or operations acts | FreightWaves — Q2 spending / FreightWaves — TL/LTL |
The cross-cutting insight is blunt: logistics technology is becoming a context engine. The same shipment event can justify a different action depending on inventory exposure, carrier health, asset eligibility, decision authority, lane reliability, or total-cost cause. The durable advantage is not another alert; it is a governed record that explains the decision, releases the action, and reconciles the outcome.
New Insights from August 8, 2026 Posts
August 8 coverage showed that business continuity is becoming a transaction-level discipline. A recovery plan, capacity forecast, sourcing target, or compliance policy only becomes executable when systems preserve the minimum trusted record, rank competing work, enforce release gates, and prove each handoff through normalization.
| Signal | Reported statistic | Technology and workflow implication | Source |
|---|---|---|---|
| Cyber-safe warehouse restart | Eight warehouses disrupted | Keep isolated offline data packs, bounded manual work queues, unique transaction IDs, and digital reconciliation gates | FreightWaves / CXTMS August 8 analysis |
| Agricultural export concentration | 13 cargoes, approximately 780,000 metric tons | Gate quality, inland capacity, storage, vessel nomination, and final accumulation rather than flooding the network | Reuters / CXTMS August 8 analysis |
| Border-lane allocation | Mexican exports up roughly 15%; spot rates up 10%+ | Score freight by contribution, urgency, penalties, alternatives, and recovery; price customs, dwell, transfer, and failure risk | FreightWaves / CXTMS August 8 analysis |
| Savings-to-shipment governance | $2B transformation target, $1.2B from procurement | Carry sourcing baselines through freight, service, inventory, and finance records until savings are realized | Supply Chain Dive / CXTMS August 8 analysis |
| Retail migration gates | 1.4M sq. ft. DC and $100M savings target | Use store-service exit criteria and controlled migration waves instead of declaring success at system go-live | Supply Chain Dive / CXTMS August 8 analysis |
| Identity and custody controls | 392 vehicles worth C$28M recovered | Link VIN, title, party, booking, container, seal, and terminal events before cargo reaches the gate | CXTMS August 8 analysis |
| Labor recovery milestones | 42-day strike; three ports affected | Separate return-to-work status from berth reopening, throughput recovery, and backlog clearance | FreightWaves / CXTMS August 8 analysis |
| Environmental shipment proof | 6.8M gallons liquid and 5,400 tons solid waste | Make manifest validity, approved route, destination acceptance, quantity reconciliation, and disposal closure release conditions | Reuters / CXTMS August 8 analysis |
The new cross-cutting insight is that continuity cannot be a static plan stored outside execution. The same control pattern now applies across cyber recovery, scarce capacity, network migrations, cargo security, labor events, and regulated freight: preserve a trusted baseline, assign decision rights, release work in measured stages, and close the loop with auditable physical evidence.
New Insights from August 7, 2026 Posts
August 7 coverage made the operating model more explicit: logistics technology must convert commercial terms, quality evidence, qualification milestones, capacity signals, and recovery deadlines into release-or-hold decisions at shipment level.
| Signal | Reported statistic | Technology and workflow implication | Source |
|---|---|---|---|
| Warehouse cyber continuity | A cyberattack disrupted eight CEVA Logistics warehouses in Europe | Maintain isolated inventory/order snapshots, numbered offline transactions, tiered restart limits, and reconciliation gates rather than treating WMS availability as operational recovery | FreightWaves / CXTMS August 8 analysis |
| Soybean export release | Chinese state traders purchased at least 13 cargoes; at roughly 60,000 metric tons each, the program represents about 780,000 metric tons | Convert commercial demand into gated origin, barge/rail, elevator, inspection, terminal, and vessel capacity before releasing inventory | Reuters / CXTMS August 8 analysis |
| Cross-border truck scarcity | Mexican exports rose roughly 15%, spot rates climbed more than 10%, and Canadian imports reached $72.1B | Rank border freight by margin, time sensitivity, penalties, alternate crossings, and recovery difficulty; compare true landed service cost rather than linehaul alone | FreightWaves / CXTMS August 8 analysis |
| Procurement value realization | Kraft Heinz targeted $2B in supply chain savings, including $1.2B from procurement; identical inputs showed 20%-30% price differences | Reconcile negotiated price, logistics variance, service impact, and finance realization in a shipment-level value ledger | Supply Chain Dive / CXTMS August 8 analysis |
| Retail network migration | Macy's 1.4M-square-foot China Grove facility followed 35 store mini-DCs and a $100M savings target | Release migration waves only after store-service, inventory, carrier, fulfillment, and exception thresholds pass defined exit criteria | Supply Chain Dive / CXTMS August 8 analysis |
| Premium ocean contract signal | Matson Q2 net income rose 36.6% to $129.4M, revenue rose 16.7% to $969.4M, and EPS rose 46.2% | Separate premium-lane yield and utilization from broad import demand before changing allocations or contract timing | FreightWaves / CXTMS August 8 analysis |
| Last-mile labor concentration | Amazon delivered 6.7B U.S. packages in 2025, ahead of USPS at 6.6B | Model contractor, station, route, and jurisdiction exposure as measurable capacity and pre-authorize diversion triggers | Reuters / Supply Chain Dive |
| VIN-level export security | Project NoCargo recovered 392 vehicles worth C$28M, about C$71,400 per vehicle | Use VIN as the primary key across title, seller, exporter, booking, container, seal, and gate events; stop malformed, duplicate, stolen, or mismatched identities upstream | CXTMS August 8 analysis |
| Port labor recovery | A sugar strike lasted 42 days and triggered sympathy walkouts at three ports | Track negotiations, return to work, berth/gate reopening, and backlog clearance as separate milestones with throughput-based recovery thresholds | FreightWaves / CXTMS August 8 analysis |
| Remediation-freight custody | East Palestine cleanup moved 6.8M gallons of liquid waste and 5,400 tons of solid waste by March 2023 | Bind manifests, carrier credentials, equipment, approved routes, appointments, weights, geofenced events, and disposal certificates into one immutable load record | Reuters / CXTMS August 8 analysis |
| Autonomous lane economics | Aurora targets >$2/mile TaaS, >$0.85/mile DaaS, and 200+ trucks by year-end | Compare door-to-door cost, utilization, terminal handoffs, empty miles, insurance, and fallback service—not headline mileage rates | FreightWaves |
| Food withdrawal recovery | FSMA 204 compliance moved 30 months to July 20, 2028 | Join lot traceability, store withdrawal, alternate-supplier release, replacement transport, and time-to-recover in one event trail | Supply Chain Dive / Food Logistics |
| Digital quality release | More than 60% of fashion executives ranked integrated digital processes among their top five digitization priorities | Lab results and document validation should automatically change lot, PO, carton, and shipment eligibility | Supply Chain Dive / McKinsey |
| Equipment-specific capacity | Flatbed spot rates reached $4.32/mile with rejection above 38% | Maintain separate van, reefer, and flatbed triggers, carrier pools, accessorial assumptions, and customer escalation rules | FreightWaves |
| Aerospace backlog readiness | Honeywell reduced organic growth guidance to 4%-5% from 7%-9% | Separate ordered, material-ready, production-ready, quality-released, and shipment-ready backlog before promising revenue or capacity | Reuters |
| Critical-mineral qualification | Three-quarters of affected companies were seeking alternatives to constrained Chinese minerals | Track chemistry, pilot lots, testing, engineering approval, scale readiness, origin, and transport milestones as one qualification-to-delivery file | Reuters / CXTMS August 7 analysis |
| Regional air capacity | Four grounded A321 freighters removed about 210 metric tons daily | Segment freight by main-deck need, security, connection tolerance, road-feeder feasibility, alternate gateway, and recovery deadline | FreightWaves |
| Refund settlement | $127B in refunds was linked to 56,497 importers that completed electronic steps | Connect customs entries, importer identity, supplier agreements, SKU landed cost, customer credits, and finance reconciliation | Reuters |
| Rail market divergence | Total traffic rose 2.4%, carloads fell 0.4%, and implied intermodal rose about 4.8% | Build commodity- and lane-level rail dashboards rather than using total traffic as a procurement trigger | FreightWaves / AAR |
| Store recovery clock | Starbucks targets 24-hour replenishment and cut menu SKUs 30% | Measure detection, decision, allocation, dispatch, delivery, shelf recovery, and repeat-failure time before automating the workflow | Supply Chain Dive |
The new cross-cutting insight is that logistics platforms are becoming release engines. They must decide whether a load, lot, supplier, refund, mode, aircraft option, autonomous lane, or store recovery plan is commercially complete and operationally qualified—and preserve the evidence behind that decision.
New Insights from August 9, 2026 Posts
August 9 coverage showed that logistics data now determines both operational eligibility and financial value. The same underlying record can release a driver, support a customs entry, price a refund claim, qualify a tanker, protect a terminal shift, or stop an invalid movement before it creates cost and liability.
| Signal | Reported statistic | Technology and workflow implication | Source |
|---|---|---|---|
| TMS acquisition migration | BlueGrace serves 10,000+ customers through a network of 250,000+ carriers | Inventory identities and transformations, dual-run live freight, cut over in bounded waves, and verify business exit criteria | FreightWaves / CXTMS August 9 analysis |
| Pre-dispatch driver compliance | Federal enforcement produced 766 out-of-service orders; a measured fleet still recorded a 9.28% inspection OOS rate | Revalidate driver, authority, credential, equipment, and load eligibility at dispatch rather than relying on onboarding snapshots | FMCSA coverage / Food Logistics / CXTMS August 9 analysis |
| Expiring fuel-routing authority | Jones Act waiver expires August 16 while gasoline remained above $4 per gallon | Attach legal validity windows to booking, loading, sailing, and delivery milestones; compare coastal and inland contingencies before the option vanishes | FreightWaves / CXTMS August 9 analysis |
| Oaxaca project-logistics demand | MX$37.8B ($2.2B) regional program within MX$5.6T ($323B) of national investment through 2030 | Convert work packages into time-phased loads and map shared equipment, access, permits, staging, and seasonal dependencies | SupplyChainBrain / Reuters / CXTMS August 9 analysis |
| Polysilicon importer-of-record controls | 15% tariff effective December 4; China holds an estimated 93.5% market share | Join product hierarchy, material origin, importer identity, minimum-price rules, and landed-cost scenarios to each customs entry | Supply Chain Dive / SupplyChainBrain / CXTMS August 9 analysis |
| Tariff-refund working capital | Children's Place sold $38.2M of claims for about $25.7M; CBP had paid $100B by July 31 | Treat entry, payment, ownership, assignment, shipment, and reconciliation records as a finance-grade evidence package | Supply Chain Dive / CXTMS August 9 analysis |
| Beef cold-chain allocation | U.S. cattle supplies reached a 74-year low and Tyson reported $850M in additional quarterly cattle costs | Allocate constrained volume with shelf life, margin, customer commitments, substitute products, and reefer capacity in one scenario model | Reuters / CXTMS August 9 analysis |
| USPS parcel economics | Q3 revenue approached $20B; an 8% surcharge helped parcel revenue rise 7.7% while volume fell 3.4% | Test surcharge-inclusive cost against delivery performance, shipment profile, and carrier alternatives before changing the parcel mix | FreightWaves / CXTMS August 9 analysis |
| Tacoma terminal expansion | $135M investment raises annual capacity from 590,000 to 880,000 TEUs, about 49%, by 2030 | Model berth, crane, yard, chassis, gate, rail, and peak-shift throughput together; pilot shifts using percentile dwell and missed-connection evidence | FreightWaves / CXTMS August 9 analysis |
The cross-cutting insight is that eligibility has become a shared operating primitive. Logistics platforms should maintain effective dates, identity links, qualification evidence, ownership rights, capacity dependencies, and valuation assumptions as first-class records—then use them to release, hold, reroute, or finance each movement with an auditable reason.
New Insights from August 10, 2026 Posts
August 10 coverage showed that capacity must be qualified before it can be trusted. An aircraft allocation, customs entry, emergency carrier, electric forklift, border lane, port gateway, conveyor line, or terminal system may look available while still failing the timing, evidence, energy, cost, or throughput conditions required to move freight reliably.
| Signal | Reported statistic | Technology and workflow implication | Source |
|---|---|---|---|
| Short-term airfreight procurement | 58% of new contracts lasted three months or less, up from 22%; forwarders bought nearly 50% of Q2 volume on spot | Maintain a rolling lane calendar for base, surge, and emergency capacity with review dates, release rules, and escalation triggers | Supply Chain Dive / CXTMS August 10 analysis |
| Customs maker-checker governance | Everlight agreed to a $5.2M settlement; 2026 False Claims Act customs recoveries exceeded $570M in five months | Require independent approval, source evidence, version history, and entry-to-finance reconciliation before transmission | FreightWaves / CXTMS August 10 analysis |
| Disaster logistics readiness | Natural disasters produced $108B in global insured losses in 2025 | Keep a live registry of verified carriers, equipment, warehouses, cold storage, contacts, and activation constraints rather than sourcing during a crisis | Reuters / CXTMS August 10 analysis |
| Warehouse fleet electrification | Electric units represent about 70% of North American lift-truck sales; Toyota opened a $100M, 295,000-square-foot electric-forklift facility | Convert work by zone and shift into truck-hours and kilowatt-hours; gate rollout on utility, charger, maintenance, and training evidence | Modern Materials Handling / CXTMS August 10 analysis |
| Mexico corridor concentration | Mexico supplies roughly 16%-17% of U.S. imports versus China's 7.2%; about 88% of Mexican goods enter duty-free under USMCA | Translate purchase orders into crossing-specific truck, broker, yard, appointment, and customs requirements before national growth overwhelms local nodes | FreightWaves / CXTMS August 10 analysis |
| Gateway velocity | New York-New Jersey handled 503,016 loaded TEUs, up 7.6%, while total June volume rose 11.9% | Score gateways on release time, appointment latency, dwell, rail/drayage handoffs, and delivery completion—not quay volume alone | FreightWaves / CXTMS August 10 analysis |
| Predictive conveyor capacity | Smart conveyor systems are projected to reach $27.8B by 2035 | Translate motor condition and derating into carton-throughput loss, backlog, cutoff, appointment, and customer-promise risk | Modern Materials Handling / CXTMS August 10 analysis |
| Peak-season order reset | Transpacific West Coast rates peaked above $7,500/FEU, then fell about 20% to roughly $6,000 | Reconcile demand, purchase-order, booking, and inventory ledgers before accepting more sailings or mistaking front-loading for durable demand | FreightWaves / CXTMS August 10 analysis |
The cross-cutting insight is that operational capacity now needs a qualification file. Logistics platforms should connect availability to effective dates, evidence, power, labor, physical throughput, cost-to-serve, and recovery options—then release capacity only when the full operating promise is executable.
New Insights from August 11, 2026 Posts
- Operational evidence became a release, close, and reversal control. August 11 coverage connected aircraft inspection campaigns, shipment-level inflation attribution, container seal events, demurrage dispute clocks, LTL dimensions, trailer-pool balancing, electronic proof of delivery, reefer pre-trip inspections, offshore-wind demobilization, and multi-NVOCC custody into one rule: logistics systems must preserve the evidence that authorizes work to start, stops suspect movement, closes financial and inventory records, and unwinds commitments when the plan changes.
The new articles showed that visibility is most valuable at a decision boundary. A part is not available merely because it is on hand; it must be eligible and positioned for a specific maintenance slot. A seal number is not security evidence without verified custody events. A delivery signature is not operational closure unless it updates claims, inventory, and billing. A canceled capital project is not closed until every reservation, component, deposit, and custody obligation has a documented disposition.
| Signal from August 11 coverage | Reported statistic | Technology and workflow implication | Source |
|---|---|---|---|
| Aerospace MRO campaign readiness | Boeing was repairing as many as 25 undelivered 737 MAX jets for a separate wiring issue; an earlier MAX 9 event temporarily grounded 171 aircraft | Reserve eligible parts, tooling, labor, transport, and documentation against a tail number and maintenance slot; measure parts-caused aircraft-on-ground hours | Reuters / Reuters / CXTMS August 11 analysis |
| Shipment-level inflation bridge | Clorox expects more than $200M in inflation and about 42% gross margin, versus 42.3% previously; its ERP program was valued at $500M | Reconcile purchase-price variance, inventory timing, shipment charges, and customer profitability instead of embedding avoidable disruption premiums in a broad inflation baseline | Supply Chain Dive / CXTMS August 11 analysis |
| Container seal chain of custody | U.S. cargo theft rose 16% YoY in 2025; Q3 recorded 645 incidents, up 29% YoY | Replace one editable seal field with append-only applied, verified, broken, replaced, and exception events; block movement on mismatches | FreightWaves / Inbound Logistics / CXTMS August 11 analysis |
| Demurrage and detention evidence clock | Carriers collected about $6.9B in detention and demurrage costs from 2020-2022; an NVOCC can receive an additional 30 calendar days in specified billing chains | Assemble availability, free-time, gate, appointment, return, invoice, and dispute evidence before the invoice arrives; route deadline exceptions automatically | Supply Chain Dive / FreightWaves / CXTMS August 11 analysis |
| Density-based LTL classification | NMFTA estimates 70%-80% of LTL freight is now classified by density alone; the scale expanded to 13 density subprovisions | Govern packaging-level dimensions, gross weight, measurement method, effective dates, reclassification evidence, and invoice audit as financial master data | FreightWaves / CXTMS August 11 analysis |
| Cold-chain release evidence | A complete reefer PTI can include 15 critical tests; connected monitoring can achieve 0.5°C sensor accuracy | Join equipment identity, diagnostic results, commodity range, setpoint, loading temperature, calibration, seal, and approval into stop-load logic | Food Logistics / CXTMS August 11 analysis |
| Offshore-wind demobilization | RWE agreed to a $1.22B cancellation covering three U.S. offshore-wind lease areas; TotalEnergies redirected nearly $1B from U.S. offshore wind | Replace forward project milestones with a demobilization ledger for vessel and port reservations, components, deposits, custody, reuse, claims, and closure | Reuters / CXTMS August 11 analysis |
Technology use cases added on August 11
- AI and decision support: rank MRO shortages by aircraft availability risk, classify structural versus temporary inflation, detect seal or invoice discrepancies, and translate equipment-condition signals into release decisions while retaining human approval and source evidence.
- Workflow automation: start 30-day dispute checkpoints, place security and cold-chain holds, trigger repair bills of material, rebalance trailer pools, and route electronic proof of delivery into claims, inventory, and billing outcomes.
- Visibility and identity: link tail numbers, serialized parts, containers, seals, trailers, reefer units, house and master bills, orders, and delivery evidence without overwriting prior references or custody states.
- Financial control: connect shipment charge codes to landed cost, preserve every buy and sell layer in LCL consolidation, audit density-driven LTL reclassification, and close cancellation liabilities against documented disposition.
- Resilience and reverse logistics: pre-position scarce repair kits, define trailer-pool recovery triggers, preserve reefer stop-load alternatives, and manage project-cargo demobilization as a reverse milestone program.
New Insights from August 12, 2026 Posts
- Coordination became a capacity and permission control. August 12 coverage connected Amazon's air-ground operating model, auto-hauling consolidation, frozen-warehouse exits, small-fleet AI agents, fertilizer allocation, warehouse demand signals, EDI resilience, postal stress testing, fulfillment-site modeling, and structured warehouse exceptions into one rule: logistics systems must prove that the handoff, authority, integration, asset, and fallback are qualified before treating nominal capacity as executable capacity.
The new articles also sharpened the distinction between visibility and control. Seeing an aircraft arrive does not protect the ground connection; seeing an AI recommendation does not authorize a price or payment change; seeing warehouse activity expand does not prove that docks, labor, power, or carrier capacity can absorb it. The operating advantage comes from joining those signals to explicit release rules, owners, limits, and recovery paths.
| Signal from August 12 coverage | Reported statistic | Technology and workflow implication | Source |
|---|---|---|---|
| Air-ground connection control | Amazon Air operates 100+ aircraft and 250+ daily flights | Use a shared event schema, connection-level KPIs, and one exception queue across flight arrival, sort completion, linehaul departure, and final delivery | Supply Chain Dive / CXTMS August 12 analysis |
| Auto-hauling concentration | A $130M acquisition creates a network moving 4M+ vehicles annually, roughly 25% of the new-car market | Rebuild carrier master data after M&A, measure capacity by operating entity and lane, and trigger alternatives when concentration or service thresholds are breached | FreightWaves / CXTMS August 12 analysis |
| Automated cold-storage exit | Two canceled facilities produced an expected $305M-$320M impairment | Define inventory, customer-service, labor, transport, equipment, and temperature-proof exit gates before transferring the first pallet | Supply Chain Dive / CXTMS August 12 analysis |
| AI-agent permission boundaries | A freight platform had processed $9B in invoices; 80% of organizations reported risky agent behavior | Separate observe, recommend, approve, and autonomous permissions; hard-stop unauthorized pricing, tender, driver, customer-data, and payment actions | FreightWaves / McKinsey |
| Fertilizer allocation | 2026 potash shipments were forecast at 74M-77M metric tons; one shipper incurred $800,000 in extra freight cost from poor rail service | Synchronize product and transport commitments, rank customers and lanes, and monitor car-cycle velocity as usable capacity | Reuters / CXTMS August 12 analysis |
| Warehouse-to-freight demand signal | Prologis IBI reached 59.3 while warehousing capacity fell from 47.5 to 46.3 and prices rose from 73.8 to 75.5 | Combine regional facility activity with inventory dwell, dock appointments, tender acceptance, and shipment history before changing capacity commitments | Logistics Management / CXTMS August 12 analysis |
| EDI and third-party cyber resilience | One supplier breach affected 44 large shippers and nearly 1M recipients; 61% of cyber leaders reported a third-party or supply-chain attack | Monitor both technical availability and document completeness, reconcile missing acknowledgments, and set recovery targets around shipment impact | FreightWaves / CXTMS August 12 analysis |
| Postal-network stress | USPS posted a $2.5B quarterly loss as revenue fell 6.1% to $19.9B | Stress-test the real parcel file by dimensions, zones, consolidator dependence, service evidence, surcharges, and alternate-carrier capacity | Logistics Management / CXTMS August 12 analysis |
| Regional fulfillment capacity | Walmart proposed a roughly 1.5M-square-foot New York fulfillment center | Convert usable space and order demand into hourly throughput, dock schedules, labor work content, inventory placement, and parcel/replenishment cost | Supply Chain Dive / CXTMS August 12 analysis |
| Human-in-the-loop warehouse exceptions | 1.9M manufacturing jobs may go unfilled over a decade; five AGV tenders can oversee a 50-truck automated fleet | Turn radio chatter into typed exceptions with owners, timestamps, escalation rules, resolution codes, and departure-impact metrics | Modern Materials Handling / CXTMS August 12 analysis |
The cross-cutting insight is that coordination itself has become measurable infrastructure. The next generation of logistics platforms will not merely display activity across modes, facilities, partners, and agents. It will qualify who or what may act, verify that every dependency is ready, and preserve the evidence needed to release, recover, or reverse the operation.
New Insights from August 13, 2026 Posts
- Decision-grade context became the bridge between market signals and physical execution. August 13 coverage connected rail research, infrastructure finance, postal routing, port-rail dwell, fashion expediting, LNG fleet consolidation, industrial-battery continuity, beverage-network reconfiguration, CPG reformulation, and rail-crew contingencies into one rule: a headline, model, asset, or alternate route has operational value only when it is translated into shipment-level eligibility, timing, cost, ownership, and recovery controls.
The newest posts showed why raw scale is a poor proxy for usable capacity. A $250 billion financing initiative is not a freight order; a 4.7 million-TEU rail facility does not guarantee a 24-hour connection; a larger LNG fleet does not eliminate vessel-compatibility or contract-transition risk; and lower inventory does not automatically justify airfreighting every delayed SKU. Logistics systems create value by converting these signals into qualified scenarios and measurable release gates.
| Signal from August 13 coverage | Reported statistic | Technology and workflow implication | Source |
|---|---|---|---|
| Rail analytics and demand | North American rail traffic rose 3.6% YoY in Week 31; carloads increased 3.9% and intermodal 3.3% | Convert research findings into governed lane hypotheses, pilot cohorts, baselines, and shipper-facing service outcomes before changing routing policy | FreightWaves / AAR data coverage / CXTMS August 13 analysis |
| Infrastructure project pipeline | Bank of America targeted $250B in financing and related activity through July 4, 2027; cited superload permits can take one to six months | Stage-gate financial signals through permitting, procurement, route surveys, escorts, specialized equipment, and site-readiness milestones before reserving capacity | SupplyChainBrain / Inbound Logistics |
| Postal entry-point optimization | A first dropship mailing involved about 2M pieces; USPS highway transportation expense approached $1.6B, up 4.1% YoY | Select induction points shipment by shipment using linehaul, postal discounts, acceptance rules, cutoff risk, and in-home delivery windows | Inbound Logistics / Supply Chain Dive |
| Port-to-rail velocity | Long Beach Pier B targets rail dwell near 24 hours, with planned annual capacity rising from 2M to 4.7M TEUs on an $870M investment | Measure discharge-to-departure dwell distributions, missed connections, demurrage, train-slot use, and final-delivery reliability rather than relying on headline capacity | FreightWaves / Supply Chain Dive |
| Fashion expedite margin gate | Capri inventory fell 20% YoY to $624M and Michael Kors inventory fell 25%; the outlook was reduced by $50M | Approve air or faster-ocean recovery only when SKU-level full-price margin, demand window, landed expedite cost, and no-action loss support intervention | Supply Chain Dive / CXTMS August 13 analysis |
| LNG carrier transition | SK Shipping is set to receive 16 LNG carriers while H-Line receives 12 tankers and about $300M; SK would operate 32 LNG carriers | Preserve vessel-contract-document identity, compatibility records, nomination rights, and transition ownership before treating consolidated fleet scale as charterer optionality | Reuters |
| Product and supplier cutovers | Natural alternatives can cost 2x-5x more than synthetic ingredients | Use versioned material, supplier, lot, packaging, approval, warranty, and disposition records to prevent old/new product or equipment configurations from mixing | SupplyChainBrain / CXTMS August 13 analysis |
| Rail service contingency | U.S. railroads handled 526,410 units in the week ending Aug. 1, up 2.4% YoY; intermodal rose 4.8% | Separate crew, network, equipment, and shipper-controlled delay codes; connect missed departures to recovery frequency, inventory exposure, and pre-priced mode alternatives | FreightWaves / AAR traffic coverage |
The cross-cutting insight is that context is now a control object. Operators need models that retain the effective date, source, assumptions, eligible assets, accountable owner, cost boundary, and recovery trigger behind each recommendation. That is what turns research, investment, M&A, infrastructure, and disruption news into safer transportation decisions.
New Insights from August 14, 2026 Posts
- Constraint-aware commitment control became the operating layer between market signals and execution. August 14 coverage connected lift-truck charging, freight mini-bids, air-cargo allotments, ocean-carrier sale risk, packout automation, Panama Canal draft limits, port-centric LTL handoffs, rail-truck substitution, and AI routing into one rule: logistics systems should not commit capacity, contracts, routes, or customer promises until they have tested the physical constraint, economic threshold, release rule, and fallback.
The day's posts also sharpened a recurring 2026 lesson: aggregate availability is not executable capacity. A global airfreight average can hide opposite lane conditions. Matching rail and truck growth can hide active modal substitution. A port, charger, carrier contract, or packaging line may be available in theory while the shipment still fails a weight, cutoff, energy, acceptance, or throughput constraint.
| Signal from August 14 coverage | Reported statistic | Technology and workflow implication | Source |
|---|---|---|---|
| Shift-level lift-truck energy | 58% of surveyed companies use electric rider trucks; 49% use fleet software | Convert workload into truck-hours and kilowatt-hours by shift, then schedule charging around usable energy, charger limits, battery condition, and peak demand | Modern Materials Handling / CXTMS August 14 analysis |
| Lane-level freight repricing | Tender rejection exceeded 14% in parts of 2026; one-way contract renewals were rising by low double digits | Use mini-bids only on lanes whose acceptance, forecast, market, and total recovery cost cross defined thresholds; measure realized rather than awarded savings | FreightWaves / CXTMS August 14 analysis |
| Air-cargo capacity release | July spot rates fell 6% MoM to $3.12/kg but remained 28% YoY higher; Asia-to-North America rates rose 33% while Europe-to-North America fell 27% | Replace blanket peak commitments with lane-level retain, release, and buy-back checkpoints tied to utilization, inventory risk, modal alternatives, and landed cost | Supply Chain Dive / CXTMS August 14 analysis |
| Ocean-carrier continuity | The proposed transaction was valued at $4.2B and could lift market share from about 7% to just under 9% | Map contract, allocation, sailing, equipment, and secondary-carrier exposure before ownership or regulatory uncertainty reaches active bookings | Reuters / CXTMS August 14 analysis |
| End-of-line packout capacity | A scan-label-apply-manifest line can process 20-30 packages per minute with one operator | Measure the full order-to-carrier handoff, including packaging exceptions, label quality, induction cutoff, and trailer departure—not isolated machine speed | Modern Materials Handling / CXTMS August 14 analysis |
| Panama Canal draft and queue risk | 113 vessels were waiting; delays reached 10 days; the average priority-slot auction reached $1.1M | Apply a cargo-weight decision tree that compares draft eligibility, inventory priority, discharge options, transloading, alternate gateways, and total delay cost before loading | SupplyChainBrain / CXTMS August 14 analysis |
| Container-to-pallet handoff | An integrated Savannah operation reported zero demurrage or detention and removed 100% of delay and merge costs | Start one clock at container availability and assign milestones, owners, cutoffs, and recovery actions through drayage, unload, palletization, LTL tender, and departure | Supply Chain Dive / CXTMS August 14 analysis |
| Rail-truck modal substitution | Both modes grew 4.4% over three months; intermodal can cost 8%-18% less and reduce emissions by up to 75% | Score substitution lane by lane using door-to-door cost, service fit, volume consistency, inventory tolerance, emissions, and operational feasibility | FreightWaves / Inbound Logistics / CXTMS August 14 analysis |
| AI dynamic-routing baseline | USPS has 35+ active AI use cases while reporting a $2.5B quarterly loss | Establish route-level service, labor, mileage, cost, and exception baselines before deployment; retain human release authority and measure net value after each pilot | Supply Chain Dive / CXTMS August 14 analysis |
Technology use cases added on August 14
- AI and optimization: dynamic postal routing, lane-level modal scoring, air-capacity retention, and cargo-weight routing with explicit constraints and explainable release decisions.
- Warehouse automation and energy: shift-level charger scheduling, battery-health-aware fleet dispatch, and end-of-line packout orchestration tied to carrier cutoffs.
- Transportation procurement: surgical mini-bids, realized-savings measurement, ocean-carrier concentration monitoring, and alternate-capacity triggers.
- Multimodal visibility: one event clock spanning vessel availability, drayage, palletization, LTL tender, canal constraints, and final departure.
The cross-cutting insight is that the next generation of logistics software will be judged less by how many options it can display than by how reliably it can refuse a bad commitment. Constraint-aware systems must know when capacity is physically usable, when a contract is economically credible, when a route remains eligible, when a handoff can meet its cutoff, and which fallback is already qualified.
New Insights from August 15, 2026 Posts
- Evidence quality became the control layer for operational risk. August 15 coverage connected 3PL scorecards, food traceability, cold-storage safety, brokerage integration, carrier qualification, sustainable packaging, port handoffs, supplier recovery, automation maintenance, and procurement fraud into one rule: an average, certificate, status, or invoice is not enough. Logistics systems need source-level evidence, defined ownership, effective dates, exception thresholds, and outcome records before they release freight, approve spend, or declare recovery complete.
| Signal from August 15 coverage | Reported statistic | Technology and workflow implication | Source |
|---|---|---|---|
| Carrier qualification and capacity | Landstar reduced its approved pool from 100,000+ to about 64,600 carriers, a 35% reduction; Q2 truck revenue rose 19% YoY while loads increased about 2% | Link authority, insurance, safety, identity, expiry dates, and lane eligibility directly to tendering; monitor whether tighter qualification creates capacity concentration | FreightWaves / CXTMS August 15 analysis |
| Warehouse automation maintenance | 52% cited skilled-technician hiring as the top challenge; 51% reported a shortage of one to five automation technicians and 20% a gap of six to 25 | Connect CMMS faults, technician availability, spares, equipment dependencies, wave capacity, dock appointments, and carrier cutoffs in one response plan | Modern Materials Handling / CXTMS August 15 analysis |
| Food traceability evidence | Foodborne illness affects about 48M Americans annually, hospitalizes 128,000, and causes 3,000 deaths; a reported recall year involved 419M units | Make supplier approval, lot identity, temperature, custody, documents, and release rules machine-checkable even as regulatory deadlines move | Food Logistics / CXTMS August 15 analysis |
| Automation-era warehouse safety | OSHA estimates roughly 85 forklift fatalities, 34,900 serious injuries, and 61,800 non-serious injuries annually | Combine near misses, equipment events, shift conditions, appointments, dwell, and corrective actions so safety becomes a leading-indicator workflow | Modern Materials Handling / CXTMS August 15 analysis |
| Procurement fraud controls | A warehouse-equipment kickback case produced more than $16.3M in losses; 2025 retail returns totaled $706B, with about $100B lost to preventable fraud and abuse | Enforce separation of duties, four-eye approvals, vendor concentration alerts, invoice-to-asset matching, and immutable transaction histories | FreightWaves / Inbound Logistics |
| Sustainable packaging proof | More than 82% of end users are actively engaged in sustainability adoption | Test package changes against shipment weight, cube, damage, handling, utilization, returns, and lifecycle assumptions rather than material claims alone | Modern Materials Handling / CXTMS August 15 analysis |
| Supplier recovery orchestration | Volvo and its logistics partner activated a 180,000-square-foot recovery hub and moved initial material in about nine days | Run recovery cells from a shared part-priority, inventory, capacity, milestone, premium-freight, and exit-control record | Logistics Management / CXTMS August 15 analysis |
| Port handoff quality | Los Angeles-Long Beach local truck cargo averaged 2.59 days at terminals; one dwell-fee design adds $45 per day beginning on day eight | Preserve original terminal, customs, appointment, gate, rail, and warehouse timestamps; score gateway service by lane and mode before free time expires | FreightWaves / Supply Chain Dive |
Technology use cases added on August 15
- AI and analytics: anomaly detection for procurement and invoices, confidence-weighted provider scorecards, qualification-expiry alerts, and recovery-priority ranking.
- Automation and robotics: maintenance dependency maps, blast-radius scoring, spare-parts visibility, and transport-aware downtime response.
- Visibility and compliance: lot-level food evidence, original port-event timestamps, carrier eligibility ledgers, and shipment-level packaging proof.
- Operational governance: lane-segmented 3PL scorecards, near-miss workflows, four-eye approvals, M&A data reconciliation, and recovery-cell exit gates.
The new insight is that evidence must change execution, not merely support an audit afterward. A carrier expiry should block an ineligible tender, a missing lot record should hold release, a maintenance fault should recalculate outbound capacity, a port timestamp should start a recovery clock, and an anomalous invoice should route to independent review.
New Insights from August 16, 2026 Posts
- Eligibility, human capacity, and change authority converged into one release-control problem. August 16 coverage connected air-cargo capacity, drone origin rules, automotive sourcing cutovers, industrial investment, low-code WMS governance, forklift safety events, transshipment evidence, compliance costing, driver health, and parcel labor contingency into one rule: logistics systems must prove that the product, route, asset, workforce plan, software change, and commercial fallback are eligible and sustainable before execution begins.
| Signal from August 16 coverage | Reported statistic | Technology and workflow implication | Source |
|---|---|---|---|
| Air-cargo booking control | DHL invested $204M in Shenzhen, lifting daily processing to 992 tons and expected annual throughput above 286,000 tons | Separate terminal throughput from flight allocation; preserve cutoffs, confirmed uplift, rollover limits, recovery routes, and lane-level service outcomes | FreightWaves / CXTMS August 16 analysis |
| Drone origin and tariff eligibility | Certain drones and components face a 100% tariff; U.S. allegations identify 40+ countries in suspected tariff circumvention | Gate tendering on SKU, bill-of-material, supplier-site, transformation, origin, classification, route, and effective-date evidence | Supply Chain Dive / SupplyChainBrain |
| Automotive sourcing cutover | Ford sold 36,544 China-assembled Lincoln Nautilus vehicles in the cited year and estimated tariffs could add $2.5B annually across its business | Give each VIN and component a versioned cutover state spanning last buy, production, import authority, customs release, dealer allocation, service parts, and financial exposure | Supply Chain Dive / Reuters |
| Industrial logistics readiness | Defense agreements committed $2.03B to battery cells and critical minerals | Score supplier capacity, inbound lanes, utilities, warehousing, outbound capacity, data controls, milestones, and recovery plans before production ramps | Supply Chain Dive / CXTMS August 16 analysis |
| Low-code WMS governance | 55% of supply chain leaders are increasing technology investment and 60% plan to spend more than $1M | Risk-tier citizen-developed workflows; require testing, approval, versioning, rollback, identity controls, integration monitoring, and post-release stability measures | MHI / CXTMS August 16 analysis |
| Forklift safety event streams | A German deployment covers about 50 high-rack trucks; OSHA estimates proper training and policy could prevent about 70% of forklift incidents | Normalize detection, slowdown, stop, location, operator, shift, layout, and corrective-action events across telematics, WMS, labor, and safety systems | Modern Materials Handling / CXTMS August 16 analysis |
| Shipment-level compliance economics | Nearly 75% of trade professionals rank U.S. tariff volatility as the most consequential customs change; $35.5B in refunds had been cleared across 8M+ entries | Assign classification, broker instructions, documentation, corrections, costs, and recovery to named owners on the shipment and entry record | Inbound Logistics / SupplyChainBrain |
| Sustainable driver capacity | Average driver life expectancy was cited at about 61 years; detention exceeded four hours at 4.9% of stops and average wait reached 119 minutes | Model dwell, duty-window compression, appointment volatility, parking, reassignment, and aggregate turnover as capacity risks without collecting private diagnoses | FreightWaves / CXTMS August 16 analysis |
| Parcel labor contingency | During 2023 talks, up to 1.5M parcels/day, about 8% of UPS U.S. volume, shifted away; the agreement covers roughly 330,000 employees | Qualify alternatives early, test labels and tracking, preserve effective rate and capacity assumptions, and preapprove phased reallocation and reversal triggers | FreightWaves / CXTMS August 16 analysis |
Technology use cases added on August 16
- AI and decision support: lane-specific air-capacity scoring, origin-risk detection, VIN cutover eligibility, industrial ramp readiness, and parcel reallocation triggers.
- Warehouse automation and safety: governed low-code releases, versioned rollback, normalized forklift safety streams, RTLS context, and leading-indicator corrective actions.
- Visibility and compliance: component-to-entry origin lineage, transshipment exception queues, shipment-level compliance cost, and public-private escalation records.
- Workforce and resilience: driver-capacity risk modeling, sustainable appointment design, carrier diversification, tested integrations, and time-phased labor contingencies.
The cross-cutting insight is that nominal capacity is not executable capacity. A bigger gateway, approved supplier, available truck, working forklift, published rate, or backup carrier becomes useful only after the system verifies eligibility, authority, timing, evidence, human sustainability, and a tested recovery path.
New Insights from August 17, 2026 Posts
- Closed-loop evidence became the bridge between optimization and operating authority. August 17 coverage connected supplier-audit remediation, AI delivery promises, ocean booking windows, multimodal governance, semiconductor allocations, shuttle interfaces, clean-port incentives, inventory twins, fleet acquisitions, and parcel tenders into one rule: a model, contract, asset, or compliance claim should not control execution until actual outcomes are reconciled to the decision and fed into the next one.
| Signal from August 17 coverage | Reported statistic | Technology and workflow implication | Source |
|---|---|---|---|
| Supplier audit follow-up | Walmart conducted approximately 16,700 third-party responsible-sourcing facility audits in fiscal 2026 | Link findings to open POs and shipments; prioritize containment, corrective action, verification, and repeat-risk monitoring instead of counting completed audits | Supply Chain Dive / CXTMS August 17 analysis |
| AI last-mile promise economics | Last mile can represent 30%-35% of total delivery cost; a failed first attempt can double delivery cost | Train promise and carrier decisions on actual cost, delivery success, redelivery, claims, and customer outcomes; expose confidence and override controls | Deloitte / SupplyChainBrain |
| Transpacific booking-window control | Asia-East Coast spot rates reached $9,144/FEU, versus $6,826/FEU to the West Coast, a $2,318 gap; August imports were projected at 2.22M TEUs | Use quote expiry, vessel cutoff, inventory need date, and escalation time to govern hold, book, split, or redirect decisions | Supply Chain Dive / CXTMS August 17 analysis |
| Enterprise shipping governance | Across 240 multimodal networks, 56% used at least three parcel carriers and 22% used six or more; ground parcel rates were 38.9% above January 2018 | Create one shipment-economics record with continuous policy enforcement, approval rights, surcharge normalization, and exception ownership across modes | SupplyChainBrain / Supply Chain Dive |
| Automotive memory continuity | DRAM prices were expected to rise 70%-100% in 2026, quarterly automotive-memory increases 20%-70%, and new-order lead times beyond 58 weeks | Tie long-term supply agreements to qualified part demand, allocation, milestone, inbound, inventory, and production-continuity records | Supply Chain Dive / Reuters |
| Warehouse interface capacity | A new system combines 11,500 pallet locations and 10 four-way shuttles; a robotics survey covered 166 practitioners | Budget WMS, WCS, lifts, conveyors, exception lanes, and operator recovery as one end-to-end constraint system; measure queues and tail latency | Modern Materials Handling / CXTMS August 17 analysis |
| Clean-port incentive evidence | San Pedro Bay ports committed $20M for charging; zero-emission drayage trucks can cost $400,000+, while Long Beach clean-truck fees generated about $70M in 22 months | Attach vessel, tractor, VIN, certification, gate, claim, approval, and payment evidence to each eligible shipment and reconcile incentives like receivables | SupplyChainBrain / FreightWaves |
| Inventory digital-twin reconciliation | Target modeled a 1.2M-square-foot receive center at about 98% accuracy and improved on-shelf availability 2.5% in a 63-item pilot | Reconcile simulated and physical events, use confidence thresholds for promises and replenishment, and measure latency, discrepancy, and recovery by process | Supply Chain Dive / CXTMS August 17 analysis |
| Parcel tender-cost ledger | UPS tendered about 977,000 parcels/day to USPS in Q1 and planned 1.5M/day in Q2; USPS air expense rose 4.7% to $509M and highway expense 4.1% to nearly $1.6B | Preserve tender, handoff, mode conversion, handling, fuel, service, and revenue data at shipment level so contract reviews measure profitability, not volume alone | Supply Chain Dive / CXTMS August 17 analysis |
Technology use cases added on August 17
- AI and decision support: promise-cost feedback loops, digital-twin confidence gates, supplier-risk prioritization, and explainable hold/book/split/reroute recommendations.
- Automation and robotics: interface-capacity budgets, queue-age monitoring, tail-latency measurement, exception recovery, and sustainable-throughput acceptance tests.
- Visibility and compliance: PO-to-audit exposure, incentive eligibility ledgers, quote-to-booking audit trails, semiconductor allocation milestones, and parcel tender economics.
- Governance and resilience: multimodal decision rights, risk-weighted corrective actions, fleet-utilization diligence, carrier portfolio controls, and outcome-based policy tuning.
The new insight is that feedback quality now determines whether technology earns operating authority. AI promises need delivered-cost outcomes, digital twins need physical reconciliation, audits need verified closure, capacity contracts need milestone evidence, and incentives need claim-to-cash proof. Without those loops, optimization merely automates assumptions.
New Insights from August 18, 2026 Posts
- Operational ledgers became the common control pattern across resilience, capacity, energy, cost, automation, inventory, and security. August 18 coverage connected product-level supplier exposure, equipment-specific routing guides, terminal energy, critical-parts funding, holiday inventory, air-cargo automation, ocean bid volatility, robotics commissioning, fuel timing, and border custody into one rule: logistics systems need dated, object-level evidence that links a market or risk signal to a release decision, accountable owner, physical outcome, and financial consequence.
The day's posts showed why aggregate signals are increasingly dangerous. Falling truckload volume did not prevent record contract rates; published ocean capacity did not guarantee usable sailings; port import forecasts did not prove inventory was available to promise; and capital committed to parts, robots, or terminal equipment did not create operational capacity until release rules, interfaces, charging windows, acceptance tests, and fallback plans were validated.
| Signal from August 18 coverage | Reported statistic | Technology and workflow implication | Source |
|---|---|---|---|
| Supplier disruption exposure | Nearly three-quarters of supply-chain leaders experienced supplier disruption; 23% reported significant losses | Build a product-level exposure graph linking supplier sites, parts, purchase orders, inbound shipments, finished goods, customers, and named recovery owners | SupplyChainBrain / CXTMS August 18 analysis |
| Dry van and reefer repricing | July contract rates reached $3.01/mile for dry van and $3.29/mile for reefer despite declining volumes | Separate routing-guide acceptance, lead-time, spot-exposure, service, temperature, and claims triggers by equipment type | Logistics Management / CXTMS August 18 analysis |
| Electric terminal-equipment readiness | An electric Hyster ReachStacker can reportedly charge from 20% to 80% in about 4.5 hours | Translate container work queues into move-level energy demand and reconcile state of charge with chargers, grid limits, reefer load, cutoffs, and resilience reserve | Modern Materials Handling / CXTMS August 18 analysis |
| Critical-parts resilience funding | GM is creating a $4.5B safety fund | Tie fund releases to observable part, site, inventory, shipment, production, and recovery triggers; preserve approvals and protected outcomes in a resilience ledger | SupplyChainBrain / CXTMS August 18 analysis |
| Holiday import conversion | August imports at major U.S. ports were forecast at 2.22M TEUs after 2.21M TEUs in July; retail sales were $763.6B, up 5% YoY | Reconcile forecast, discharge, customs release, drayage, DC receipt, and putaway before counting seasonal inventory as available | Supply Chain Dive / CXTMS August 18 analysis |
| Dual-hub air-cargo automation | Korean Air operates 23 freighters; the food cold-chain market was estimated at $78.55B in 2026 with 11.34% CAGR through 2031 | Use common acceptance tests for system interfaces, container handling, peak throughput, recovery, temperature control, and routing eligibility across Incheon and JFK | FreightWaves / Mordor Intelligence |
| Ocean procurement volatility | Maersk forecast $10.5B-$12.5B underlying EBITDA; Asia-East Coast capacity grew 46% versus 2019 while blank sailings grew 215% | Add lane-level index bands, review dates, capacity commitments, evidence requirements, and symmetric repricing rules before ocean bids reopen | SupplyChainBrain / Supply Chain Dive |
| Robotics deployment queue | North American Q2 robot orders rose 4.3% YoY; first-half orders reached 17,995 units worth $1.166B | Segment projects by application and score interfaces, labor dependency, throughput sensitivity, fallback readiness, and commissioning-resource demand | Modern Materials Handling / CXTMS August 18 analysis |
| Fuel-timing exposure | IEA projected a 1.8M-barrel-per-day Q3 oil deficit after observed inventories fell 69M barrels in June | Maintain a mode-by-mode calendar of index, carrier cost, commercial decision, hedge, and customer recovery dates; alert on unrecovered dollar variance | SupplyChainBrain / CXTMS August 18 analysis |
| Tractor-specific border custody | A Pharr inspection found 21.54 kg of suspected cocaine valued near $634,000 inside a tractor; cargo theft was projected to rise 13% in 2026 | Track driver, tractor, trailer, seal, shipment, and customs-entry identities separately; preserve coupling, inspection, custody, and disposition events without freezing cleared freight unnecessarily | FreightWaves / SupplyChainBrain |
Technology use cases added on August 18
- AI and decision support: traverse supplier exposure graphs, rank materiality separately from alert confidence, forecast work-block energy, detect routing-guide stress, and identify invoice variance without allowing a model to bypass release authority.
- Automation and robotics: validate air-cargo and warehouse systems against realistic workload, exception, interface, fallback, and cold-chain tests; schedule scarce commissioning specialists as a constrained portfolio resource.
- Visibility and identity: connect parts, orders, containers, equipment, drivers, tractors, trailers, seals, customs entries, inventory receipts, and energy telemetry through dated relationships instead of overwriting a single status field.
- Financial and procurement control: govern critical-parts funds, fuel pass-through gaps, ocean volatility clauses, equipment-specific truckload rates, and expedite decisions with effective dates, thresholds, approvals, and reconciled outcomes.
- Resilience and compliance: convert supplier alerts, border referrals, blank sailings, charging constraints, and holiday inventory delays into narrow exception queues with named owners, evidence bundles, recovery options, and next-review times.
The cross-cutting insight is that a ledger is no longer merely an accounting artifact. In logistics technology it is becoming the durable execution layer that proves which object is affected, what threshold was crossed, who may act, what capacity is genuinely usable, and whether the intervention protected service and margin.
New Insights from August 19, 2026 Posts
- External capacity signals became usable only when they were converted into shipment-level decision clocks. August 19 coverage connected federal freight infrastructure, Arctic routing, maritime security, blank sailings, new intermodal service, port development, weekly rail demand, and truckload tender weakness into one rule: a market headline is not an operating instruction. Logistics systems must identify the affected lane, shipment, asset, contract, deadline, owner, and fallback before the signal can protect service or margin.
The day's strongest pattern was the widening gap between published capacity and usable capacity. Scheduled ocean slots were erased by blank sailings; an authorized terminal still depended on phased construction and inland connections; a three-day rail schedule still required drayage and appointment capacity; and a shorter polar route carried insurance, rescue, ice, and recovery constraints. Technology creates value when it reconciles those external claims with internal orders and turns uncertainty into a time-boxed choice.
| Signal from August 19 coverage | Reported statistic | Technology and workflow implication | Source |
|---|---|---|---|
| U.S. freight infrastructure exposure | The U.S. freight system moves more than 54M tons worth over $68B per day | Add port, rail, road, equipment, and shared-data dependencies to supplier and lane scorecards; connect infrastructure alerts to affected orders | Logistics Management / CXTMS August 19 analysis |
| Arctic route optionality | The Dubai Tower can carry 1,740 TEUs; the Northern Sea Route can be 27% shorter than Suez and roughly 10 days faster | Gate eligibility by season, vessel class, cargo value, insurance, rescue coverage, weather, safe ports, and recovery options rather than headline transit time | SupplyChainBrain / FreightWaves |
| Black Sea cargo threat | At least five grain vessels were attacked; reported affected loads included 7,000, 20,000, and 56,000 tonnes | Separate port, vessel, cargo, contract, and customer exposure; run voyage-specific decision clocks and preserve reroute or substitute-origin evidence | SupplyChainBrain / CXTMS August 19 analysis |
| Effective ocean capacity | Asia-East Coast scheduled capacity rose 46% versus H1 2019 while blank sailings rose 215%; West Coast capacity rose 16% while blanks rose 62% | Calculate effective capacity from schedules, cancellations, booking acceptance, rollovers, rates, and lead time; trigger earlier bookings or gateway shifts | Supply Chain Dive / CXTMS August 19 analysis |
| Southwest intermodal option | BNSF's Phoenix-Alliance service runs six days per week with train departure to availability in just over three days | Treat the schedule as one milestone in an end-to-end test that includes drayage, appointments, free time, accessorials, damage, and recovery | FreightWaves / Supply Chain Dive |
| Federal freight funding | BUILD America 250 proposes $580B over five years; current authorization expires September 30, 2026 | Maintain a funding-event calendar linking authorization, awards, construction milestones, lanes, facilities, and customer commitments | Logistics Management / CXTMS August 19 analysis |
| Gulf gateway development | Port NOLA plans describe up to 2M TEUs annually, while an earlier initial phase cited 280,000 containers per year | Version every capacity assumption by source, date, and phase; compare gateways using vessel access, rail, road, labor, dwell, and end-to-end variability | FreightWaves / SupplyChainBrain |
| Weekly rail procurement signal | Railroads moved 6,811,496 carloads and 8,418,215 intermodal units through week 30, up 2.7% and 3.8% YoY | Segment national data by commodity, lane, service, and competing truck economics before changing procurement or routing-guide allocations | FreightWaves / CXTMS August 19 analysis |
| Truckload forecast warning | Tender lead time increased from 3.25 to 3.75 days; one estimate attributed the gap to 70% excess capacity and 30% weak demand | Reconcile daily tenders with order creation, lead time, weekday shifts, rejections, spot exposure, and rail conversion before resetting capacity | FreightWaves / CXTMS August 19 analysis |
| Western Indian Ocean piracy | Historical coalition coverage reached 20 warships from 14 countries, yet the patrol area remained vast | Build a voyage evidence pack covering vessel, route, security plan, insurance, endorsements, notices, approvals, communications, and fallback ports | Reuters / CXTMS August 19 analysis |
Technology use cases added on August 19
- AI and decision support: reconcile mode-specific signals, distinguish timing noise from demand erosion, rank gateway and voyage options, and recommend actions within explicit authority and review windows.
- Visibility and network intelligence: map public infrastructure, schedules, blank sailings, rail volumes, tender behavior, vessel threats, port milestones, and shared DOT data to affected shipments and customer promises.
- Compliance and security: maintain polar and piracy voyage evidence, insurance conditions, cargo-threat records, approvals, notifications, and auditable substitute-origin or rerouting decisions.
- Procurement and resilience: run controlled intermodal tests, calculate effective ocean capacity, version terminal assumptions, monitor infrastructure funding deadlines, and govern capacity changes with lane-level thresholds.
The new insight is that external intelligence needs an expiration time. A schedule, threat alert, funding proposal, capacity forecast, or market index becomes stale at a different speed. Winning systems will store when a signal was observed, which shipments it affected, when the decision must be reviewed, what evidence authorized the action, and whether the chosen fallback performed as expected.
New Insights from August 20, 2026 Posts
- Recovery and quality evidence became the gate between nominal capacity and executable service. August 20 coverage connected cold-chain custody, industrial leading indicators, fast-growing logistics providers, last-mile orchestration, healthcare M&A, AI planning, ocean allocation, infrastructure funding, air gateways, and warehouse automation into one rule: capacity should not enter a plan until the system can prove its quality, handoffs, decision rights, fallback path, and recovery performance.
The day's posts sharpened the difference between adding a node, carrier, platform, or machine and creating dependable capacity. A port-adjacent cold store still needed one custody record; fast revenue growth still needed lane-level service proof; an approved air route still needed cutoff and ground-reach validation; and warehouse automation still needed degraded-mode and reconciliation tests. The common technology requirement was a versioned operating record that survives provider, system, facility, and market change.
| Signal from August 20 coverage | Reported statistic | Technology and workflow implication | Source |
|---|---|---|---|
| Port Saint John cold-chain hub | Roughly US$80M, 22,000 pallet positions, and port capacity expanded from 150,000 to 1M TEUs | Use one temperature, seal, timestamp, custody, and exception record across warehouse, terminal, and rail handoffs | FreightWaves / CXTMS August 20 analysis |
| Industrial slowdown warning | ECRI's long-leading industrial index leads activity by almost one year; China-U.S. bookings fell 4% YoY while West Coast spot rates were nearly 3x prior-year levels | Combine external leading signals with lane tenders, margins, labor, and inventory; use watch, adjust, and protect trigger bands | FreightWaves / CXTMS August 20 analysis |
| Private logistics growth | 167 companies recorded 114% median three-year growth, $23.1B revenue, and 115,631 employees | Turn growth rankings into carrier watchlists, then validate physical capacity, integration, financial durability, and on-time performance through controlled pilots | FreightWaves |
| Last-mile failure economics | 8% of U.S. first attempts fail at an average $17.20 each; last mile can exceed half of shipping expense | Keep OMS promises connected to carrier acceptance, dispatch, redispatch, proof of delivery, intervention cost, and decision authority | Inbound Logistics / CXTMS August 20 analysis |
| Healthcare logistics continuity | Market projected from $246B in 2024 to about $503B by 2034 | Preserve validated lanes, chain of custody, temperature data, subcontractor controls, escalation matrices, and versioned continuity files through ownership change | FreightWaves |
| Autonomous planning outcomes | Up to 4% revenue gain, 20% inventory reduction, and 10% supply-chain cost reduction | Bind every AI recommendation to a shared data contract, execution KPI baseline, shipment events, exceptions, and realized financial outcome | McKinsey |
| Ocean carrier allocation | OOCL scored 53.44 and Matson 51.65; Asia-East Coast scheduled capacity rose 46% while blank sailings rose 215% | Weight allocations by lane-specific service, IT, claims, and effective capacity; adjust shares quarterly using measured triggers | Logistics Management / Supply Chain Dive |
| Transportation funding dependency | BUILD America 250 proposes $580B over five years; 64 groups urged preservation of FY2026 funding | Link public-project milestones and confidence ranges to affected lanes, facilities, customer promises, decision dates, and alternate capacity | Logistics Management |
| Hong Kong-Clark air option | UPS received six frequencies; Asia-Asia exports rose 13.6% YoY; global spot rates reached $3.12/kg | Qualify gateways by cutoff, handling, customs, ground reach, recovery, and shipment type before encoding selection and fallback rules | FreightWaves / CXTMS August 20 analysis |
| Warehouse technology resilience | Q2 robot orders reached $622M, up 21.3% YoY | Score degraded-mode capacity, recovery time, recovery point, reconciliation, and vendor response alongside normal throughput and features | Food Logistics |
Technology use cases added on August 20
- AI and planning: bind recommendations to shared definitions, baselines, authority, shipment events, and realized service, inventory, revenue, and cost outcomes.
- Visibility and handoff control: maintain bilateral custody events for temperature, seals, timestamps, proof of delivery, subcontractors, and exception disposition across organizational boundaries.
- Carrier and gateway procurement: convert growth, survey, schedule, and market signals into controlled pilots, lane-specific scorecards, allocation limits, qualification rules, and tested fallbacks.
- Automation resilience: test connectivity loss, equipment outages, bad master data, and labor shortages; measure degraded throughput, recovery clocks, transaction loss, reconciliation, and vendor response.
- Network and financial resilience: connect economic indicators and public-project milestones to reversible capacity, labor, inventory, routing, and customer-promise decisions.
The August 20 insight is that recovery is now part of the product. Logistics technology should not be evaluated only on what it optimizes during normal operations, but on how clearly it limits failure, preserves priority freight, assigns decisions, restores a trusted record, and proves the economic outcome after service resumes.
New Insights from August 21, 2026 Posts
- Decision authority became the missing layer between logistics data and automation. August 21 coverage connected JIT provider qualification, aluminum landed-cost audits, drone eligibility, ERP benefit realization, high-frequency freight signals, ecommerce order economics, provider exits, freight-payment AI, partial-load mode selection, and broker handoffs into one rule: automation should act only when the data contract, economic threshold, evidence requirement, owner, and fallback are explicit.
The day's posts moved beyond visibility toward permission. A market index could trigger review without dictating a tender; an AI model could assemble invoice evidence without authorizing payment; a drone could serve an address only after product, weather, airspace, inventory, and fallback checks; and a 3PL capability claim became useful only after milestone, ASN, escalation, and recovery proof. The common architecture is a versioned decision record that explains what the system knew, which rule fired, who had authority, and whether the outcome justified repeating the action.
| Signal from August 21 coverage | Reported statistic | Technology and workflow implication | Source |
|---|---|---|---|
| 3PL inbound and JIT readiness | 97% of surveyed 3PLs offered inbound logistics, 74% inventory management, and 70% JIT support | Replace capability checkboxes with milestone completeness, ASN accuracy, escalation latency, recovery performance, and plant-level pilot evidence | Inbound Logistics / CXTMS August 21 analysis |
| Aluminum landed-cost exposure | Midwest premium reached $0.96/lb or $2,116/metric ton, up 65% from June; all-in U.S. aluminum exceeded $5,000/ton | Separate base metal, regional premium, tariff, conversion, freight, benchmark date, and approval trigger in PO and invoice records | Reuters / Reuters analysis |
| Drone delivery eligibility | Amazon planned nearly 500 cities and towns by year-end, about 6x its footprint; eligible parcels could weigh 5 lb or less and arrive in under an hour | Evaluate address, parcel, inventory, weather, airspace, aircraft, margin, and ground fallback at order-release time; log every denial and override | Supply Chain Dive / Reuters |
| ERP benefit realization | Clorox's program was part of a $500M digitization effort; pre-cutover inventory rose from about 4 to 5.5 weeks, a 37.5% increase | Maintain a post-go-live ledger connecting inventory, service, freight, working capital, manual work, disruption cost, baseline, owner, and realization date | Supply Chain Dive / CXTMS August 21 analysis |
| High-frequency freight intelligence | July LMI was 68.9; transportation capacity fell to 28.4, utilization to 65.0, and contract truckload rates were 18% higher YoY | Separate observation, interpretation, and authorized action; version thresholds and reconcile each market-triggered decision to shipment outcomes | FreightWaves / CXTMS August 21 analysis |
| Ecommerce order economics | UPS and FedEx each announced average 5.9% increases; returns were estimated at $849.9B, or 15.8% of 2025 retail sales | Orchestrate delivery by order-level margin, dimensions, promise, carrier cost, accessorial risk, return probability, and recovery cost | FreightWaves / Reuters |
| Provider distress and exit readiness | About 7,058 jobs were affected across 21 companies in more than 15 states | Monitor provider health, preserve portable master and shipment data, prequalify substitutes, and test transition runbooks before a closure | FreightWaves |
| Freight-payment AI controls | Up to 30% of freight invoices may contain errors; duplicate reduction can save 1%-2% of annual transportation spend | Use AI for extraction and anomaly ranking while deterministic rules govern payment, evidence, tolerances, overrides, model versions, and audit packets | Inbound Logistics / Inbound Logistics |
| Partial-load mode selection | Provider estimate put shared-truckload savings at 30%-40% versus FTL | Gate options by cube, linear feet, handling risk, appointment rigidity, and dwell; rank FTL, LTL, and shared truckload by expected landed service cost | FreightWaves / CXTMS August 21 analysis |
| Shipper-broker data contracts | A shipment can create 6+ documents before invoicing; one automated workflow handles 80%-90% of routine loads | Standardize event and reporting timestamps, versioned tender fields, decision rights, reason codes, evidence, response windows, and first-pass document quality | FreightWaves / CXTMS August 21 analysis |
Technology use cases added on August 21
- AI and decision governance: invoice anomaly classification, market-signal interpretation, order-economics scoring, explicit authority limits, confidence thresholds, human overrides, and versioned audit packets.
- Transportation optimization: shipment-level FTL/LTL/shared-truckload eligibility, expected service-failure cost, consolidation dwell limits, drone eligibility, fallback routing, and outcome feedback.
- Visibility and partner control: JIT milestone and ASN scorecards, shipper-broker event contracts, dual timestamps, decision ownership, evidence completeness, provider-health indicators, and portable continuity files.
- Finance and procurement: aluminum landed-cost decomposition, benchmark and tariff versioning, ERP benefits ledgers, freight-payment tolerances, duplicate prevention, and realized-savings reconciliation.
- Ecommerce and resilience: order-level contribution margin, return probability, carrier portfolio logic, delivery-zone denials, provider-exit drills, substitute qualification, and recovery-cost measurement.
The August 21 insight is that faster data does not justify faster autonomy by itself. Logistics systems earn decision rights when they can prove eligibility, apply a versioned rule, preserve the evidence available at the time, route ambiguity to an accountable owner, execute a tested fallback, and reconcile service and financial outcomes before the rule is reused.
New Insights from August 22, 2026 Posts
- Physical proof, climate exposure, and capacity economics converged into one execution layer. August 22 coverage connected aircraft scarcity, manufacturing ramps, foodservice inventory pooling, extreme heat, broker insurance, alternative fibers, LPG ship-to-ship routing, RFID-plus-vision verification, sail freight, and zero-waste facilities into one rule: logistics systems must qualify whether a shipment, supplier, facility, mode, or carrier is physically and economically executable before the plan is released.
The day's posts reinforced a practical shift from generic visibility to corroborated operating evidence. RFID identity became more valuable when vision verified physical condition; sustainability claims became credible when tied to custody and shipment records; and capacity plans became defensible when production, labor, insurance, equipment, weather, and handoff constraints shared the same decision file.
| Signal from August 22 coverage | Reported statistic | Technology and workflow implication | Source |
|---|---|---|---|
| Aircraft capacity scarcity | A structural shortage numbering in the thousands of aircraft may persist through 2030 | Maintain lane-level belly and freighter watchlists covering delivery schedules, maintenance, lease costs, allocations, recovery gateways, and customer priority | SupplyChainBrain / CXTMS August 22 analysis |
| Production-to-fulfillment capacity | Birkenstock is planning for 10% annual unit growth through 2027 | Gate each plant ramp on material, labor, equipment, inbound, warehouse, and outbound milestones; reconcile added output with sellable, fulfillable inventory | Supply Chain Dive / CXTMS August 22 analysis |
| Foodservice inventory pooling | Redistribution is particularly useful below 25,000 lb/month for slower-moving and promotional products | Segment SKUs by velocity, shelf life, temperature, order frequency, and emergency-transfer risk; measure pooled inventory and transport cost together | Food Logistics / CXTMS August 22 analysis |
| Supplier heat continuity | India could lose nearly 6% of working hours to heat stress by 2030; Bangladesh apparel employs about 4.5M people, roughly 60% women | Add heat thresholds, worker protections, lost hours, PO exposure, supplier capacity, alternate sites, and recovery actions to sourcing and shipment workflows | Reuters / CXTMS August 22 analysis |
| Broker insurance qualification | Excess-liability increases ranged from 50% to triple digits; carrier premiums reached 10.2 cents/mile, then rose another 5.8% YoY in early 2025 | Enforce automated coverage, expiry, shipment-value, lane, subcontracting, and exception-approval gates before tender | FreightWaves / FreightWaves analysis |
| Alternative-material qualification | Kimberly-Clark's transformation includes a $3B program and a procurement platform used by 90% of suppliers | Connect quality, landed cost, supply reliability, sustainability, lot identity, and shipment custody before a second source counts as resilient | Supply Chain Dive / CXTMS August 22 analysis |
| LPG shuttle routing | Immediate Neopanamax passage reached $4.6M; about 60% of U.S. LPG exports moved to Asia | Compare direct, shuttle, and alternate routes using probability-weighted toll, wait, transfer, loss, insurance, custody, and delivery-window costs | SupplyChainBrain / CXTMS August 22 analysis |
| RFID and machine-vision verification | RFID can lift SKU accuracy from 63% to 95%; combined deployments frequently exceed 98%-99% | Corroborate identity, count, condition, location, and direction at receiving, pallet build, loading, and returns; route disagreements as owned exceptions | Supply Chain Dive / SupplyChainBrain |
| Sail-freight economics | TradeSailer 120 carries nine pallets or 7.75 short tons; a larger sail freighter targets an 80% emissions reduction | Model complete door-to-door cost, utilization, ETA range, drayage, handling, auxiliary fuel, rollover eligibility, and emissions by shipment | SupplyChainBrain / CXTMS August 22 analysis |
| Zero-waste logistics evidence | TRUE certification requires diversion above 90% and contamination below 10%; Best Buy added 29 balers | Treat recyclable and reusable material as reverse freight with pickup schedules, carrier custody, weights, contamination, certificates, and facility scorecards | Supply Chain Dive / CXTMS August 22 analysis |
Technology use cases added on August 22
- AI, RFID, and machine vision: corroborated receiving, pallet, loading, returns, damage, location, count, and confidence events with human-owned exception release.
- Capacity and network planning: aircraft watchlists, production-ramp gates, pooled inventory, airfreight allocations, ship-to-ship transfers, emerging-mode eligibility, and probability-weighted route economics.
- Risk and compliance: supplier heat scorecards, carrier insurance gates, material qualification, custody evidence, waste certificates, and versioned approval records.
- Sustainability execution: shipment-level diversion, contamination, reuse, alternative-fiber provenance, auxiliary fuel, utilization, and door-to-door emissions measurement.
- TMS-WMS orchestration: verified physical events, handling-unit identity, voyage and transfer milestones, ETA ranges, warehouse readiness, tender blocks, fallbacks, and outcome reconciliation.
The August 22 insight is that one data source rarely proves an operational claim. Identity needs physical corroboration, capacity needs readiness evidence, resilience needs a qualified alternate, sustainability needs custody and measurement, and a low-cost route needs complete handoff economics. The strongest logistics platforms will join those proofs before authorizing execution.
New Insights from August 23, 2026 Posts
- Capacity became credible only when physical flow, legal proof, and downstream readiness were measured together. August 23 coverage connected a million-square-foot distribution center, a time-limited beef quota, Canadian origin rules, case-level food traceability, truck-aware routing, warehouse labor evidence, packaging validation, infrastructure funding, trucking regulation, and cold-chain grants into one rule: nominal capacity is not executable capacity until every dependent node, document, asset, and exception owner is ready.
Statistics and evidence added on August 23
| Signal from August 23 coverage | Reported statistic | Technology and workflow implication | Source |
|---|---|---|---|
| Distribution-network capacity | Amazon's proposed Connecticut first-mile facility is 1 million square feet; extended operating hours can double or triple door availability in some settings | Gate launch volume on inventory accuracy, dock flow, downstream sortation, carrier commitments, and last-mile capacity—not building size alone | Supply Chain Dive / Inbound Logistics / CXTMS August 23 analysis |
| Beef quota cold-chain allocation | Up to 300,000 metric tons may enter tariff-free for 90 days, averaging about 3,333 metric tons per day | Join quota utilization, admissibility, reefer capacity, temperature evidence, inspections, landed cost, and expiry triggers in one allocation workflow | Supply Chain Dive / CXTMS August 23 analysis |
| Canadian origin exposure | The 50% additional tariff covers about $20B in products; origin records must be retained for five years | Put SKU-level origin, transformation evidence, customs value, tariff version, broker review, and document retention ahead of tender | Reuters / Inbound Logistics / CXTMS August 23 analysis |
| Foodservice case traceability | An estimated 70% of U.S. food cases carry Produce Traceability Initiative-compliant labels | Link case identity to temperature events, substitutions, shortages, damage, acceptance, disposition, and customer resolution instead of stopping at load-level POD | Food Logistics / CXTMS August 23 analysis |
| Warehouse labor evidence | ID Logistics agreed to a $2.6M settlement; cited warehouse earnings were $22.41/hour, up 6.5% YoY | Connect worker, shift, site, activity, payroll, customer allocation, approval, and throughput while preserving the distinction between operational corroboration and financial proof | FreightWaves / Inbound Logistics / CXTMS August 23 analysis |
| Packaging-to-freight validation | 30%-40% of space in loaded trailers may be unused | Approve low-carbon packaging by saleable unit delivered, testing cube, damage, spoilage, temperature, mode, lane, claims, and total emissions together | Inbound Logistics / CXTMS August 23 analysis |
| Freight-infrastructure continuity | 64 groups sought continuity; the proposed five-year bill totals $580B, while prior Mega and INFRA awards included $4.9B across 37 projects | Maintain a milestone ledger from authorization and obligation through award, mobilization, construction, commissioning, and freight-network activation | Logistics Management / SupplyChainBrain / CXTMS August 23 analysis |
| Trucking regulatory attribution | About 13,000 non-domiciled CDLs were affected by a March deadline; broader estimates reach 194,000 holders | Attribute lane-level capacity changes across regulation, seasonality, demand, equipment imbalance, and unexplained variance before changing procurement rules | FreightWaves / CXTMS August 23 analysis |
| Grant-funded cold-chain evidence | USDA's grant provides $7.5M; one reference facility holds 54M lb and cross-docks 2M lb/day | Link funded equipment to shipments, utilization, temperature performance, spoilage, recipients, proof of delivery, and measurable community outcomes | Food Logistics / CXTMS August 23 analysis |
Technology use cases added on August 23
- Network digital twins: model upstream releases against dock, carrier, sortation, and last-mile constraints before a facility ramp.
- Policy-aware cold-chain allocation: reserve quota, customs clearance, reefer equipment, inspection, and temperature capacity as one scarce resource.
- Shipment-level origin gates: prevent tender or release until origin, tariff, customs value, and broker evidence pass versioned rules.
- Case-level exception records: bind serialized food cases to temperature, substitution, damage, acceptance, and disposition events.
- Truck-aware dispatch validation: combine vehicle dimensions with carrier policy, permits, hours of service, weather, closures, and auditable overrides.
- Equipment-to-shipment traceability: prove that grant-funded assets created usable throughput and safe delivery outcomes.
The August 23 insight is that logistics systems must stop treating capacity, compliance, sustainability, and funding as separate reporting domains. They converge at release: a plan should move only when the physical network can absorb it, the legal and commercial evidence is complete, and the system knows who owns the next exception.
New Insights from August 24, 2026 Posts
- Identity, capacity, and continuity became release-time controls. August 24 coverage connected AI-enabled carrier impersonation, specialized vehicle shipping, commodity plausibility, canal water constraints, labor disruption, cost-to-serve evidence, port concessions, gateway throughput, drayage integration, and retail rebalancing into one rule: a logistics plan should not be released because a document, booking, facility, or forecast exists; the system must verify that the actor is genuine, the capacity is usable, the economics are current, and a governed fallback can actually execute.
Statistics and evidence added on August 24
| Signal from August 24 coverage | Reported statistic | Technology and workflow implication | Source |
|---|---|---|---|
| AI-enabled freight identity risk | Cargo theft rose 27% YoY in 2024 with estimated losses above $1B, and was on pace to rise another 22% in 2025 | Continuously re-verify authority, insurance, payment, device, driver, tractor, and pickup context at material changes rather than trusting document-only onboarding | Supply Chain Dive / CXTMS August 24 analysis |
| Vehicle-shipping scarcity | China exported 5.79M cars in 2025, up 19.4%; EV exports rose 48.8% to 1.52M; the PCTC orderbook is only 20%-21% of the fleet | Allocate vessel space by VIN batch, launch priority, yard capacity, booking deadline, and approved container or ro-ro fallback | Reuters / FreightWaves |
| Commodity plausibility screening | A detergent load concealed 1,071 lb of suspected meth valued above $9.57M; California and Texas accounted for 58% of reported U.S. cargo thefts in 2025 | Score commodity, weight, packaging, route, carrier, equipment, and custody contradictions before border arrival while preserving explainable review evidence | FreightWaves / FreightWaves |
| Panama Canal water constraint | Watershed rainfall ran 34% below average from May-August; Panamax slots fall from 26 to 23 per day, nearly 12% | Rank shipments by business consequence and trigger booking, delay, or reroute decisions from slot probability and total disruption cost | Supply Chain Dive / CXTMS August 24 analysis |
| Labor continuity | 79% of manufacturers named labor shortage their leading external challenge; 77% of procurement and supply chain leaders reported internal talent shortages | Map each dispute to exposed products, lanes, inventory buffers, alternate capacity, decision deadlines, owners, and recovery evidence | Inbound Logistics / CXTMS August 24 analysis |
| Packaged-goods cost to serve | Process changes can cut picker travel by 20%+ and improve labor effectiveness 5%-7%, worth an estimated $45,000-$65,000 annually for a 15-worker warehouse | Bind exception labor, storage, repacking, transport, claims, and billing evidence to the order and customer profitability ledger | Inbound Logistics / CXTMS August 24 analysis |
| Port-concession continuity | CK Hutchison seeks more than $1.5B after two Panama ports it operated for nearly 30 years were seized | Maintain gateway dependency, contract, cash, custody, data-export, transition, and alternate-node controls independent of legal headlines | SupplyChainBrain / Reuters |
| Los Angeles gateway scenario | July throughput reached 960,464 TEUs; a 5% increase equals roughly 48,000 additional TEUs; rail dwell was 5.06 days | Reconcile vessel arrivals with terminal, chassis, drayage, rail, and DC capacity daily instead of treating annual port growth as smooth demand | Supply Chain Dive / FreightWaves |
| Drayage acquisition integration | RoadOne added 15 drivers to a 2,500+ driver network and paired them with a 384,000-square-foot Charleston facility | Normalize master data and rates, baseline service, phase lane migration, test settlements and invoices, and define rollback before cutover | FreightWaves / CXTMS August 24 analysis |
| Omnichannel inventory rebalancing | Walmart U.S. comparable sales grew 2.6%, while three-hour delivery GMV rose 48%, store-fulfilled delivery sales rose 40%+, and stores handled 80% of ecommerce orders | Reconcile sell-through, on-hand inventory, purchase orders, inbound appointments, channel demand, and capacity before delaying or canceling freight | SupplyChainBrain / Supply Chain Dive |
Technology use cases added on August 24
- Continuous identity assurance: risk-based carrier, user, device, payment, driver, tractor, and pickup verification with step-up checks at material changes.
- Constraint-aware allocation: VIN-batch vessel allocation, canal-slot prioritization, gateway capacity reconciliation, and cost-based mode or port fallback triggers.
- Explainable anomaly screening: commodity, weight, packaging, route, geography, equipment, and custody comparisons with governed baselines and human review.
- Continuity and integration control: labor trigger maps, port transition files, phased acquisition cutovers, master-data crosswalks, rollback thresholds, and recovery evidence.
- Closed-loop financial execution: exception-level cost-to-serve ledgers and inventory rebalancing tied to actual labor, service, margin, and channel outcomes.
The August 24 insight is that visibility is no longer enough at the moment of commitment. Systems must challenge identity, test physical and legal plausibility, qualify capacity across every downstream handoff, calculate the cost of waiting or switching, and preserve a reversible action path before freight, money, or customer promises are released.
New Insights from August 25, 2026 Posts
August 25 sharpened a central lesson of 2026: logistics systems need governed triggers, not passive averages. The day's coverage connected origin evidence, freight-budget variance, fuel-sensitive mode switching, truck and cross-border capacity, rail equipment planning, disruption isolation, and procurement-agent approvals. In each case, technology created value by detecting a threshold, preserving the evidence behind it, and routing the next decision to the right operator.
- Governed triggers replaced passive averages as the control-tower standard. August 25 coverage connected origin evidence, freight-budget variance, fuel-sensitive mode switching, truck and cross-border capacity, rail equipment planning, disruption isolation, and procurement-agent approvals into one rule: systems need to detect the threshold, preserve the evidence, test reversibility, and route authority before committing the network.
Statistics and evidence added on August 25
| Signal from August 25 coverage | Reported statistic | Technology use case | Source |
|---|---|---|---|
| Freight spend diverged from volume | July Cass shipments fell 4.8% year over year while expenditures rose 9.1%; the two indexes imply roughly 14.6% more expenditure per shipment as a directional measure | Reforecast lane budgets from accepted tenders, tender depth, accessorials, and planning variance instead of waiting for invoices | Logistics Management / Cass Information Systems / CXTMS August 25 analysis |
| Fuel pressure strengthened the intermodal case | Diesel and WTI crude prices each rose roughly 28% after the Iran conflict began; May intermodal volume increased 4.4% year over year | Compare truck and intermodal on door-to-door expected cost, including drayage, inventory carrying cost, terminal reliability, and exception risk | Logistics Management / IANA / CXTMS August 25 analysis |
| Truck demand stayed soft while usable capacity tightened | ATA's July tonnage index fell from 114.7 to 113.5 and was 0.5% below the prior year, while tender rejections remained above 10% for more than two months and linehaul rates excluding fuel were about 30% higher year over year | Trigger routing-guide reviews from lane-level rejection, spot premium, carrier availability, and service deterioration rather than national demand alone | ATA / Logistics Management / FreightWaves / CXTMS August 25 analysis |
| Rail growth concentrated in industrial freight | Weekly U.S. rail traffic reached 525,099 carloads and intermodal units, up 2.4% year over year; metallic minerals and ores rose 19.2% | Forecast equipment by commodity, origin, cycle time, terminal throughput, and customer dwell instead of extrapolating a national growth rate | FreightWaves / AAR data / CXTMS August 25 analysis |
| Northbound Mexico capacity faced a compliance bottleneck | An estimated 3,200 drivers across the border region lost visas; the Laredo-Colombia bridge handles about 3,500 freight-truck crossings per day | Segment capacity by Mexican linehaul, border transfer, and U.S. continuation, then set tender lead times and escalation thresholds by gateway | FreightWaves / CXTMS August 25 analysis |
| Overseas production did not eliminate upstream concentration | Vietnam's imports from China reached about $168 billion through November 2025, nearly 30% higher year over year; China's trade surplus passed $1 trillion that month | Replace a single country-of-origin field with linked facility, supplier, transformation, bill-of-material, and shipment evidence | Reuters / SupplyChainBrain / CXTMS August 25 analysis |
| Procurement-agent adoption raised the approval question | Agents could manage 60% to 70% of transactional procurement by 2028; 11% of enterprises expect routine autonomous decisions within 18 to 24 months and 20% expect most decisions under human oversight | Classify agent actions as observe, propose, or commit, with technical approval gates based on reversibility and consequence | SupplyChainBrain / IDC / CXTMS August 25 analysis |
| Distribution disruption required bounded automation | Four Ozon logistics hubs were reported targeted by drones; 64% of surveyed supply chain executives identified warehouse-role automation as their leading digitization priority | Isolate affected nodes without erasing history, quarantine uncertain inventory, map dependencies, and require approval for high-impact diversions | Reuters / McKinsey / CXTMS August 25 analysis |
Technology use cases added on August 25
- Dynamic freight budgeting: Refresh lane cost bands from every tender and separate market movement from execution leakage before month-end close.
- Risk-adjusted mode selection: Recalculate truck-to-intermodal thresholds as fuel, transit time, terminal performance, inventory value, and exception frequency change.
- Routing-guide trigger engines: Detect structural capacity loss from sustained rejection, premium, carrier-count, and service signals rather than treating seasonal noise as a sourcing mandate.
- Directional cross-border capacity control: Measure acceptance, dwell, compliance, and cost separately across Mexican linehaul, border transfer, and U.S. continuation legs.
- Commodity-specific rail forecasting: Link car type, origin capacity, terminal cycle time, customer unload performance, and maintenance windows to industrial demand scenarios.
- Origin evidence graphs: Model facilities, upstream dependencies, transformation records, industrial parks, customs zones, and effective-dated supplier relationships instead of relying on country labels.
- Disruption node isolation: Freeze unsafe execution objects, preserve their audit history, quarantine uncertain stock, and divert only orders whose physical state is known.
- Reversible AI procurement: Allow agents to prepare and recommend while forcing authenticated human approval before awards, deposits, purchase orders, bookings, or other binding actions.
The new synthesis is that a control tower should behave less like a screen and more like a policy engine. It must know which evidence changed, which threshold was crossed, whether the proposed response is reversible, and who has authority to commit the network.
New Insights from August 26, 2026 Posts
August 26 moved the year's technology story from signal governance to constraint economics. The day's posts connected agricultural plant ramps, a conditional livestock-border reopening, trucking credit, diesel escalation, premium healthcare freight, robotic depalletizing, retail availability, gateway selection, parcel peak pricing, and 30-minute delivery. The common lesson was blunt: a faster or cheaper option is not real until physical capacity, eligibility, total cost, service evidence, and fallback rules are tested together.
- Constraint economics became the release gate for capacity, speed, and automation. August 26 coverage showed that plants, border corridors, carriers, robots, gateways, parcel services, and rapid-delivery promises all need the same control pattern: qualify the resource, calculate the full cost, attach an effective date, protect the handoffs, and reconcile the realized outcome before releasing more volume.
Statistics and evidence added on August 26
| Signal from August 26 coverage | Reported statistic | Technology use case | Source |
|---|---|---|---|
| Brownfield oilseed capacity ramp | ADM plans roughly $100M across four plants, with six more sites identified; expanding an existing plant can cost about one-quarter as much as a greenfield build | Connect commissioning dates to weekly lane forecasts, rail and truck allocations, storage thresholds, and supplier appointment limits | Supply Chain Dive / FreightWaves / CXTMS August 26 analysis |
| Conditional livestock-corridor restart | Mexico had 1,969 active screwworm cases as of August 22, less than half the prior-year peak; U.S. uncooked beef prices rose 10% YoY in July | Enforce current certificates, inspection slots, welfare clocks, carrier eligibility, downstream pen capacity, and reversible release waves | SupplyChainBrain / USDA coverage / CXTMS August 26 analysis |
| Trucking credit improved, unevenly | BMO impaired transportation loans fell to C$440M from C$576M QoQ; provisions fell from C$41M to C$15M while the loan book held near C$12.78B | Combine external credit context with carrier acceptance, claims, payment changes, insurance, fleet status, and lane concentration | FreightWaves / BMO disclosures / CXTMS August 26 analysis |
| Diesel reset bid economics | National diesel reached $5.652 per gallon after a two-week increase of 39.5 cents, about 7.5%; the modeled change adds about $66 per 1,000-mile load at six mpg | Version fuel tables by effective date, separate fuel from linehaul, stress-test bids, and audit invoice formulas | Logistics Management / EIA / FreightWaves / CXTMS August 26 analysis |
| Healthcare became a premium freight vertical | FedEx reported nearly $10B in fiscal-2026 healthcare transportation revenue, up from about $9B, supported by a dedicated organization of just under 150 people | Make product eligibility, qualified lanes, condition monitoring, stability clocks, custody events, and intervention ownership machine-enforceable | Supply Chain Dive / FreightWaves / CXTMS August 26 analysis |
| Robotic picking approached scale | Market forecast rises from $1.7B in 2025 to $4.6B by 2030, with 22% average annual growth | Test SKU and pallet profiles, measure cell-to-dock flow, connect WMS waves to carrier cutoffs, and stage commissioning gates | Food Logistics / Interact Analysis / MHI / CXTMS August 26 analysis |
| Store inventory accuracy constrained omnichannel service | Pick-from-store stockouts can affect 10%-15% of orders; one retailer generated more than $100M in incremental sales through availability improvements | Link purchase orders, receipts, shelf records, substitutions, picks, and shipment events into a weekly root-cause control loop | McKinsey / Supply Chain Dive / CXTMS August 26 analysis |
| Ocean-rate arbitrage depended on inland cost | Reported West Coast and East Coast rates were $1,879 and $2,651 per FEU, a $772 gap; ten extra days on $100,000 of cargo at 20% carrying cost consume about $548 | Set booking-window gateway triggers using inland cost, inventory time, accessorial exposure, congestion, and a minimum savings hurdle | FreightWaves / Supply Chain Dive / CXTMS August 26 analysis |
| USPS peak pricing became calendar logic | Proposed average 6% increase runs October 4, 2026-January 17, 2027; examples range from $0.40 to $10.50 per parcel, layered over an earlier 8% temporary increase | Apply shipment-level rate calendars, inventory-positioning scenarios, promise tests, and carrier-switch thresholds | Supply Chain Dive / FreightWaves / USPS coverage / CXTMS August 26 analysis |
| Thirty-minute retail delivery required margin gates | Walmart charges members $10, can reach about 60% of the U.S. population within 30 minutes, and offers the service in more than 30 markets | Gate eligibility by inventory confidence, pick capacity, dynamic drive time, basket economics, courier wait, and repeat-purchase outcomes | Supply Chain Dive / CXTMS August 26 analysis |
Technology use cases added on August 26
- Capacity-ramp orchestration: Translate commissioning schedules into lane, equipment, storage, appointment, and outbound-clearance controls before production rises.
- Conditional corridor release: Meter cross-border freight in auditable waves whose documents, inspections, welfare constraints, destination capacity, and shutdown fallback are current.
- Carrier financial-health monitoring: Join quarterly credit signals with weekly tender, claim, insurance, payment, fleet, and service evidence without treating a market average as a carrier verdict.
- Effective-dated freight cost engines: Version fuel and parcel tables, retain contractual formulas, and reconcile planned, rated, and billed cost at shipment level.
- Premium healthcare workflow design: Encode product-specific booking eligibility, qualified custody chains, remaining-stability alerts, intervention ownership, and proof-backed pricing.
- Warehouse automation capacity testing: Validate robots against actual freight profiles and downstream dock cutoffs rather than isolated picks per hour.
- Retail availability control loops: Trace stockouts and substitutions back through supplier, inbound, receiving, shelf, order, and fulfillment events before adding inventory.
- Risk-adjusted gateway selection: Compare ocean, drayage, rail, dwell, carrying cost, accessorials, and disruption reserves in every booking window.
- Profitable rapid-delivery gating: Offer speed only when store inventory, labor, courier capacity, drive time, basket margin, and customer-lifetime outcomes support it.
The August 26 synthesis is that nominal capacity is cheap to describe and expensive to trust. Logistics platforms create leverage when they convert capacity claims, price signals, and service promises into effective-dated eligibility rules, total-cost tests, execution thresholds, and closed-loop evidence.
New Insights from August 27, 2026 Posts
August 27 brought the year's themes together at the point where a transportation promise meets physical execution. The day's posts connected palletized B2B delivery, inland intermodal investment, tariff refunds, wind-assisted vessels, Gulf sourcing, bulky same-day delivery, carrier scorecards, short-sea services, and healthcare network investment. Across all nine, the headline capability mattered less than the operating record that proves whether the new option delivered usable capacity, reliable service, and the expected economics.
- Promise-to-proof orchestration became the test for network innovation. August 27 coverage showed that new trucks, rail hubs, vessel technology, ocean services, delivery speeds, and carrier investments create value only when systems connect the commercial promise to eligibility, cutoffs, handoffs, cost, service outcomes, and an auditable fallback.
Statistics and evidence added on August 27
| Signal from August 27 coverage | Reported statistic | Technology use case | Source |
|---|---|---|---|
| Palletized B2B fulfillment | Amazon Business's dedicated consolidated-delivery service is rolling out in 13 states | Combine order consolidation, pallet identity, dock appointments, receiving readiness, proof of delivery, and detention into one B2B handoff record | Supply Chain Dive / CXTMS August 27 analysis |
| Southwest intermodal capacity | BNSF's planned Barstow International Gateway represents $4B across 4,500 acres, with Phoenix roughly 350 miles away | Compare rail and truck door to door using cutoffs, drayage, terminal dwell, transload capacity, inventory time, and final delivery evidence | Supply Chain Dive / CXTMS August 27 analysis |
| Tariff-refund reconciliation | Caterpillar recognized $392M in overturned tariffs in Q2, while still expecting roughly $2.2B in 2026 tariff costs; the refund equals nearly 18% of that estimate | Preserve effective-dated entry-line duty states and reconcile refunds across customs, inventory, products, customers, and finance | Supply Chain Dive / CXTMS August 27 analysis |
| Commercial wind propulsion | More than 100 vessels representing over 6M deadweight tons now operate with wind propulsion; ocean shipping produces roughly 3% of global greenhouse-gas emissions | Add vessel technology, route suitability, fuel use, carbon intensity, schedule performance, and green-premium validation to ocean procurement | SupplyChainBrain / Inbound Logistics |
| Gulf Coast sourcing optionality | Central American exports to the U.S. rose 5.1% YoY in Q1; Crowley's weekly service supports dry, refrigerated, and 53-foot equipment | Model the complete landed route from origin cutoff through customs, port, intermodal transfer, inland delivery, and exception fallback | Supply Chain Dive / CXTMS August 27 analysis |
| Bulky rapid delivery | Home Depot offers eligible delivery within three hours; the last mile can exceed half of shipping expense, and a failed delivery can cost about $17 | Gate promises using SKU dimensions, store inventory, vehicle and crew eligibility, route time, margin, customer availability, and recovery options | Supply Chain Dive / Inbound Logistics |
| Service-scorecard trust | More than 2,800 buyers rated on-time performance 4.59-4.70 out of 5, the highest-rated service attribute; a critical component delay can cost $20,000 per minute | Standardize event definitions, expose sample sizes, segment performance, and connect misses to early-warning and corrective-action workflows | Logistics Management / Inbound Logistics |
| Mexico-U.S. short-sea optionality | Tuxpan transit is about four days to Port Canaveral and six days to Philadelphia; biweekly frequency can add nearly 14 days after a missed cutoff | Compare modes on ready-to-deliver time, frequency, inventory cost, customs, inland legs, reliability, and disruption exposure | FreightWaves / CXTMS August 27 analysis |
| Healthcare and international network investment | UPS is investing more than $2B through 2028; it generated $11.2B in 2025 healthcare revenue and invested $48M in 27 temperature-controlled cross-docks | Baseline lane and cold-chain performance, then measure whether new facilities and air links improve handoffs, intervention time, capacity, cost, and recovery | SupplyChainBrain / Supply Chain Dive |
Technology use cases added on August 27
- Dock-aware B2B consolidation: Group orders without losing pallet, appointment, receiver, delivery, and exception traceability.
- Door-to-door intermodal evaluation: Join rail schedules, cutoffs, drayage, dwell, inventory time, transload events, truck fallback, and realized cost.
- Entry-line duty audit trails: Preserve original assessment, legal basis, payments, amendments, refunds, allocations, and financial reconciliation as separate effective-dated states.
- Vessel-technology procurement: Treat propulsion, voyage suitability, emissions, fuel performance, schedule reliability, and green premiums as comparable operating fields.
- New-lane launch control: Baseline landed cost and service, qualify handoffs and cold-chain capability, phase volume, and retain an executable alternate route.
- Eligibility-based rapid delivery: Promise speed only when inventory, product dimensions, crew, vehicle, route, margin, and customer handoff are simultaneously feasible.
- Trusted service scorecards: Use one event dictionary, visible sample sizes, lane and facility segmentation, early-warning measures, and owner-based corrective action.
- Frequency-aware mode selection: Price missed cutoffs, sailing frequency, customs, inland legs, carrying cost, variability, and disruption optionality alongside nominal transit.
- Investment outcome measurement: Put carrier capital commitments beside shipment-level service, temperature, capacity, intervention, recovery, and actual-cost evidence.
The August 27 synthesis is that network innovation should be treated as a measurable hypothesis, not a press-release fact. A logistics system must show which shipments were eligible, which handoffs changed, what the new option cost, whether service improved, and when the fallback outperformed the headline solution.
New Insights from August 28, 2026 Posts
August 28 pushed the retrospective from visibility into qualification. The day's ten posts covered carrier rebids, air-capacity release, cold-chain facilities, e-waste recovery, freight pricing, heavy lift, Mexico cargo theft, terminal modernization, tariff timing, and warehouse wireless networks. The common lesson was that a headline number is only a signal: execution systems must test whether the underlying carrier, facility, lane, asset, rule, or network is actually usable before committing freight or customer service.
- Operational qualification became the control layer between market signals and execution. August 28 coverage showed that logistics technology must translate national indexes, forecasts, capital announcements, tariff headlines, and nominal capacity into lane-level eligibility, effective dates, tested throughput, economic thresholds, accountable owners, and reversible release decisions.
Statistics and evidence added on August 28
| Signal from August 28 coverage | Reported statistic | Technology use case | Source |
|---|---|---|---|
| Carrier rebid concentration | Advance Auto Parts expects to work with 70% fewer carriers across a network of 15 distribution centers | Reconcile awarded rates with tender acceptance, shipment service, invoices, store availability, and executable backup coverage | Supply Chain Dive / CXTMS August 28 analysis |
| Air-capacity release | Weekly chargeable weight fell 5%; March global demand was down 4.8% YoY while capacity fell 4.7%; the market is projected from $169.53B in 2026 to $225.26B in 2031 | Release allotments through lane-specific checkpoints that combine demand probability, capacity, contribution, and service exposure | Logistics Management / Mordor Intelligence / CXTMS August 28 analysis |
| Cold-chain facility readiness | Global cold-chain logistics is forecast from $382.3B to $1.37T by 2035; food cold chain is projected to grow 11.34% CAGR through 2031 | Qualify pallet positions by temperature zone, dock window, labor, power resilience, sensor evidence, and onward carrier capacity | Food Logistics / Mordor Intelligence |
| E-waste material recovery | Global e-waste reached 62M metric tons in 2022, only 22.3% was properly collected and recycled, and the stream contained more than 7,000 metric tons of rare earths | Turn returns into controlled secondary inventory with product identity, custody, condition, secure transport, recovery yield, and recycler proof | Reuters / Deloitte |
| Freight pricing and fuel divergence | Pricing Pressure Index read 36, while diesel rose 39.5 cents in two weeks to $5.652 per gallon | Trigger mini-bids only where lane benchmarks, acceptance, volume, alternatives, fuel normalization, and service evidence support action | FreightWaves / Logistics Management |
| Heavy-lift critical paths | Project logistics is estimated at $487.62B in 2026, reaching $624.06B by 2031 at 5.06% CAGR | Reserve the executable chain of engineering release, permits, route surveys, civil readiness, crews, cranes, escorts, staging, and commissioning milestones | Mordor Intelligence / CXTMS August 28 analysis |
| Mexico cargo-theft risk | Cargo theft is projected down 37% from 6,263 incidents in 2025, but 14 drivers had been killed by early July and 82% of 2025 robberies involved violence | Preserve lane-, time-, commodity-, carrier-, stop-, and severity-specific security controls instead of relaxing rules from a national average | FreightWaves / CXTMS August 28 analysis |
| Port terminal modernization | Yusen's lease runs through at least 2056 with $200M for zero-emission equipment across roughly 232 acres; Los Angeles handled more than 1M TEUs in June | Connect capital milestones to equipment uptime, gate turns, dwell, rail reliability, event quality, emissions per move, and shipper cost exposure | SupplyChainBrain / Supply Chain Dive |
| Section 338 tariff timing | An additional 50% tariff can add $100,000 to a shipment with $200,000 customs value | Version classification, origin, instruction source, entry status, effective-date logic, approvals, duty scenarios, and later corrections in one import file | Supply Chain Dive / Reuters |
| Warehouse wireless throughput | 58% of surveyed operators used mobile or wireless technology, 42% planned upgrades within two years, and 37% used voice-directed picking | Tie latency, packet loss, roaming, failover, and device density to picks, robot idle time, order rollovers, labor loss, and carrier cutoffs | Modern Materials Handling / CXTMS August 28 analysis |
Technology use cases added on August 28
- Savings-to-service control towers: Trace bid awards through tenders, milestones, invoices, exceptions, store outcomes, and net realized savings.
- Capacity-release clocks: Use fixed checkpoints, probability-weighted demand, contribution, alternate routes, and service exposure to govern protected air space.
- Facility-readiness filters: Convert nominal cold-storage positions into qualified capacity bound to temperature, time, labor, dock, energy, data, and transport constraints.
- Reverse-logistics supply recovery: Manage returned electronics as secure secondary inventory with custody, grading, hazardous-material controls, recovery yield, and recycler evidence.
- Lane-triggered procurement: Combine national pricing signals with lane performance, fuel baselines, carrier depth, volume, and defined mini-bid thresholds.
- Critical-path reservation files: Govern specialized equipment, permits, engineering, civil work, crews, escorts, staging, and commissioning as one linked capacity object.
- Granular cargo-security maps: Apply route, time, commodity, carrier, stop, severity, and escalation evidence to every cross-border shipment.
- Terminal-modernization scorecards: Measure whether capital and clean equipment improve uptime, availability, appointments, dwell, rail flow, event quality, and shipment cost.
- Effective-dated tariff controls: Preserve the rule version, classification, origin proof, entry event, maker-checker approval, landed-cost scenarios, and correction history.
- Warehouse throughput SLAs: Test wireless networks at peak device density and connect technical performance directly to units, labor, automation uptime, and departure cutoffs.
The August 28 synthesis is that logistics systems should treat every market signal and capacity claim as a hypothesis to qualify. The durable advantage comes from knowing what can execute now, under which rule version and constraints, who authorized it, what fallback remains available, and whether the realized result justified the decision.
New Insights from August 29, 2026 Posts
August 29 shifted the retrospective from qualification to continuity. The day's ten posts connected autonomous-truck assistance, medical-device cyber recovery, workforce shortages, carrier-verification outages, freight bankruptcies, manufacturing localization, parcel labor policy, AI data foundations, holiday surcharges, and U.S.-Canada trade exposure. Across them, the durable technology advantage was not perfect automation or uninterrupted data. It was the ability to preserve a trusted operating record, apply a governed fallback, and reconcile the outcome when normal conditions returned.
- Continuity orchestration became a core logistics technology capability. August 29 coverage showed that remote human intervention, cyber outages, missing verification feeds, carrier distress, labor gaps, regulatory changes, and tariff shocks all require the same architecture: shared identifiers, effective-dated rules, named decision rights, tiered fallbacks, customer-impact tracking, and a closed recovery ledger.
Statistics and evidence added on August 29
| Signal from August 29 coverage | Reported statistic | Technology use case | Source |
|---|---|---|---|
| Autonomous-truck exception recovery | Bot Auto completed a 231-mile commercial Texas run without a safety driver, remote operator, or in-cab observer; Einride separately reported 27% revenue growth and a 60% increase in driverless hours | Capture remote-assistance requests, response time, authority, shipment impact, resolution, and intervention rates as structured TMS events | FreightWaves on Bot Auto / CXTMS August 29 analysis |
| Cyber recovery for regulated freight | 23% of medical devices contain at least one known vulnerability and 14% of connected devices run outdated operating systems | Maintain a recovery ledger linking order, inventory, release approval, carrier custody, delivery evidence, and post-outage reconciliation | Supply Chain Dive / CXTMS August 29 analysis |
| Workforce constraints beyond the dock | 55% of organizations called planner and analyst roles hard to extremely hard to fill, 54% said the same of management roles, and 14% still had no dedicated training budget | Convert occupation and shift gaps into facility-, border-, and lane-level capacity risks with escalation and training metrics | SupplyChainBrain / CXTMS August 29 analysis |
| Carrier-verification continuity | Reported fraud incidents rose 18%, average theft value climbed 36% to $273,990, and Q1 recorded 574 U.S. cargo theft incidents, or 6.4 per day | Preserve broker-owned evidence, diversify verification inputs, and apply tiered fallback rules when an API or commercial data relationship fails | SupplyChainBrain / FreightWaves / CXTMS August 29 analysis |
| Carrier financial distress | National truckload spot rates including fuel reached about $2.80 per mile, up 23% from $2.33 a year earlier; reported closures eliminated more than 245 jobs | Rank financial-warning signals by live loads, lane dependence, customer exposure, replacement cost, and recovery capacity | FreightWaves / CXTMS August 29 analysis |
| Regional manufacturing optionality | Lenovo has more than 30 factories across nine markets; among tariff-affected survey respondents, 45% increased inventory, 39% pursued dual sourcing, and 33% developed nearshore suppliers | Compare localization scenarios using inbound component dependencies, finished-goods miles, duties, inventory, service, and recovery capability | Reuters / CXTMS August 29 analysis |
| New York parcel-policy exposure | About 36% of daily parcel volume may be tied to contractor operations covered by the proposal; the city has 50 last-mile facilities above 50,000 square feet | Model facility, labor, carrier-allocation, route-productivity, compliance, and service-promise scenarios at shipment level | Supply Chain Dive / CXTMS August 29 analysis |
| AI data readiness | 84% of respondents planned to adopt AI within five years | Reconcile goods, event-data, and money ledgers through shared operational identifiers before agents tender, reschedule, or approve charges | SupplyChainBrain / CXTMS August 29 analysis |
| UPS holiday surcharge exposure | UPS expects a 24% Q3-to-Q4 U.S. package-volume increase; the 112-day program includes handling fees of $8.75-$11.90, large-package charges of $96.25-$117.50, and over-maximum charges of $530-$590 | Build an effective-dated parcel budget calendar by service, package profile, weekly volume tier, ship date, and invoice rule | Supply Chain Dive / CXTMS August 29 analysis |
| U.S.-Canada commodity exposure | U.S. tariffs of 50% affect $20B of Canadian goods; Canadian measures cover $27.6B in U.S. imports, while Canada supplies roughly two-thirds of U.S. primary aluminum use | Map duties and secondary constraints by commodity, supplier, SKU, packaging input, contract, lane, alternate source, and trigger date | Supply Chain Dive / CXTMS August 29 analysis |
Technology use cases added on August 29
- Record autonomous-truck remote assistance as an exception workflow with authority, timing, customer impact, and outcome evidence.
- Keep a regulated-shipment recovery ledger available when order, manufacturing, or shipping systems are impaired.
- Translate workforce shortages into lane-level capacity, compliance, and recovery-risk scores.
- Use broker-owned carrier evidence and tiered approvals when verification or telematics data becomes unavailable.
- Prioritize carrier financial warnings using actual shipment exposure and replacement-market economics.
- Validate manufacturing localization with total-landed-cost and dependency scenarios rather than plant distance alone.
- Model parcel labor policy through facility, route, carrier, cost, and service-promise scenarios.
- Reconcile physical goods, operational events, and financial truth before giving AI execution authority.
- Apply parcel surcharge rules by effective date, package attributes, volume tiers, and invoice evidence.
- Maintain commodity-level trade exposure maps tied to sourcing, packaging, contracts, duties, and alternate-lane triggers.
The August 29 synthesis is that resilience depends on designed continuity, not improvised recovery. A logistics platform should know which record remains authoritative, who can approve the fallback, how customer and financial exposure changes, and what must be reconciled after the disruption ends.
New Insights from August 30, 2026 Posts
August 30 moved the retrospective from continuity into governed scale. The day's ten posts connected cost agents, executive evidence, ocean overcapacity, municipal chemical shortages, brokerage hiring, forwarder selection, integration reliability, customs workflows, automation-vendor risk, and flexible warehousing. Together they showed that growth and automation are useful only when authority, evidence, dependencies, and financial outcomes remain measurable as the operation expands.
- Governed scale became the operating requirement for logistics technology. August 30 coverage showed that AI agents, larger teams, more integrations, additional facilities, and new capacity all amplify weak controls unless systems preserve decision authority, versioned evidence, dependency maps, service outcomes, and finance reconciliation.
Statistics and evidence added on August 30
| Signal from August 30 coverage | Reported statistic | Technology use case | Source |
|---|---|---|---|
| AI cost-agent governance | 77% of surveyed logistics technology providers offer AI, up 27 percentage points in two years; 85% cited cost reduction as a critical customer challenge; Gartner forecasts agents will make 15% of daily logistics decisions autonomously by 2028 | Tier agent authority, preserve recommendation evidence, protect service constraints, and reconcile projected savings with verified financial outcomes | Inbound Logistics / Inbound Logistics AI statistics |
| Executive evidence continuity | Completed decarbonization actions reported in 2025 fell 53% from the prior reporting cycle | Give incoming supply chain leaders a versioned 30-60-90-day evidence pack covering lanes, inventory, service, contracts, facilities, and changing measurement definitions | Inbound Logistics / CXTMS August 30 analysis |
| Ocean capacity absorption | The container-ship orderbook is nearly 40% of the active fleet | Model deliveries, retirements, speed, network absorption, lane demand, reliability, allocation, and contract-to-spot exposure instead of treating gross orders as usable capacity | FreightWaves / CXTMS August 30 analysis |
| Brokerage growth controls | 65% of surveyed providers grew sales at least 10% YoY, 52% grew customer counts at least 10%, 77% offered AI, and 72% offered data management and analytics | Govern carrier and customer identities, pricing authority, account handoffs, exception queues, and quality-of-growth measures during rapid hiring | Inbound Logistics / CXTMS August 30 analysis |
| Freight procurement evidence | A $500M manufacturer cut monthly LTL cost 16.5% and reached $516,000 annualized savings after rate and insurance-charge controls | Evaluate forwarders with lane scenarios, procurement evidence, measurable milestones, charge audits, data retention, and exit portability | SupplyChainBrain / CXTMS August 30 analysis |
| Integration reliability and security | Security offerings rose 15 percentage points to 35% of surveyed providers; some platforms report automating up to 80% of freight decisions | Define availability, latency, idempotency, replay, authentication, audit, and recovery clauses for every EDI and API connection | Inbound Logistics survey / Inbound Logistics technology trends |
| Trade compliance control | U.S. customs duty collections exceeded $100B; one battery manufacturer reduced an eligible duty rate from 55% to 30%; UPS previously cleared 21% of 13,000 daily packages without manual intervention | Replace spreadsheets with versioned shipment records, structured exception queues, classification evidence, maker-checker controls, and audit-ready automation | Reuters / Supply Chain Dive / Supply Chain Dive on UPS |
| Automation-vendor continuity | FORTNA's proposed recapitalization would reduce debt by about $1.4B and add $285M in financing | Map long-tail vendor dependencies, tie payments to transferable value, preserve documentation and code access, and maintain mid-project recovery plans | Modern Materials Handling / CXTMS August 30 analysis |
| Warehouse overflow economics | First-half U.S. industrial leasing reached 490.6M square feet, up 27.1% YoY; vacancy declined to 7.4% | Compare flexible and permanent capacity using fully loaded storage, handling, transfer, labor, inventory-accuracy, and outbound transport costs | Inbound Logistics / Logistics Management |
Technology use cases added on August 30
- Evidence-bound cost agents: Separate recommendations, approvals, execution, service impact, and finance-verified savings while limiting authority by risk tier.
- Executive evidence packs: Preserve comparable lane economics, inventory positions, service failures, contract exposure, and facility constraints through leadership transitions.
- Ocean absorption models: Convert fleet orderbooks into lane-level effective capacity using delivery timing, removals, speed, network design, demand, and reliability.
- Milestone-adjusted replenishment: Manage municipal chemical continuity through qualified suppliers, inventory coverage, shipment milestones, approvals, and escalation ladders.
- Governed brokerage expansion: Keep identity, pricing authority, customer ownership, carrier evidence, and exception handling consistent as headcount grows.
- Forwarder buyer controls: Test providers with real lane scenarios and require auditable procurement, milestones, charges, data access, retention, and portability.
- Integration reliability contracts: Treat freshness, duplicates, replay, authentication, audit evidence, and recovery as part of automation authorization.
- Shipment-centered compliance: Give specialists versioned product and entry data, structured exceptions, maker-checker approval, and preserved classification evidence.
- Automation dependency continuity: Track vendor health, subcontractors, software, spares, documentation, acceptance artifacts, and step-in rights throughout a project.
- Flexible capacity thresholds: Recalculate overflow choices with total logistics cost and define when recurring flexible demand justifies a permanent node.
The August 30 synthesis is that scale should be treated as a control problem, not a volume achievement. The strongest logistics platforms will let more agents, people, partners, facilities, and integrations participate without losing the evidence that explains who decided, which version applied, what dependency failed, whether service held, and what value finance ultimately verified.
New Insights from August 31, 2026 Posts
August 31 moved the retrospective from governed scale to governed intervention. The day's ten posts connected autonomous warehouse fleets, intermodal handoffs, LTL contracts, managed yards, broker training, sourcing design, rack safety, retail AI, time-critical recovery, and Class 8 cost models. Across them, automation and optionality created value only when people had explicit authority, comparable evidence, and a measurable way to intervene before a bad decision reached the dock, customer, or invoice.
- Human authority became the control plane for automated and multimodal execution. August 31 coverage showed that logistics technology must define who can change a mission, release a hold, select a mode, approve premium spend, override an AI recommendation, accept structural risk, or alter a sourcing plan—and preserve the evidence and outcome of that intervention.
Statistics and evidence added on August 31
| Signal from August 31 coverage | Reported statistic | Technology use case | Source |
|---|---|---|---|
| Truck-capacity attrition | Tender volumes were essentially flat for two years while rejections tripled; an estimated 20%-25% of for-hire truckload capacity exited | Qualify rail conversion lane by lane and govern shipper, 3PL, IMC, drayage, and railroad handoffs with shared milestones and exception ownership | FreightWaves / CXTMS August 31 analysis |
| Dedicated LTL governance | A $500M manufacturer cut monthly LTL cost 16.5% and reached $516,000 in annualized savings | Convert contract terms into routing-guide logic, audit accessorials, and measure realized shipment-level savings | SupplyChainBrain / CXTMS August 31 analysis |
| Retail AI approval controls | 34% of surveyed organizations still require humans to approve all AI actions | Gate execution AI on timely data, named authority, production integration, exception ownership, measurable value, and rollback | Deloitte / CXTMS August 31 analysis |
| Time-critical recovery | About one in three time-critical shipments arrived late before some providers introduced AI and machine-learning tools | Embed event classes, response clocks, qualified carrier tiers, spend ceilings, custody evidence, and fallback authority in the TMS | FreightWaves / CXTMS August 31 analysis |
| Nearshoring readiness | 87% of respondents planned nearshoring pilots in Mexico or Central America over the following two years | Compare global, domestic, and hybrid sourcing through landed-risk cost, activation readiness, and disruption scenarios | Inbound Logistics / CXTMS August 31 analysis |
| Tariff scenario economics | A modeled 25% tariff erased offshore savings and made reshoring potentially cheaper | Keep tariff, supplier, inventory, transport, quality, and recovery assumptions in a versioned sourcing model | Deloitte / CXTMS August 31 analysis |
| Freight-fraud training | U.S. cargo-theft incidents fell 25% from Q4 2025 to Q1 2026, versus a 34% seasonal decline a year earlier | Train brokers to interpret trend context while preserving identity checks, source provenance, and escalation controls | Inbound Logistics / CXTMS August 31 analysis |
| Diesel-sensitive fleet economics | National diesel rose 19.8 cents to $5.652 per gallon after a 19.7-cent increase the prior week | Normalize Class 8 bids across acquisition, mpg, maintenance, residual value, regulation, utilization, and fuel scenarios | Logistics Management / CXTMS August 31 analysis |
Technology use cases added on August 31
- Autonomous material-flow supervision: Join WMS, vehicle-orchestration, charging, safety, dock, and shipment-priority data; measure interventions, productive utilization, touches, safety events, and throughput rather than robot motion alone.
- Intermodal handoff control: Create a shared data contract for cutoffs, equipment, ramps, free time, milestones, costs, and named exception owners across the 3PL-IMC boundary.
- Shipment-level LTL governance: Apply effective-dated rates and accessorial rules to each tender and invoice, then reconcile negotiated savings with service and claims outcomes.
- Managed-yard orchestration: Treat appointments, gates, trailers, doors, labor, detention, and carrier communication as one enterprise control layer with local execution authority.
- Broker training evidence: Teach source verification, identity controls, pricing transparency, exception coding, and fraud escalation as production data disciplines.
- Landed-risk sourcing models: Compare global, domestic, and hybrid networks using total landed cost, disruption probability, recovery time, qualification status, and executable backup capacity.
- Warehouse structural safety: Connect rack and decking certifications, load limits, inspections, product dimensions, and WMS putaway rules so unsafe assignments are blocked before movement.
- Retail AI readiness gates: Require data readiness, named decision rights, integrated action paths, exception ownership, business baselines, and rollback before granting execution authority.
- Preauthorized time-critical response: Match verified business exposure to carrier tiers, spend limits, mode escalation, custody requirements, and time-bound approval fallbacks.
- Class 8 total-cost comparison: Preserve bid assumptions and rerun carrier economics as fuel, utilization, policy, maintenance, and residual values change.
The August 31 synthesis is that human intervention should be designed as part of the system, not treated as evidence that automation failed. The strongest logistics platforms will give trained operators bounded authority, surface the evidence needed to act quickly, preserve every override and handoff, and use realized cost, safety, and service outcomes to improve the next automated decision.
New Insights from September 1, 2026 Posts
September 1 extended the year's central theme from governed intervention to governed commitment. The day's nine posts connected 3PL service levels, Chinese manufacturing signals, semiconductor supply commitments, ocean-carrier economics, cargo theft, outsourced-freight liability, robot-fleet readiness, maritime recovery, fulfillment-center ramp-ups, and tariff refunds. The common lesson was that a forecast, contract, booking, automated asset, or financial recovery should not change execution until the organization can prove readiness, ownership, thresholds, and reconciliation.
- Readiness evidence became the gate for commercial and physical commitments. September 1 coverage showed that logistics systems must qualify capacity before awarding volume, preserve identity and liability evidence before releasing freight, test human and machine operating models before scaling automation, and reconcile shipment-level records before changing bids, supplier settlements, or contingency plans.
Statistics and evidence added on September 1
| Signal from September 1 coverage | Reported statistic | Technology use case | Source |
|---|---|---|---|
| AI-hardware supply constraints | Nvidia increased supply commitments by $160B quarter over quarter, while essential component shortages could raise some prices 50% by midyear | Track wafer, packaging, memory, power, cooling, transport, allocation, and milestone dependencies in a shared supply-commitment ledger | Supply Chain Dive / Deloitte / CXTMS September 1 analysis |
| Robot-fleet readiness gap | 70% of manufacturing leaders expect to manage robot fleets within five years, but only about 40% have a formal human-robot workforce strategy | Gate automation on process instrumentation, safety ownership, exception recovery, maintenance, cybersecurity, and outcome measurement | Supply Chain Dive / CXTMS September 1 analysis |
| Automated fulfillment ramp | Walmart's Georgia project represents $1.3B, about 1.5M square feet, and 1,000 jobs; next-generation facilities can double storage, offer up to 10x more SKUs, and improve productivity by more than 50% | Model yard, dock, induction, putaway, labor, supplier, and carrier capacity as staged launch constraints | Supply Chain Dive / SupplyChainBrain / CXTMS September 1 analysis |
| 3PL automation accountability | One cited AMR deployment increased fulfillment productivity by 200% | Put inventory accuracy, cutoff performance, integration latency, exception recovery, change control, and realized outcomes into the SLA | MHI / CXTMS September 1 analysis |
| Ocean-carrier profit signal | ONE raised its full-year profit forecast from $300M to $900M; average freight rate reached $1,300 per TEU, while the containership orderbook approached 40% of the existing fleet | Test lane-level acceptance, transit, blank sailings, fuel exposure, and forecast assumptions before reopening bids | FreightWaves / CXTMS September 1 analysis |
| China manufacturing signal | Official manufacturing PMI rose to 49.8 from 49.2, but remained below the 50-point expansion threshold for a second month | Reconcile macro indicators with purchase orders, production confirmations, bookings, and lane performance before changing freight commitments | Reuters / CXTMS September 1 analysis |
| Food-and-beverage cargo theft | The stolen Pabst load weighed about 40,000 pounds, represented roughly 50,000 cans, and was valued near $25,000 | Combine driver and carrier identity, seals, geofences, route deviations, custody events, lot data, and incident response in one shipment record | SupplyChainBrain / CXTMS September 1 analysis |
| Maritime recovery verification | Hormuz traffic fell from 17 vessels to seven in one day versus a 10-day average near 15; war-risk premiums reached 33x normal levels | Restore routing guides in stages using persistent AIS movement, insurance, port-call completion, booking acceptance, and transit performance | Reuters / FreightWaves / CXTMS September 1 analysis |
| Tariff-refund reconciliation | Williams-Sonoma received $200M, allocated $47.5M to vendors, and set aside $10M for employee retirement contributions | Build a settlement ledger linking customs entries, duties, POs, SKUs, concessions, suppliers, shipments, and approvals | Supply Chain Dive / CXTMS September 1 analysis |
Technology use cases added on September 1
- Commitment ledgers: Connect supply contracts, capacity milestones, allocations, shipment events, commercial exposure, and accountable owners before scarce AI-infrastructure capacity is promised.
- SLA observability: Measure 3PL integrations, inventory accuracy, cutoff performance, carrier handoffs, exception aging, and stabilization after technology changes.
- Robot-fleet governance: Instrument current work, define mixed-fleet decision rights, capture mission events, and preserve human interventions before scaling.
- Facility-ramp control: Phase suppliers, carriers, appointments, yard capacity, dock capacity, and internal automation against tested throughput ceilings.
- Carrier and liability evidence: Preserve every entity, authority check, tender, subcontracting decision, insurance record, and exception approval across outsourced freight chains.
- Recovery-state machines: Move disrupted corridors from constrained to provisional to normalized only after persistent movement, commercial-risk, port, booking, and service thresholds are met.
- Shipment-level financial reconciliation: Link customs entries, purchase orders, supplier concessions, duties, refunds, inventory, and freight records so settlements can be replayed by auditors.
The September 1 synthesis is that nominal availability is no longer enough. Capacity, service, automation, recovery, and financial benefit become real only when systems can show the evidence that authorizes commitment, the person or rule that owns the decision, the threshold that triggers action, and the outcome that closes the loop.
New Insights from September 2, 2026 Posts
September 2 turned the year's evidence theme into a portability requirement. The day's ten posts connected AI-vendor continuity, omnichannel fulfillment, ocean-data security, ethical sourcing, cross-border fees, procurement handoffs, brewery consolidation, port remediation, multimode shipping, and conference ROI. Across them, a decision remained durable only when its assumptions, permissions, evidence, fallback path, and measured outcome could move across vendors, facilities, modes, regulations, and organizational changes.
- Portable evidence became the foundation for resilient orchestration. September 2 coverage showed that logistics systems must preserve decision-grade records when an AI provider is restricted, an order changes fulfillment node, sensitive ocean data crosses partners, labor remediation gates a shipment, a new fee changes landed cost, procurement hands a plan to transportation, a plant closes, a port runs an environmental pilot, or a parcel order becomes LTL freight.
Statistics and evidence added on September 2
| Signal from September 2 coverage | Reported statistic | Technology use case | Source |
|---|---|---|---|
| AI-vendor continuity risk | Only 27% of surveyed generative-AI users reviewed all generated content; 51% of AI-using organizations reported at least one negative consequence | Test data and workflow portability, retention, manual fallback, restriction response, and contractual exit rights before granting execution authority | McKinsey, State of AI / CXTMS September 2 analysis |
| Store-based fulfillment | 76% of retailers said they already used stores for fulfillment, while 91% expected adoption to grow; 76% of multi-item orders in one dataset crossed product categories | Measure cycle time, split shipments, packages per order, node-level service, and fully loaded cost before changing order-routing logic | Supply Chain Dive / CXTMS September 2 analysis |
| Ocean data exposure | U.S. container imports had risen about 15% YoY, while Shanghai-to-Los Angeles rates increased 63% to $5,756 per 40-foot container from April 2 to June 18 | Maintain a data-exposure register covering fields, counterparties, systems, permissions, retention, geography, sensitivity, and incident escalation | Logistics Management / CXTMS September 2 analysis |
| France fast-fashion fees | Charges began at €0.50 for underwear, €2 for a T-shirt, €9 for jeans, and €12 for a jacket, with the schedule eventually approaching €20 per garment | Version item classification and effective dates, calculate fees at line level, and reconcile checkout estimates with assessed landed cost | SupplyChainBrain / CXTMS September 2 analysis |
| Supply-chain software investment | Average planned spend reached $846,450, up 65% from $512,500; median planned investment rose 21% to $295,800 | Connect sourcing recommendations to executable capacity, lead-time, inventory, labor, facility, and freight constraints through a shared data contract | Logistics Management / CXTMS September 2 analysis |
| Brewery-network consolidation | Sapporo's plan affects about 220 employees; craft-beer production declined 4%, and 60% of breweries reported decreases | Govern inventory depletion, transfers, supplier remapping, packaging assets, lane cutovers, service gates, and rollback from one transition record | Supply Chain Dive / CXTMS September 2 analysis |
| Nature-based port remediation | In a 15-month trial, chicken-liver sponge survival reached 92% and specimens grew from 24 to 40, nearly 67% | Schedule environmental pilots around berths and dredging while recording survival, water quality, biosecurity, cargo interference, and stop criteria | SupplyChainBrain / CXTMS September 2 analysis |
| Unified parcel and LTL workflow | U.S. parcel volume totaled 22.4B shipments in 2024, about 61M per day, and was expected to reach 24B in 2025 | Share order and promise data while keeping mode-specific rating, tender, documentation, tracking, accessorial, invoice, and claims rules explicit | FreightWaves / CXTMS September 2 analysis |
| Technology-investment governance | 55% of supply chain leaders were increasing technology investment, and 60% planned to spend more than $1M | Convert conference claims into sourced evidence, comparable pilots, named owners, measurable baselines, and 30/60/90-day scale-or-stop reviews | MHI Annual Industry Report / CXTMS September 2 analysis |
Technology use cases added on September 2
- AI continuity tests: Map model dependencies, exports, retention, manual procedures, restriction triggers, recovery objectives, and termination assistance before production approval.
- Omnichannel outcome ledgers: Tie each routing decision to inventory confidence, node capacity, shipment events, split cost, delivery outcome, and customer promise.
- Ocean data-exposure registers: Separate operational performance, sanctions screening, and security concerns while limiting access to sensitive shipment and network fields.
- Ethical-sourcing release gates: Connect worker-remediation evidence, supplier status, purchase orders, lots, approvals, and shipment holds in one auditable workflow.
- Effective-dated landed-cost engines: Apply product-level regulatory fees by destination and date, preserve calculation versions, and reconcile estimated and actual charges.
- Procurement-to-TMS data contracts: Pass quantities, allocations, lead times, capacity assumptions, inventory limits, service rules, and fallback scenarios into execution.
- Production cutover control: Coordinate depletion, transfers, suppliers, packaging, labor, carrier capacity, customer lanes, service gates, and rollback during facility consolidation.
- Port pilot guardrails: Combine environmental measures with berth windows, vessel schedules, dredging constraints, biosecurity checks, and explicit stop criteria.
- Mode-aware unified shipping: Normalize the customer order while retaining parcel- and LTL-specific rating, tendering, event, accessorial, document, and claims controls.
- Evidence-to-backlog workflows: Turn external ideas into verified claims, prioritized pilots, accountable owners, baseline metrics, and time-bound investment decisions.
The September 2 synthesis is that integration without portability creates a new form of lock-in. The strongest logistics platforms will keep operational truth usable when providers, nodes, modes, regulations, or owners change—and will preserve enough evidence to replay why a decision was authorized, how it was executed, and whether it delivered the promised result.
New Insights from September 3, 2026 Posts
September 3 made decision provenance the practical counterpart to portability. The day's nine posts connected promotional inventory, maritime casualty recovery, human oversight of AI, counterfeit enforcement, drought-constrained waterways, freight-app shutdowns, marketplace delivery, rail-served plant design, infrastructure risk, and software integration economics. Across them, operational speed depended on keeping the source data, assumptions, authority, thresholds, and outcome attached to every consequential decision.
- Decision provenance became the control layer for adaptive execution. September 3 coverage showed that logistics systems must explain why inventory was committed, an AI recommendation was overridden, cargo was held or replaced, a customer promise changed, a mode or route was selected, and an integration was accepted. A timestamped decision record turns human judgment and automated action into reusable operating evidence.
Statistics and evidence added on September 3
| Signal from September 3 coverage | Reported statistic | Technology use case | Source |
|---|---|---|---|
| Promotional inventory discipline | Bath & Body Works ended Q2 with inventory down 10% YoY; 54% of surveyed companies planned to increase investment in inventory and network optimization | Link seasonal purchase-order releases to sell-through, inbound milestones, replenishment thresholds, and markdown exposure | Supply Chain Dive / CXTMS September 3 analysis |
| AI assortment governance | Retail AI has reduced inventory costs 10%-20% and stockouts by as much as 30% | Preserve model inputs, recommendations, merchant overrides, reason codes, effective dates, and realized sales and replenishment outcomes | McKinsey / CXTMS September 3 analysis |
| Counterfeit commercial-evidence chain | One California seizure recovered 25,898 items valued near $10M; CBP seized nearly 79M counterfeit items valued above $7.3B in FY2025 | Connect supplier, importer, PO, invoice, container, carton, inspection, payment, hold, and disposition records | FreightWaves / CBP / CXTMS September 3 analysis |
| Rhine low-water capacity | Inland waterways carry about 473M tonnes annually and the Rhine handles about 70%; vessels recently carried less than one-quarter of normal cargo | Convert gauge readings and carrier advisories into payload bands, modal triggers, allocation rules, and revised customer promises | SupplyChainBrain / CXTMS September 3 analysis |
| Rapid-delivery marketplace scale | DoorDash completed tens of millions of retail and grocery deliveries in under 30 minutes across more than 22,000 ZIP codes in Q1 | Create a store-order event record spanning reservation, picking, handoff, delivery, substitution, cancellation, refund, and margin | Supply Chain Dive / CXTMS September 3 analysis |
| Rail-served plant design | A $40M lumber expansion includes up to $600,000 in rail infrastructure and at least 421 annual railcar shipments by 2030 | Model siding capacity, switching windows, production readiness, railcar supply, truck fallback, emissions, and customer appointments together | Supply Chain Dive / CXTMS September 3 analysis |
| National infrastructure exposure | More than 54M tons worth over $68B move through the U.S. freight network daily; the network spans nearly 7M miles | Map each facility to bridges, gates, border crossings, ramps, alternates, exposure scores, owners, and review triggers | Logistics Management / CXTMS September 3 analysis |
| Software integration economics | Average planned supply chain software spend rose 65%, from $512,500 to $846,450 | Separate license, integration, data, training, and change costs; release funds against tested shipment workflows and acceptance metrics | Logistics Management / CXTMS September 3 analysis |
Technology use cases added on September 3
- Decision and override ledger: Record the recommendation, governing data, approver, reason, effective window, downstream action, and realized result for AI-assisted inventory and assortment decisions.
- Consignment-level casualty recovery: Unite manifests, bills of lading, ownership, insurance, salvage instructions, replacement sourcing, claims, milestones, and customer communications after a maritime incident.
- Commercial-evidence screening: Preserve the chain from supplier qualification and importer identity through port inspection, warehouse hold, authentication, disposition, and enforcement response.
- Climate-aware promise engine: Translate water depth and payload restrictions into available capacity, inventory allocation, mode alternatives, landed cost, and customer-date changes.
- Vendor-exit continuity: Continuously export load, document, payment, subscription, user-access, and integration records in standard formats and test manual dispatch fallback.
- Store-order orchestration: Reconcile marketplace demand with store inventory, labor, picking cutoffs, courier capacity, substitutions, refunds, service, and fully loaded margin.
- Facility dependency mapping: Score the roads, bridges, ports, rail ramps, utilities, and alternate modes supporting each site, with preapproved actions at defined thresholds.
- Integration acceptance control: Measure carrier-volume coverage, message success, latency, exception closure, financial reconciliation, and user adoption before declaring go-live complete.
The September 3 synthesis is that adaptability without provenance is guesswork. The strongest execution platforms will keep the facts and authority behind each decision attached to the operational record, so teams can act faster during disruption, audit the result, and improve the next rule instead of reconstructing events afterward.
New Insights from September 4 Coverage
| Signal from September 4 coverage | Reported statistic | Technology use case | Source |
|---|---|---|---|
| Holiday parcel cost calendars | Amazon Shipping demand surcharges run $0.50-$0.75 per package from Oct. 25, 2026, through Jan. 16, 2027; FBA also carries a 3.5% fuel and logistics surcharge | Apply effective-dated, order-level fee logic before promising margin or selecting service | Supply Chain Dive / CXTMS September 4 analysis |
| New-node qualification | Averitt's Jackson site adds 100,000 square feet; its broader plan adds 900,000 square feet, 379 dock doors, and 2,000 parking spaces by 2027 | Pilot lanes against baseline cost, cutoff, inventory, and service data before reallocating volume | FreightWaves / CXTMS September 4 analysis |
| Driver-qualification provenance | DOT removed 110 CDL schools tied to 5,000 language violations; the sweep covered 200+ schools in 23 states | Preserve training-provider lineage, trigger onboarding holds, and reverify incumbent carriers | FreightWaves / CXTMS September 4 analysis |
| Packaging as a freight decision | Boxes can contain 40%-60% empty space; dimensional analysis may yield 5%-20% savings | Combine damage risk, consumer preference, cube, carrier thresholds, waste, and returns in cartonization rules | SupplyChainBrain / CXTMS September 4 analysis |
| Leading logistics inflation | The March-August Logistics Cost Index averaged 241.9; August reached 243.6 | Trigger budget, procurement, warehouse, and inventory actions before inflation reaches invoices | SupplyChainBrain / FreightWaves / CXTMS September 4 analysis |
| Logistics technology consolidation | Four disclosed supply chain technology acquisitions exceeded $100M, alongside 40 undisclosed transactions | Map integrations to shipment volume, test data portability, and maintain vendor exit paths | Inbound Logistics / CXTMS September 4 analysis |
| De minimis-driven inventory placement | EU low-value ecommerce parcel imports rose 26% in 2025 as the former exemption covered shipments below EUR150 | Compare direct-ship and local-stock economics with duty, lead time, demand, and warehouse constraints | Reuters / CXTMS September 4 analysis |
| Event logistics control towers | Late trade-show freight can incur surcharges as high as 30% | Plan backward from venue deadlines and automate milestone, document, appointment, and escalation ownership | Inbound Logistics / CXTMS September 4 analysis |
| Revision-aware capacity planning | U.S. employment growth was revised down by 862,000 jobs; August transportation capacity was 40 while utilization reached 70.6 | Blend labor revisions with utilization, tender rejection, rates, and service rather than treating headcount as capacity | Reuters / FreightWaves / CXTMS September 4 analysis |
The new evidence sharpens the year's central conclusion: logistics technology creates value when it converts dates, identities, qualifications, costs, and dependencies into enforceable release rules. The practical unit of digital transformation is no longer the dashboard. It is the governed decision—whether to accept an order, release an import, qualify a driver, shift inventory, open a node, or trust a vendor after ownership changes.
New Insights from September 5 Coverage
| Signal from September 5 coverage | Reported statistic | Technology use case | Source |
|---|---|---|---|
| Deployable ocean capacity | The global container fleet was about 8,000 TEU short of 34M TEU; ships above 12,000 TEU supplied two-thirds of the 10M TEU added since 2021 | Discount nominal lane capacity for sailing operation, commercial access, equipment availability, and reliability before committing volume | SupplyChainBrain / CXTMS September 5 analysis |
| AI asset-data capture | Tire handling fell from four minutes to one minute, errors declined 80%-90%, accuracy exceeded 99%, and hourly throughput rose about 30% | Treat computer-vision output as auditable asset identity evidence with confidence thresholds, review queues, and release controls | Inbound Logistics / CXTMS September 5 analysis |
| Dry-bulk chartering pressure | The Baltic Dry Index reached 3,331, while Capesize vessels commonly carry about 180,000 DWT | Convert market indexes into route-specific budget, timing, cargo-readiness, and alternate-vessel triggers | FreightWaves / CXTMS September 5 analysis |
| Production-to-distribution ramp | Chobani's $1.2B campus spans 1.5M square feet, up to 10 lines, 900+ jobs, and more than 3B pounds of milk annually | Gate each line launch on inbound supply, quality release, cold storage, labor, reefer capacity, and customer appointments | Supply Chain Dive / CXTMS September 5 analysis |
| Ocean ETA confidence | Global container schedule reliability fell to 56.4%, down 6.1 points, the sharpest monthly decline in five years | Pair dynamic ETA ranges with explainable confidence scores and threshold-driven inventory, appointment, and customer actions | FreightWaves / CXTMS September 5 analysis |
| Fulfillment process compression | Nuuly's site expanded to 1M square feet for up to 600,000 subscribers; automation can improve ecommerce warehouse productivity by as much as 20% | Validate compressed workflows with volume, exception, recovery, and handoff tests before freezing automation design | Supply Chain Dive / Prologis / CXTMS September 5 analysis |
| Forced-labor shipment release | CBP detained roughly 42,000 shipments worth nearly $4B under UFLPA through February 2026; EU product-ban rules take effect Dec. 14, 2027 | Build product-level evidence graphs and block booking, loading, customs filing, or delivery until release criteria are met | Reuters / SupplyChainBrain / CXTMS September 5 analysis |
| Multimodal cold-chain custody | About 1.3B tonnes, roughly one-third of food produced globally, is lost or wasted | Bind sensor readings to device identity, calibration, mode handoffs, seals, owners, alerts, and disposition decisions | Reuters / CXTMS September 5 analysis |
| Closed-loop rental automation | Nuuly served roughly 500,000 subscribers, with quarterly sales up 28.6% and active subscribers up 30.4% | Measure automation by cost and cycle time per complete rental turn, including reverse logistics, cleaning, inspection, and reavailability | Supply Chain Dive / CXTMS September 5 analysis |
| Long-horizon lane resilience | A 10-year Jacksonville-San Juan terminal agreement adds Dockworks visibility, with customer tools expected in 2027 | Convert contract tenure into annual capacity, service, technology, cyber, and contingency checkpoints by shipment profile | FreightWaves / CXTMS September 5 analysis |
September 5 adds a disciplined denominator to the year's technology story. Fleet size, facility square footage, subscriber capacity, faster scans, live sensor feeds, and long contracts are useful only after operators measure how much is actually deployable, reliable, admissible, recoverable, and economical. The strongest execution systems will calculate that confidence continuously and preserve the evidence behind every release, booking, escalation, and override.
New Insights from September 8, 2026 Posts
September 8 made a useful shift from broad visibility toward decision clocks, acceptance tests, and versioned operating rules. Across tariffs, border crossings, airports, warehouses, carrier accounts, security, inventory, and LTL, the common requirement was to identify the moment when waiting becomes more expensive or risky than acting—and preserve the evidence behind that action.
| Signal from September 8 coverage | Reported statistic | Technology use case | Source |
|---|---|---|---|
| Part-level tariff version control | Automotive measures included 25% vehicle/component tariffs and 50% steel, aluminum, and copper duties; some derivatives below 15% covered-metal weight moved to 25% | Calculate landed cost by part, content, origin, program, entry date, and approved rule version | Supply Chain Dive / CXTMS September 8 analysis |
| Border integration acceptance | CBP's rulings database contains 190,000+ rulings across a 99-chapter tariff schedule | Run a 90-day broker-acquisition acceptance test covering identifiers, importer authority, holds, clearance time, and escalation ownership | CXTMS September 8 analysis |
| India air-gateway allocation | FedEx committed $400M across Delhi and Mumbai; Delhi is designed for 4,000 packages per hour | Score gateways by on-time performance, landed cost, customs predictability, handling risk, and commodity fit | FreightWaves / FreightWaves / CXTMS September 8 analysis |
| Flexible warehouse robotics | 52% of respondents use robots, 32% plan deployment within three years, 74% met business goals, and 94% met or beat speed-to-results expectations | Buy automation as measurable capacity using sustained throughput, utilization, recovery time, human touches, and support limits | Modern Materials Handling / CXTMS September 8 analysis |
| Freight leadership continuity | FedEx Freight represented 17% of the U.S. LTL market with 355 service centers and about 30,000 vehicles | Preserve account ownership, pricing authority, escalation paths, bid commitments, and implementation baselines through executive transitions | FreightWaves / CXTMS September 8 analysis |
| Border equipment repositioning | Laredo processes 17,000+ commercial truck crossings daily | Prioritize empty trailers in a shared queue using next-load urgency, yard congestion, driver hours, crossing windows, and owner confirmation | FreightWaves / CXTMS September 8 analysis |
| Airfreight diversion clocks | Miami handled almost 3.5M tons of freight in 2025 | Trigger alternate-airport capacity checks and rerouting at defined time thresholds while preserving booking, custody, customs, and customer records | SupplyChainBrain / CXTMS September 8 analysis |
| Dwell-driven cargo security | Confirmed theft rose 18%, average loss rose 36% to $273,990, and 71% of reported thefts occurred in unsecured parking | Recalculate a shipment risk score from dwell, location security, cargo attractiveness, custody, and identity events; bind score bands to mandatory actions | FreightWaves / Inbound Logistics / CXTMS September 8 analysis |
| Factory inventory release | U.S. factory inventories reached $966.9B; multi-echelon optimization can reduce inventory cost by up to 15% and improve availability by up to 5% | Release freight using order age, demand confidence, storage cost, capacity, reason-coded overrides, and expiration dates | SupplyChainBrain / CXTMS September 8 analysis |
| Density-aware LTL economics | XPO daily shipments rose 5.7%, weight per shipment fell 1.8%, and tonnage increased 3.7% | Reconcile cost per shipment, hundredweight, pallet, handling event, cube, density, and minimum-charge incidence before carrier bids | FreightWaves / CXTMS September 8 analysis |
The new insight is that time and context are now first-class logistics data. A tariff rate without an effective date, a robot count without recovery evidence, an airport option without a diversion deadline, or an inventory balance without demand confidence is not decision-ready. The most useful logistics systems convert each signal into a governed threshold, named owner, fallback action, and measurable outcome.
New Insights from September 9, 2026 Posts
September 9 extended the decision-clock idea into promise governance across modes and facilities. Truckload acceptance, food recalls, parcel delivery, refrigerated condition, furniture hubs, ocean fuel, store inventory, factory ramps, assortment changes, and yard moves look like separate disciplines, but each depends on the same operating pattern: normalize the signal, bind it to a threshold, assign the response, and retain evidence through the final outcome.
| Signal from September 9 coverage | Reported statistic | Technology use case | Source |
|---|---|---|---|
| Dynamic truckload routing guides | National tender rejections were about 14%; reefer rejections reached 20%-20.5%, while the cited spot measure rose nearly 2% month over month | Activate backup carriers, spot controls, and selective mini-bids from lane-level acceptance and price thresholds | FreightWaves / CXTMS September 9 analysis |
| Produce recall precision | Cyclospora cases reached as many as 31,000 since May, roughly 26 times a typical year's infection rate | Link lot, custody, temperature, consignee, and quantity records so recalls isolate affected loads instead of freezing an entire network | Supply Chain Dive / CXTMS September 9 analysis |
| Multi-carrier parcel normalization | 56% of enterprise shippers manage at least three parcel carriers and 22% manage six or more | Preserve raw carrier scans while translating them into canonical tender, transit, exception, and proof-of-delivery milestones | CXTMS September 9 analysis |
| Cold-chain exception control | 30%-40% of food in developed countries is wasted before market; the U.S. cold-chain market was projected to grow 15.9% CAGR through 2032 | Select active or passive sensors by route risk and connect readings to custody, dwell, alert, and disposition workflows | Inbound Logistics / CXTMS September 9 analysis |
| Bulky-freight hub design | La-Z-Boy's $23M, 150,000-square-foot hub supports a network targeting 30% less warehouse space and 20% fewer inventory miles | Model cube, damage, handling, appointments, cross-docks, and delivery radius as linked network constraints | Supply Chain Dive / CXTMS September 9 analysis |
| Marine-fuel allocation | Refinery strain raised the prospect of bunker-fuel shortages after Asian bunker premiums had already reached record highs | Protect priority containers with lane-level fuel alerts, allocation tiers, surcharge audits, and alternate-port rules | Reuters / CXTMS September 9 analysis |
| Store-fulfilled same-day delivery | Petsense opened delivery from 130+ stores in as little as one hour, building on service from 2,400+ Tractor Supply stores | Govern available-to-promise inventory, substitutions, marketplace handoffs, shared statuses, and zone-level service economics | Supply Chain Dive / CXTMS September 9 analysis |
| Reshoring launch control | 36% of surveyed OEMs had reshored or were doing so, and 63% planned domestic investment | Convert announcements into phased supplier lanes, warehouse reservations, mode plans, carrier commitments, milestones, and scenario gates | Supply Chain Dive / CXTMS September 9 analysis |
| SKU-to-freight economics | Sportsman's Warehouse cut inventory 10%, or $44.5M, to $399M while improving core in-stocks | Connect assortment decisions to consolidation, cube, minimum charges, expedites, inventory timing, and service by SKU | Supply Chain Dive / CXTMS September 9 analysis |
| Digital yard workflow | Manual processes led dock-and-yard challenges at 39%, followed by congestion at 36%, labor shortages at 35%, and visibility gaps at 31% | Digitize move requests, trailer location, call-to-door SLAs, door dwell, safety completion, detention, and provider scorecards | Logistics Management / CXTMS September 9 analysis |
The new insight is that a customer promise is only as reliable as its least-governed handoff. A one-hour delivery window, accepted truckload tender, recall release, cold-chain threshold, hub transfer, production launch, or yard-door assignment all need a shared event vocabulary and explicit response logic. Visibility becomes valuable when the system can distinguish an informative update from an event that must change the plan.
New Insights from September 10, 2026 Posts
September 10 brought the year's governance themes together around transition-ready operating records. Carrier qualification, acquisitions, airport handling, warehouse automation, peak planning, project cargo, and freight procurement all exposed the same weakness: nominal capacity or a signed agreement does not prove that a real shipment can move safely through a changed network. The operating system must preserve identity, ownership, thresholds, service evidence, and fallback options at the level where work is assigned.
- Transition readiness became the gate between announced capacity and executable service. September 10 coverage showed that systems must verify the driver and equipment behind a carrier assignment, the support owner behind warehouse automation, the custodian behind an air-cargo exception, and the route, data permissions, or contract threshold behind a network change before treating the new arrangement as operational.
| Signal from September 10 coverage | Reported statistic | Technology use case | Source |
|---|---|---|---|
| Assignment-level carrier compliance | A four-state enforcement operation issued about 766 out-of-service orders and arrested 86 drivers; roughly 20,000 Mexican driver visas were reportedly revoked from April 2025-April 2026 | Revalidate driver, equipment, authority, movement purpose, and supporting international references at tender and dispatch | FreightWaves / CXTMS September 10 analysis |
| Critical-path copper logistics | The U.S. faced a projected 330,000-metric-ton refined copper deficit in 2026; grid-related demand could rise from 12.52M tonnes in 2025 to 14.87M by 2030 | Connect allocation, fabrication, inspection, drum attributes, permits, pickup, site readiness, and proof of delivery in one milestone plan | Supply Chain Dive / Reuters / CXTMS September 10 analysis |
| No-deal food-network resilience | The food cold-chain market was estimated at $78.55B in 2026, growing to $134.4B by 2031 at 11.34% CAGR | Maintain reversible merger scenarios, clean-room controls, temperature-qualified alternatives, and separate close/no-deal readiness scores | Mordor Intelligence / CXTMS September 10 analysis |
| Local-delivery integration | Acquired carrier networks collectively handle 1M+ pieces annually; manual route-option management becomes difficult at roughly 15-20 stops | Normalize zones, services, surcharges, scans, proof of delivery, notification rules, and dispatch constraints across legacy systems | FreightWaves / Inbound Logistics / CXTMS September 10 analysis |
| Airport throughput accountability | LUG operates 538,000+ square feet across three German airports; Lufthansa's Frankfurt program covers 3.5M square feet and $682M of investment | Measure acceptance-to-availability time, queue age, missed connection risk, damage, and exception ownership as customer-facing SLAs | FreightWaves / CXTMS September 10 analysis |
| Peak-season exception planning | 52% of surveyed logistics stakeholders expected a more active peak, versus 27% a year earlier; only 19% expected a quieter season | Convert sentiment into mode- and lane-specific capacity, service, cost, inventory, and cutoff thresholds with named owners | Logistics Management / CXTMS September 10 analysis |
| Air-cargo custody through acquisition | PrimeFlight acquired a 120,000-square-foot Miami warehouse and handling operations in Richmond and San Juan | Preserve shipment-level custody, exception ownership, contract version, evidence, communications, and 30-day transition scorecards | FreightWaves / CXTMS September 10 analysis |
| Lane-level freight buying | Weekly all-in rates reached $2.95/mile for van and $3.54 for reefer and flatbed; tender rejections settled near 14% | Separate fuel from linehaul and trigger spot, mini-bid, or contract decisions from lane acceptance, volatility, dwell, and failure cost | Logistics Management / FreightWaves / CXTMS September 10 analysis |
| Warehouse automation support | 95% of surveyed buyers called fast support essential; 92% prioritized reliability and uptime, while integration compatibility rose to 68% | Test incident ownership, interface recovery, rollback, spares, and after-hours escalation during acceptance—not after go-live | Modern Materials Handling / CXTMS September 10 analysis |
| Neutral forwarding handoff | 24% of forwarders still used fully manual processes, 49% were fully cloud-based, and 73% offered a digital portal | Preserve customer-level permissions, quote terms, routing instructions, credit, milestones, and negative access tests through acquisition cutover | Inbound Logistics / CXTMS September 10 analysis |
The new insight is that integration quality is best measured by the exceptions it can survive. A new carrier, owner, facility, automation stack, project milestone, or procurement rule becomes trustworthy only when teams can identify the responsible party, reconstruct the governing evidence, invoke a tested fallback, and compare the outcome with the pre-change baseline.
New Insights from September 11, 2026 Posts
September 11 sharpened the year's central lesson into decision-grade eligibility. National capacity headlines, valid-looking credentials, available components, sourcing awards, platform growth, falling indexes, record port throughput, market forecasts, and repair schedules are not executable facts by themselves. Each must be qualified against the shipment, location, time window, responsible party, and fallback before software commits freight, inventory, or money.
- Headline capacity became less useful than qualified, local capacity. September 11 coverage showed that parcel resilience must be measured by ZIP code, rail pressure by commodity and corridor, ocean cost by booking-date variance, port performance by inland velocity, component availability by deliverable-order completeness, and credentials by issuer evidence. The shared technology requirement is a versioned decision record that converts broad signals into shipment-level eligibility and preserves what happened after release.
| Signal from September 11 coverage | Reported statistic | Technology use case | Source |
|---|---|---|---|
| Parcel network concentration | Amazon projects its own network will deliver 88.7% of its U.S. packages by 2029; USPS would handle 8%, UPS 1.4%, and FedEx 0.4% | Score carrier and label-path concentration by ZIP code and service, then maintain tested failover rules | Supply Chain Dive / SupplyChainBrain / CXTMS September 11 analysis |
| Credential-issuer verification | FMCSA removed 3,000 training providers; documented schemes spanning 25 years involved 6,000+ fraudulent licenses and at least 13 deaths | Preserve the issuer, training provider, identity match, source check, expiry, and requalification workflow—not only the CDL number | FreightWaves / CXTMS September 11 analysis |
| Deliverable-order allocation | Dell's latest quarterly revenue rose 88% YoY to $43.8B while AI-system shortages widened across memory, storage, racks, cooling, networking, and power | Allocate scarce parts against configuration completeness, inbound confidence, margin, promise risk, and logistics feasibility | Supply Chain Dive / CXTMS September 11 analysis |
| Automotive supplier ramp | Hyundai targets 80% North American parts sourcing by 2030 alongside $26B in U.S. investment through 2028 and 36 planned regional model launches | Gate supplier nominations through tooling, validation, packaging, lane, capacity, and production-readiness milestones | Supply Chain Dive / Reuters / CXTMS September 11 analysis |
| Fleet-platform portability | Motive raised $1.3B after annual recurring revenue crossed $600M and growth reached 30% YoY | Test API completeness, event replay, export formats, history retention, degraded-mode operation, and contract-exit support | FreightWaves / CXTMS September 11 analysis |
| Ocean booking variance | Asia-U.S. West Coast rates fell 1% to $7,569/FEU while East Coast rates fell 3% to $9,505/FEU, yet both remained elevated | Reconcile quote, booking, rollover, routing, shipment-change, accessorial, and invoice deltas in a dated cost ledger | Supply Chain Dive / CXTMS September 11 analysis |
| Gateway-to-inland velocity | Los Angeles moved a record 2.9M+ TEUs across June-August; August volume was 955,907 TEUs | Compare terminal dwell, rail dwell, drayage, appointment, inland transit, and landed cost before reallocating gateway volume | FreightWaves / CXTMS September 11 analysis |
| Lane-level truckload buying | Van spot rates reached $2.43/mile, roughly 20% YoY higher; Cass implied about 9% higher rates while shipments fell 4.5% | Convert forecasts into lane-specific tender, mini-bid, spot, and escalation thresholds with confidence and error tracking | FreightWaves / CXTMS September 11 analysis |
| Rail commodity capacity | Through week 35, U.S. railroads moved 7.99M carloads and 9.90M intermodal units, up 2.8% and 4.2% YoY | Decompose national growth by commodity, equipment, origin, interchange, corridor, and drayage overlap | FreightWaves / CXTMS September 11 analysis |
| Repair-yard voyage continuity | Broader industry data recorded 209 ship fires in 2022, the highest annual count in a decade and 17% above 2021 | Track custody, hot-work controls, repair milestones, substitute capacity, customer notices, and documented return-to-service gates | Reuters / CXTMS September 11 analysis |
The new insight is that eligibility is the missing layer between visibility and automation. A system may see a carrier, component, rate, port, railcar, supplier, vessel, or platform, but it should not treat that option as usable until identity, timing, physical fit, commercial terms, supporting evidence, and recovery paths have been checked at the level of the actual commitment.
New Insights from September 12, 2026 Posts
September 12 made the year's eligibility argument more concrete: capacity only becomes operational when its economics, physical constraints, evidence, and recovery clock are connected in one decision record. A rail lane, electric truck, factory ramp, breakbulk terminal, alternate flight, parcel recommendation, or security hold may look attractive in isolation and still fail once drayage, charging, component readiness, custody, contractual authority, or exception costs are included.
- Qualified capacity became a full-path calculation. September 12 coverage linked truck-to-rail conversion, volatile truckload buying, AI-infrastructure construction, factory material ramps, electric drayage, breakbulk handoffs, parcel AI, produce-security screening, medical-cargo recovery, and air-traffic disruption contracts. The common technology requirement is a shipment- or asset-level ledger that tests total economics, readiness, plausibility, authority, and fallback timing before committing capacity.
| Signal from September 12 coverage | Reported statistic | Technology use case | Source |
|---|---|---|---|
| Texas AI-hardware factory ramp | Amazon and Wiwynn expect nearly 1,000 new jobs by end-2027, more than 2,500 employees in 2027, and 4,000 at full capacity; Dell quarterly revenue rose 88% YoY to $43.8B amid component constraints | Link labor, equipment commissioning, supplier qualification, ASNs, border events, dock appointments, and line-side coverage in one launch control tower | SupplyChainBrain / Supply Chain Dive / CXTMS September 12 analysis |
| Truck-to-rail conversion | Domestic intermodal volume ran roughly 20% above the prior year in a recent week; U.S. railroads handled 8,418,215 intermodal units in the first 30 weeks, up 3.8% YoY | Rank lanes by fully loaded cost, service tolerance, ramp and drayage capacity, inventory impact, and expected recovery expense | FreightWaves / FreightWaves / CXTMS September 12 analysis |
| Finland data-center project logistics | Google plans €13B (about $15B) through 2030 across three new sites and Hamina; transformers can require up to 52 weeks | Build portfolio-wide milestone and capacity maps for long-lead equipment, gateways, staging, lifts, energy dependencies, and commissioning | SupplyChainBrain / Supply Chain Dive / CXTMS September 12 analysis |
| Produce-load plausibility | Authorities seized 2,000+ pounds of methamphetamine concealed in cabbage; separate coverage identified $101M+ in narcotics seized from commercial loads over three weeks | Score commodity, weight, route, equipment, seal, carrier, temperature, and document combinations while preserving cold-chain custody during holds | FreightWaves / FreightWaves / CXTMS September 12 analysis |
| Parcel AI value governance | 56% of enterprise shippers manage at least three parcel carriers and 22% manage six or more | Preserve each routing recommendation, then reconcile modeled savings, surcharges, invoice truth, claims, and on-time performance with rollback thresholds | SupplyChainBrain / CXTMS September 12 analysis |
| Electric drayage replacement | Port of New York and New Jersey plans a $39M ZEV voucher program plus $5M for charging; battery-electric day cabs were about 3x a diesel unit in cited pricing | Rank replacement candidates by route, payload, range, dwell, charger readiness, incentive timing, and cost per completed move | Supply Chain Dive / FreightWaves / CXTMS September 12 analysis |
| Savannah breakbulk handoff | New facility spans 25 acres, has an 810-foot dock and 14,000+ feet of rail, and was designed for 1M+ tons of throughput | Engineer vessel, terminal, rail, truck, storage, lifting, document, appointment, and final-site handoffs before booking | FreightWaves / CXTMS September 12 analysis |
| Medical air-cargo recovery | Disabled aircraft held 32,000+ pounds of contact lenses | Run parallel salvage, quarantine, and replacement paths with lot identity, condition, custody, access authority, timed escalation, and quality release in one recovery ledger | FreightWaves / CXTMS September 12 analysis |
| Truckload signal divergence | Volume index fell nearly 15%, but spot rates held at $3.44/mile, 47% above the prior year; reefer rejection remained above 20% | Diagnose origin tightness, destination imbalance, equipment constraints, shipment design, and modal alternatives before spot buying | FreightWaves / CXTMS September 12 analysis |
| Air-traffic-control disruption | U.K. airports logged 1,750+ cancellations on September 8 and British Airways canceled another 200 flights September 9; August air spot rates averaged $3.13/kg, up 24% YoY | Encode notice, alternate-uplift, approval, storage, handling, condition-loss, liability, and cost-reconciliation clocks in shipment contracts and workflows | SupplyChainBrain / Supply Chain Dive / CXTMS September 12 analysis |
The new insight is that the usable-capacity question must follow the entire path. Logistics software should not approve a mode, asset, facility, supplier ramp, automated recommendation, or recovery plan from a headline rate or nominal capability. It must prove that every dependent handoff is ready, price the expected exception, identify the decision owner, and preserve a timed fallback.
New Insights from September 13, 2026 Posts
September 13 moved the year's eligibility theme from qualification into commitment control. Stronger demand, faster approvals, a labor agreement, a checkout guarantee, a backup corridor, or an available software update can improve an operating plan, but none should trigger a commitment until the underlying evidence, timing, ownership, and recovery path are explicit.
- Operational signals became governed commitment gates. September 13 coverage linked LTL density, aerospace labor milestones, accelerated infrastructure approvals, freight-emissions evidence, landed-cost guarantees, replenishment timing, energy-route disruption, broker liability records, border throughput, and truck software maintenance. Across all ten topics, the common requirement is a versioned decision record that distinguishes an encouraging signal from an executable commitment.
| Signal from September 13 coverage | Reported statistic | Technology use case | Source |
|---|---|---|---|
| LTL density and mix | ArcBest tonnage rose 9% YoY while daily shipments fell 4% and weight per shipment rose 14% | Separate shipment count, weight, yield, cube, and lane overlap before changing consolidation or mode rules | FreightWaves / CXTMS September 13 analysis |
| Aerospace labor-to-release status | Boeing delivered 60 jets in May, up 33% YoY, while its engineer agreement remained tentative | Map tentative, ratified, and implemented labor states to supplier releases, booking confidence, approval queues, and premium-freight fallbacks | Reuters / CXTMS September 13 analysis |
| Project-logistics commitment clock | Britain's reform could shorten approvals by up to 12 months; oversized-move permits can take one to six months | Tie market watch, provisional holds, route studies, permits, and firm bookings to confidence-weighted project milestones | Reuters / Inbound Logistics / CXTMS September 13 analysis |
| Freight-emissions evidence | California Scope 3 disclosure begins in 2027 using 2026 fiscal-year activity; one pathway found 30% of Scope 3 emissions could be abated through relatively straightforward measures | Preserve shipment activity, factors, boundaries, assumptions, method versions, and recalculations independently of changing guidance pages | Deloitte / McKinsey / CXTMS September 13 analysis |
| Guaranteed landed-cost promise | FedEx's Shopify app costs $99 per month; 68% of surveyed SMBs encounter customers surprised by import charges at least sometimes | Snapshot product, origin, classification, quote, checkout, entry, invoice, guarantee, and exception data for reconciliation | Supply Chain Dive / CXTMS September 13 analysis |
| Inventory-to-capacity trigger | The inventory signal stood at 52.8 while truckload tender rejections were around 13.5% | Combine inventory position, demand, inbound confidence, and transport capacity into SKU-location replenishment triggers | FreightWaves / CXTMS September 13 analysis |
| Red Sea and Arabian Peninsula optionality | Combined disruption could affect up to 37% of global seaborne trade; a prior shock cut Red Sea tanker transits 20% and Suez transits 51% YoY | Maintain end-to-end route scenarios covering pipeline, port, strait, vessel, insurance, fuel, inventory, and restoration evidence | SupplyChainBrain / FreightWaves / CXTMS September 13 analysis |
| Broker decision evidence | The federal broker bond is $75,000; one network reportedly contracted from 100,000+ carriers to about 65,000 after tighter qualification | Retain time-stamped carrier checks, shipper requirements, tender acceptance, communications, revisions, and intervention history by load | FreightWaves / CXTMS September 13 analysis |
| U.S.-Mexico usable throughput | July trade reached $94.8B, up 27.5% YoY; Laredo handled $36.95B, while active Mexican-domiciled southern-border carriers fell 6.3% | Score document readiness, capacity acceptance, border dwell, transfer success, and empty repositioning instead of relying on trade value | FreightWaves / CXTMS September 13 analysis |
| Fleet software dispatch windows | Volvo completed 18,000+ OTA updates in May and can handle up to 10,000 per day | Schedule go, defer, substitute, rollback, and return-to-service decisions around truck eligibility and the next customer commitment | FreightWaves / CXTMS September 13 analysis |
The new insight is that a signal earns operating authority only when the system can explain the commitment it creates. The strongest logistics platforms will preserve the source, effective time, eligibility test, commercial exposure, responsible owner, fallback, and observed outcome for every consequential decision—from releasing an LTL consolidation or project-cargo booking to quoting duties, dispatching a border load, or updating a truck overnight.
New Insights from September 14, 2026 Posts
September 14 made proof before action the common requirement across digital and physical logistics. AI recommendations, strategic corridors, vessel tracks, robots, rail routes, replenishment plans, and scarce-commodity allocations all create value only when the operating record shows what is known, what is uncertain, who may act, and how the outcome will be measured.
- Decision rights became evidence-dependent operating controls. September 14 coverage showed that logistics systems should not confuse a model output with realized savings, an AIS track with certainty, training attendance with shift readiness, a trade agreement with an executable corridor, or contracted supply with deliverable inventory. Each decision needs a versioned baseline, confidence or eligibility test, accountable owner, and recovery rule.
| Signal from September 14 coverage | Reported statistic | Technology use case | Source |
|---|---|---|---|
| Canada-EU strategic corridors | CETA was designed to eliminate tariffs on almost 99% of goods; the EU lists 34 critical raw materials, including 17 strategic materials | Model commodity-specific gateways, origin proof, customs requirements, capacity, alternates, and milestone risk instead of treating policy intent as usable freight capacity | Reuters / Reuters CETA summary / CXTMS September 14 analysis |
| Dark-voyage confidence | Hormuz traffic averaged about 10 inbound and outbound vessels per day in May; a later report counted five passages one Sunday versus 26 the previous day | Score ETA and compliance confidence from last confirmed position, transmission gaps, ownership, insurance, documents, draft behavior, and corroborating sources | Reuters / Reuters / CXTMS September 14 analysis |
| Franchise replenishment control | AI-driven forecasting can reduce errors 20%-50% and lost sales or unavailability by as much as 65%; U.S. retailers generate roughly 8M tons of food waste | Govern store item masters, demand signals, overrides, inventory, delivery windows, substitutions, and waste as one replenishment feedback loop | McKinsey / Supply Chain Dive / CXTMS September 14 analysis |
| Logistics technology operating contracts | Successful digital transformations can produce 5%-10% revenue uplift within two years; two-thirds of surveyed companies were progressing with advanced planning and scheduling | Bind vendor responsibilities, service levels, data rights, incident recovery, baselines, adoption measures, and value reconciliation into the operating contract | McKinsey / McKinsey / CXTMS September 14 analysis |
| Robotics workforce readiness | Robotic-solution use rose from 10% to 13%, while planned evaluation rose from 24% to 32%; one network's 5,000 robotic pickers increased items picked per hour 180% | Maintain role-, equipment-, shift-, and expiry-specific skills matrices with authorization, backup coverage, recovery drills, and escalation evidence | Logistics Management / Reuters / CXTMS September 14 analysis |
| Rail remediation visibility | The proposed Union Pacific-Norfolk Southern transaction was valued at $85B, with regulatory review expected to take roughly 12-18 months | Add remediation location, asset owner, restriction, confidence, affected cars, alternate interchange, custody, cost, and customer-notice fields to rail shipment records | Reuters / Reuters / CXTMS September 14 analysis |
| Parcel AI savings proof | USPS proposed an average 6% peak increase; cited shipment impacts ranged from $0.40 to $10.50, following an earlier 8% temporary package-price increase | Separate modeled, approved, and realized savings using shipment-level counterfactuals, contract versions, surcharge calendars, invoices, service outcomes, and rollback triggers | Supply Chain Dive / CXTMS September 14 analysis |
| Potash allocation | The U.S. imports 90% of the potash farmers use, with 80% of imports coming from Canada; prices fell below $300 per ton after approaching $1,000 in 2022 | Allocate contracted tons by crop deadline, inventory cover, customer exposure, transport milestones, receiving capacity, substitution feasibility, and incremental landed cost | Reuters / Reuters / CXTMS September 14 analysis |
The new insight is that autonomy should be earned at the decision level. A logistics platform can recommend, approve, or execute only when its record establishes the baseline, source confidence, eligibility, responsible owner, economic exposure, fallback, and observed result. That discipline turns AI and automation from fast advice into accountable operating infrastructure.
New Insights from September 15, 2026 Posts
September 15 turned decision governance into executable operating design. The day's coverage showed that resilience, air-cargo recovery, freight-cost diagnosis, port and warehouse investment, electrification, automation, supplier contracting, and cloud software all work better when teams define thresholds, decision rights, portable records, and acceptance tests before disruption or go-live.
- Preapproved moves and portable evidence became execution infrastructure. September 15 coverage linked adaptive-network playbooks, carrier-suspension recovery, lane-level cost normalization, inland capacity, electric-freight measurement, packaging and goods-to-person automation, indexed supplier contracts, and cloud-WMS portability. Across all ten topics, the common requirement is a reproducible control record that states what can change, who may approve it, which evidence is required, and how success or rollback will be measured.
| Signal from September 15 coverage | Reported statistic | Technology use case | Source |
|---|---|---|---|
| Adaptive response playbooks | Supply-chain leaders using disruption metrics were 3.4 times more likely to say their networks weathered shocks better | Store preapproved substitutions with trigger, owner, cost ceiling, expiry, fallback, and measured outcome | Deloitte / CXTMS September 15 analysis |
| Air-carrier suspension | Global air-cargo spot rates fell 6% month over month, while 2026 market growth was forecast at 4% | Maintain an affected-shipment register, freeze promises, allocate replacement lift by consequence, and preserve qualification and custody evidence | Supply Chain Dive / CXTMS September 15 analysis |
| Freight demand versus cost | Cass shipments rose 2.1% YoY, while expenditures rose 18.7% | Normalize spend by lane, mode, distance, weight, fuel, accessorials, and service level before changing budgets or routing rules | Logistics Management / CXTMS September 15 analysis |
| Delaware gateway development | The $669M, 137-acre terminal is planned for 1.2M TEUs annually; initial operations target about 40% of ultimate capacity | Gate allocations by crane, yard, chassis, drayage, rail, warehouse, appointment, and recovery readiness rather than berth capacity alone | FreightWaves / CXTMS September 15 analysis |
| Electric-freight measurement | Google's 25-truck Texas deployment expands its coalition project to 63 trucks | Compare energy, utilization, payload, dwell, charging, emissions, and completed-move economics against a dated diesel baseline | Supply Chain Dive / CXTMS September 15 analysis |
| Prepared-food packaging automation | Labor fell from as many as 12 people to two or three; the line supports roughly 36M pounds annually and reached full production in 10 days | Connect line speed, changeover, giveaway, quality, lot traceability, refrigerated capacity, and dispatch cutoffs in one acceptance model | Modern Materials Handling / CXTMS September 15 analysis |
| Rail-adjacent warehouse economics | Planned facility spans 1,002,000 square feet; intermodal averaged 17% savings above 1,200 miles versus 9% overall | Model linehaul, drayage, lifts, inventory time, labor reach, exceptions, and highway access, then reconcile assumptions after opening | Logistics Management / CXTMS September 15 analysis |
| Goods-to-person launch | Shein's new facility covers 737,000 square feet; a comparable case improved average productivity about 85% | Ramp automation through throughput, accuracy, downtime, recovery, dock completion, and end-to-end cycle-time gates | Supply Chain Dive / CXTMS September 15 analysis |
| Supplier-contract triggers | ISM prices paid rose from 59.0 in January to 78.3 in March | Automate index-based review with tolerance bands, auditable evidence, notice deadlines, caps, sharing rules, and operating fallbacks | Reuters / CXTMS September 15 analysis |
| Cloud-WMS portability | Poor data quality costs organizations at least $12.9M annually on average | Test export completeness, identifiers, history, APIs, permissions, degraded operation, and TMS event portability before go-live | Gartner / CXTMS September 15 analysis |
The new insight is that adaptability is a prepared transaction, not a dashboard feature. A logistics platform earns operating authority when it can execute an approved move, carry the relevant evidence across systems and partners, enforce its economic and time boundaries, and compare the realized outcome with the original baseline.
New Insights from September 16, 2026 Posts
September 16 made release assurance the connecting theme across digital and physical logistics. Whether the decision is releasing a high-value load, trusting a carrier credential, allocating a lane, opening a facility, or committing capital to domestic production, the same controls recur: verified identity, qualified capacity, explicit authority, time-stamped custody, economic limits, and a tested recovery path.
- Identity, custody, capacity, and capital became one release decision. The day's ten posts showed that security, automation, procurement, network design, and project logistics can no longer run as separate control systems. A trustworthy execution layer must connect evidence to the specific carrier, asset, lane, facility, shipment, and decision—and retain the outcome so the next release rule improves.
| Signal from September 16 coverage | Reported statistic | Technology use case | Source |
|---|---|---|---|
| Carrier-impersonation recovery | Six copper pallets worth $586,000 were recovered in about eight hours; deceptive pickups rose 31% YoY in Q1 | Bind authenticated carrier, driver, equipment, geofence, custody, and incident evidence to the tender | FreightWaves / CXTMS September 16 analysis |
| Automated yard custody | Drivers were detained at 39.3% of stops; direct carrier expense reached $3.6B and lost productivity $11.5B; automation benchmarks indicate up to 30% lower dwell | Convert gate images and machine-confidence scores into a shared container and chassis timeline across security, YMS, WMS, and TMS | FreightWaves / Logistics Management / CXTMS September 16 analysis |
| Food nearshoring | Cadbury's $22M Malaysia investment removed at least two months of lead time for a hub producing about 100M bars annually | Score localization on landed cost, pipeline inventory, quality release, traceability, service, and backup capacity at staged gates | SupplyChainBrain / CXTMS September 16 analysis |
| Carrier credential phishing | FMCSA's legitimate Motus platform is expected to verify about 800,000 existing registrants | Allow-list official domains, use independent callbacks and dual approval, and block tenders after unverified identity or banking changes | FreightWaves / CXTMS September 16 analysis |
| Managed chemical transportation | OXEA's network covers three modes and four countries; more than 3B tons of hazmat move on U.S. highways annually | Centralize multimodal execution while the shipper retains product eligibility, compliance, escalation, and data rights | FreightWaves / CXTMS September 16 analysis |
| Tightening freight market | Radiant revenue reached $261M, up 19% YoY; Cass truckload linehaul rose 11.3% YoY, shipments 2.1%, and expenditures 18.7% | Corroborate market indexes with lane acceptance, depth, service, fuel, and spot exposure before changing awards | FreightWaves / CXTMS September 16 analysis |
| Intermodal lane qualification | About 25% of SC Ports container volume moves by rail; Huntsville recorded 27,597 lifts, up 24% YoY | Pilot door-to-door rail with milestone completeness, cost, damage, and on-time gates before increasing allocation | FreightWaves / CXTMS September 16 analysis |
| Distribution-center commissioning | Tesla plans a 538,720-square-foot Texas facility; 74% of surveyed leaders were increasing technology investment | Translate supplier forecasts into appointments, carrier capacity, dock turns, labor certification, inventory availability, and failure drills before launch | Supply Chain Dive / MHI / CXTMS September 16 analysis |
| Carrier financial resilience | Truck financing ranged roughly 5.25% for strong private fleets to 12%+ for weaker operators, with a broader reported range of 6%-35% APR | Add trend-based credit and continuity tiers, exposure ceilings, review dates, and tested backups to routing guides | FreightWaves / CXTMS September 16 analysis |
| Strategic-mineral project logistics | The U.S. proposed a $450M tungsten investment; China produced more than 80% of global supply; DLA previously sought up to 2,040 tons of concentrate | Link equipment, feedstock, permits, routes, site readiness, stock policy, and commissioning dependencies on one critical path | SupplyChainBrain / Reuters / CXTMS September 16 analysis |
The new insight is that a release is the unit of logistics governance. A status, credential, capacity claim, financing signal, or camera read only creates value when it is tested against a specific decision, bounded by authority and time, connected to physical custody, and closed with evidence of the actual service, cost, safety, and compliance outcome.
New Insights from September 17, 2026 Posts
September 17 made context-specific qualification the common requirement across parcel, air, ocean, port, inventory, cold-chain, and inbound planning. Broad network claims—more capacity, lower rates, faster routes, smarter forecasts, or stronger authentication—only become useful when the system applies them to the exact ZIP pair, shipment, mode, lot, store, origin, and customer promise at risk.
- Network averages gave way to shipment-level decision rules. The day's ten posts showed that capacity and technology are not interchangeable across geography, commodity, service tier, or time horizon. The execution layer must qualify each option against local performance, economic exposure, custody requirements, freshness, inventory context, and a defined fallback before changing the promise.
| Signal from September 17 coverage | Reported statistic | Technology use case | Source |
|---|---|---|---|
| Short-term air-cargo procurement | Global air-cargo growth remains forecast at 4% for 2026; renewed disruption could lift long-term contract rates 5%-15% | Buy capacity in tranches using lane volatility, protected inventory, delay cost, allocation rights, and peak fallback rules | Supply Chain Dive / FreightWaves / CXTMS September 17 analysis |
| Heavyweight scheduled air freight | DHL's Heavy Weight Express accepts shipments up to 6,000 pounds | Compare the service premium with expected delay exposure, handling complexity, schedule certainty, recovery options, and shipment criticality | Supply Chain Dive / CXTMS September 17 analysis |
| Authenticated parcel delivery | U.S. package-theft estimates range from at least 58M parcels worth $12B to more than 120M parcels worth $16B | Apply QR authentication by product value and risk, then preserve recipient authority, custody, exceptions, privacy limits, and dispute evidence | SupplyChainBrain / Supply Chain Dive / CXTMS September 17 analysis |
| Refrigerated speed to shelf | Good Culture received an additional $55M investment; fresh produce commonly operates at 32-39°F, with lettuce lasting about 15 days in range | Connect lot, temperature, dwell, remaining shelf life, order, appointment, and exception ownership in one cold-chain control tower | Supply Chain Dive / Food Logistics / CXTMS September 17 analysis |
| AI inventory replenishment | Macy's transformation targets $235M in savings by 2026; earlier inventory discipline reduced inventory 7% | Keep store-level overrides, reason codes, approvals, forecast versions, transfers, service outcomes, and working-capital effects in a feedback ledger | Supply Chain Dive / CXTMS September 17 analysis |
| Manufacturing freight scenarios | Empire State conditions fell 13 points to 7.6; prices paid rose to 63.1; Brent crude climbed 22.4% to $108.38 per barrel | Convert demand, price, energy, inventory, supplier, and carrier signals into controlled-cooling, price-shock, and deterioration playbooks | Supply Chain Dive / FreightWaves / CXTMS September 17 analysis |
| Regional parcel qualification | OnTrac plans 25%-30% more capacity; advertised deferred-service costs can be up to 30% lower | Pilot ZIP pairs in waves and score invoice cost, surcharge avoidance, scan completeness, promise performance, claims, and customer outcome | Supply Chain Dive / CXTMS September 17 analysis |
| Port and rail dwell | Truck dwell averaged 2.95 days versus 6.75 days for rail cargo; Long Beach handled 944,585 TEUs in August and about 28% of containers left by train | Maintain mode-specific gateway scorecards and reroute only affected inland flows using terminal, rail, free-time, appointment, and promise thresholds | FreightWaves / CXTMS September 17 analysis |
| Suez route restoration | Four services resumed Suez transits; the route can save about one week; September U.S. imports were forecast at 2.31M TEUs, up 9.6% YoY | Rebaseline route performance from actual events and restore allocations in phases using percentile transit, variability, inventory, and fallback evidence | SupplyChainBrain / Reuters / CXTMS September 17 analysis |
| Rural-origin parcel promises | USPS changes affect 72% of contiguous-U.S. ZIP codes, 48% of the population, and 29% of outgoing package volume; affected origins receive an extra transit day | Add origin-ZIP risk, induction compliance, node stability, weekday performance, and scan reliability to routing and checkout promises | Supply Chain Dive / CXTMS September 17 analysis |
The new insight is that qualification—not availability—is the real unit of optionality. A carrier, route, forecast, service, or capacity block becomes an operating option only after the system proves where it applies, what risk it changes, which threshold activates it, who owns the exception, and whether the realized service and cost justify broader use.
New Insights from September 18, 2026 Posts
September 18's ten posts made readiness the bridge between strategic announcements and executable logistics. Tariff refunds, long-term supply agreements, cross-border expansions, alternative-fuel vehicles, capital projects, and network consolidations all looked valuable at headline level. Each became operational only after teams defined eligibility, effective dates, lane constraints, decision rights, cost exposure, launch gates, and recovery rules.
- Readiness became a financial and operational release gate. September 18 connected customs eligibility, alternative-fuel lanes, empty-equipment positioning, cross-border terminals, semiconductor allocation, interest rates, executive decision rights, capacity launches, drayage incentives, and warehouse cutovers. Across all ten posts, an announced asset, contract, refund, incentive, or investment created value only when the execution record proved eligibility, timing, ownership, total cost, and a workable fallback.
| Signal from September 18 coverage | Reported statistic | Technology use case | Source |
|---|---|---|---|
| IEEPA tariff-refund processing | More than $175B in tariff collections could be subject to refunds; CAPE expands October 6 for eligible entries | Maintain entry-level eligibility, liquidation status, importer identity, duty evidence, instruction status, and landed-cost adjustments | Supply Chain Dive / Reuters / CXTMS September 18 analysis |
| Hydrogen long-haul pilot | Daimler plans 100 NextGenH2 trucks in customer operations; an earlier GenH2 test covered 650 miles on one fill | Qualify lanes by payload, fueling access, range reserve, recovery options, duty cycle, and scale-up thresholds | FreightWaves / CXTMS September 18 analysis |
| Border empty-equipment disruption | Roughly 700 tractors accumulated as Eagle Pass commercial traffic fell from about 1,000 trucks daily to 300-400 | Treat empty moves as a shipment class with effective-dated crossing rules, equipment forecasts, alternate bridges, and recovery sequencing | FreightWaves / CXTMS September 18 analysis |
| Cross-border and offshore LTL expansion | Estes is investing $56M; its Detroit terminal expanded from about 70 to 139 doors | Validate service by origin-destination pair using terminal readiness, customs milestones, equipment balance, handoffs, claims, and total landed service cost | FreightWaves / CXTMS September 18 analysis |
| Automotive memory allocation | Quarterly memory-price increases of 20%-70% were anticipated and new-order lead times could exceed 58 weeks | Translate long-term agreements into part-level supply, production-priority rules, approved substitutions, inbound milestones, and escalation triggers | Reuters / Supply Chain Dive / CXTMS September 18 analysis |
| Interest rates and logistics working capital | The Fed raised its benchmark range to 3.75%-4%; core PCE inflation is projected at 3.4% for 2026 | Add inventory carrying cost, payment timing, supplier and carrier fragility, and expedite risk to landed-cost and network scenarios | Supply Chain Dive / CXTMS September 18 analysis |
| Supply chain decision rights | Munchkin created its first CSCO role spanning operations, compliance, sourcing, planning, analytics, and order management | Encode approval authority, exception ownership, operating baselines, weekly decision cadence, and shared transportation truth | Supply Chain Dive / CXTMS September 18 analysis |
| Domestic capacity expansion | Reckitt plans $400M over four years in its U.S. supply chain | Govern capacity through construction, equipment, qualification, and commercial-release gates tied to supplier and transition-freight readiness | SupplyChainBrain / CXTMS September 18 analysis |
| Zero-emission drayage economics | Proposed support reaches $60 per terminal visit and $36,000 annually; earlier vouchers offered up to $150,000 per truck | Compare cost per productive move using charger readiness, energy tariffs, dwell, range reserve, incentives, downtime, and emissions | Supply Chain Dive / CXTMS September 18 analysis |
| Automated warehouse consolidation | UNFI moved Racine operations to Joliet while implementing full-case automation and previously targeted a RELEX rollout across about 12 DCs in one month | Manage inventory, customer, labor, systems, and transportation migration in gated waves with explicit rollback and service tests | Supply Chain Dive / CXTMS September 18 analysis |
The new insight is that the release gate is becoming the common object across logistics technology. Whether the decision concerns a refund, part allocation, truck, lane, facility, supplier, or executive escalation, systems need to prove that the option is eligible, economically sound, operationally ready, owned by someone, and reversible before it becomes a commitment.
New Insights from September 19, 2026 Posts
September 19's nine posts showed logistics technology moving beyond visibility into governed intervention. Store delivery, weather-sensitive inventory, energy-aware distribution, controlled aerospace freight, physical-network security, supplier emissions, demand shifts, provider transitions, and technology procurement all require systems that can decide when to act, preserve the evidence behind the decision, and verify the result.
- Context, evidence, and response thresholds became the control layer for operational change. The day's coverage connected marketplace demand, energy telemetry, serial-level custody, vendor proof, SKU-location forecasts, tamper response, shipment-level carbon, inventory buffers, and 3PL transitions. Across all nine topics, the winning pattern was the same: combine a current operating signal with a pre-agreed threshold, named owner, bounded action, and auditable outcome.
| Signal from September 19 coverage | Reported statistic | Technology use case | Source |
|---|---|---|---|
| CEE 3PL selection and transition | 94% of domestic Fortune 500 companies use at least one 3PL; estimated U.S. 3PL revenue reached $424.3B in 2025 | Score providers on operational design, integration, resilience, implementation, economics, and governance; make cutover milestones contractual | Logistics Management / Supply Chain Brain / CXTMS September 19 analysis |
| Store-based ultra-fast delivery | Uber expanded Costco delivery from 17 to 47 states and nearly 600 locations; online sales represent 16.5% of retail sales and are growing about 10% annually | Unify marketplace demand, reserve inventory by channel, gate promises by store capacity, and reconcile courier wait, substitutions, service, and contribution margin | FreightWaves / CXTMS September 19 analysis |
| Distribution-center energy resilience | Burlington sourced 25% of electricity from renewables in fiscal 2025; Walmart had 125 MW of on-site solar across 303 U.S. facilities; Best Buy's Dinuba field can generate 5.87M kWh annually | Connect building energy, batteries, WMS, automation, refrigeration, labor, docks, and shipment priorities through a measurable energy SLA | Supply Chain Dive / Supply Chain Dive / CXTMS September 19 analysis |
| Aerospace chain of custody | A government review cited more than 1M F-35 parts missing over five years; a prospective 48-aircraft sale was valued at $24.3B | Bind serial identity, booking changes, export authority, custody scans, seals, route deviations, dual approval, and escalation clocks in one controlled record | FreightWaves / CXTMS September 19 analysis |
| Logistics technology procurement | 55% of leaders were increasing technology investment and 60% planned to spend more than $1M; three-quarters of logistics digital transformations miss at least one stated goal | Replace ranking-led buying with weighted evidence scorecards, real-data exception tests, reference checks, contractual acceptance gates, and exit rights | MHI / McKinsey / CXTMS September 19 analysis |
| GLP-1-driven food demand | Estimated U.S. food and beverage truckloads fell 2%, or about 2M loads annually; GLP-1 households cut grocery spending 5.3% and fast-food spending about 8% | Reforecast by SKU and location, translate mix into lane and temperature requirements, and resize capacity only after sustained forecast-and-actual thresholds | FreightWaves / CXTMS September 19 analysis |
| Physical rail-network tampering | Dutch authorities investigated more than 30 disruptions; U.S. railroads moved 494,865 carloads and intermodal units in the week ending September 12 | Classify incidents, preserve evidence, map shipment exposure, prioritize cargo, reserve alternate capacity, and manage recovery through verified milestones | Supply Chain Brain / FreightWaves / CXTMS September 19 analysis |
| Scope 3 freight decisions | Scope 3 represents 98.5% of Target's footprint and product manufacturing about 45%; only 38% of businesses were tracking Scope 3 in a cited survey | Create a shipment-level carbon evidence chain with factor versions, supplier confidence tiers, allocation rules, carrier scan data, and double-counting controls | Supply Chain Dive / CXTMS September 19 analysis |
| Weather-responsive inventory placement | TJX comparable-store sales rose 6% and gross margin reached 31.3%, up from 29.5% | Use regional weather, sell-through, inventory age, margin, capacity, and service triggers to hold selected stock at DCs or release it to stores | Supply Chain Dive / Reuters / CXTMS September 19 analysis |
The new insight is that an intervention needs its own evidence record. Forecasts, alerts, rankings, emissions estimates, marketplace orders, custody changes, energy signals, and security events become operationally useful only when the system connects them to a threshold, authority, action, fallback, and measured outcome.
New Insights from September 20, 2026 Posts
September 20's ten posts showed that logistics autonomy depends on shared operating contracts. Planning models, robots, customs milestones, delivery promises, regulatory exceptions, cyber controls, port-release decisions, resilience programs, and routing guides all fail when connected parties interpret the same signal differently. The practical control layer is a versioned agreement defining the data, threshold, owner, permitted action, fallback, and business outcome.
- Decision contracts became the foundation for trustworthy autonomy. The day's coverage connected AI planning, biofuel allocation, customer delivery choices, cross-border milestones, fuel-hauling waivers, warehouse safety, port cybersecurity, import-release curves, resilience controls, and backup carrier capacity. Across all ten topics, technology created value only when a current signal could trigger a bounded action and the system could prove what happened next.
| Signal from September 20 coverage | Reported statistic | Technology use case | Source |
|---|---|---|---|
| Autonomous planning governance | 82% of executives view AI as a growth driver, 44% report significant AI returns, and 85% planned to invest more than $100,000 in 2026 | Define data freshness, lineage, confidence, approval boundaries, fallback rules, and execution-quality measures for every automated decision | SupplyChainBrain / CXTMS September 20 analysis |
| Biofuel feedstock and port allocation | U.S. biomass-based diesel and renewable diesel requirements reached 5.4B gallons for 2026 and 5.7B for 2027; biofuel demand could absorb more than half of U.S. soybean oil production | Optimize domestic-versus-export allocation across feedstock, storage, railcars, trucks, terminals, contribution margin, and chain of custody | Reuters / CXTMS September 20 analysis |
| Adjustable delivery promises | 8% of U.S. first-attempt deliveries fail at an average $17.20 per failure; automated fulfillment reduced Chewy's average shipping distance 25% | Gate customer changes by ZIP density, order state, route economics, warehouse workload, service price, and contribution margin | Inbound Logistics / Supply Chain Dive / CXTMS September 20 analysis |
| Customs release-to-scan handoff | One UPS customs workflow processed 112,000 packages daily and cleared 90% without manual intervention | Separate customs release, warehouse availability, carrier possession, and scan events; trigger evidence checks and formal traces on 24-, 48-, and 72-business-hour clocks | Supply Chain Dive / CXTMS September 20 analysis |
| Fuel-hauling HOS exception | The temporary rule permits a 16-hour operating window, while the normal driving limit remains 11 hours after ten consecutive hours off duty | Run every extended assignment through duty-history, eligibility, terminal-route, and return-to-base gates with fatigue and crash-reporting evidence | Logistics Management / CXTMS September 20 analysis |
| Shared warehouse safety state | About 10% of companies used AGVs or AMRs, while 30% planned to evaluate them within one or two years | Share zones, congestion, people, asset availability, stop states, and recovery rules across robots, conveyors, lift trucks, WMS, and human workflows | Modern Materials Handling / CXTMS September 20 analysis |
| Port cyber resilience | The Port of Los Angeles blocked more than 120M cyberattack attempts in August, versus roughly 40M monthly attacks in 2022 | Rank cyber events by freight blast radius, enforce least privilege, preserve manual continuity, and link cyber incidents to shipment exceptions | SupplyChainBrain / CXTMS September 20 analysis |
| Peak-season import release | September imports were forecast at 2.31M TEUs, up 9.6% YoY; October was projected at 2.11M, down 200,000 TEUs sequentially | Convert vessel arrivals into a daily cargo-release curve using terminal, drayage, rail, warehouse, free-time, urgency, and demand thresholds | Supply Chain Dive / CXTMS September 20 analysis |
| Resilience performance gap | Nearly 30% of surveyed companies combined high resilience maturity with lower performance; aligned transformations increased shipments 8%-20% and cut expedited-service cost 30%-50% | Tie each resilience control to a named outcome, intervention threshold, owner, response clock, and retirement test | McKinsey / CXTMS September 20 analysis |
| Truckload routing-guide depth | Tender rejection rates exceeded 14% at points in 2026; one carrier projected a 3%-5% rise in dedicated revenue per truck per week | Continuously requalify backup carriers and trigger alternate coverage using acceptance, recovery speed, cost, safety, and lane-fit evidence | FreightWaves / CXTMS September 20 analysis |
The new insight is that autonomy is not a model feature; it is an enforceable agreement between data and action. A decision contract makes the meaning of each event explicit, limits what the system may do, preserves human authority where risk is high, and measures the commercial or safety outcome after execution.
Looking Ahead
September 20 adds a decision-contract requirement for 2027: autonomous systems will need versioned definitions for data freshness, event meaning, confidence, authority, action limits, fallback, and outcome measurement before they change a plan or physical flow. The strongest platforms will apply that contract consistently across AI planning, robots, carrier tenders, customs handoffs, delivery promises, cyber incidents, regulatory exceptions, and resilience interventions.
September 19 adds a governed-intervention requirement for 2027: autonomous systems will need to know not only what changed, but whether the evidence is strong enough to hold inventory, resize capacity, change a route, reject a custody handoff, alter an energy schedule, switch a provider, or revise a service promise. The strongest platforms will preserve the trigger, confidence, owner, approval, fallback, and realized result as one portable record.
September 18 adds a readiness-release requirement for 2027: autonomous systems will need to distinguish announced capacity and financial opportunity from options that are legally eligible, physically usable, economically viable, and operationally owned. The strongest platforms will bind each release to effective-dated evidence, milestone gates, decision authority, total-cost exposure, rollback logic, and measured outcomes.
September 17 adds a qualification requirement for 2027: autonomous systems will need to test network claims against shipment-level geography, product, custody, freshness, cost, timing, and customer-promise context before reallocating volume or changing a route. The strongest platforms will learn from controlled pilots and realized outcomes instead of promoting averages into universal rules.
September 16 adds a release-assurance requirement for 2027: autonomous systems will need to verify identity, custody, capacity, financial exposure, and decision authority before they tender a load, open a gate, allocate a lane, release inventory, or commit project freight. The strongest platforms will preserve the evidence, expiry, fallback, and realized outcome as one portable execution record.
September 15 adds a preapproved-move and portability requirement for 2027: autonomous systems will need tested response libraries, bounded decision rights, exportable execution records, and acceptance gates before they reroute freight, replace capacity, renegotiate a contract, ramp automation, or migrate a warehouse workflow. The strongest platforms will connect every trigger to an owner, cost ceiling, expiry, fallback, and observed result.
September 14 adds an evidence-dependent autonomy requirement for 2027: systems will need to prove readiness and decision rights before they change a carrier, release scarce inventory, trust an inferred voyage, reroute rail freight, or authorize automated equipment. The strongest platforms will pair every recommendation with a versioned baseline, confidence score, qualified owner, recovery path, and shipment-level outcome reconciliation.
September 13 adds a commitment-governance requirement for 2027: autonomous workflows will need to distinguish observations from approvals. Before changing a route, releasing inventory, booking scarce equipment, promising landed cost, assigning a carrier, or taking an asset offline, systems should retain the eligibility test, effective time, owner, financial exposure, fallback, and outcome as one auditable record.
September 12 adds a full-path capacity requirement for 2027: autonomous systems will need to combine linehaul with drayage, inventory, energy, handling, security, contractual, and recovery constraints before they treat an option as executable. Winning platforms will qualify every dependency, preserve the decision and its evidence, and reconcile modeled economics with actual service, cost, condition, and recovery outcomes.
September 11 adds a decision-grade eligibility requirement for 2027: autonomous systems will consume more national forecasts, provider claims, credentials, rate indexes, capacity announcements, and infrastructure records than operators can inspect manually. Winning platforms will translate those inputs into local, time-bound eligibility; preserve source and issuer evidence; simulate the full path to delivery; and reconcile the resulting service, cost, safety, and compliance outcome before reusing the rule.
September 10 adds a transition-readiness requirement for 2027: autonomous and integrated logistics platforms will need to qualify identities, permissions, service ownership, physical constraints, commercial thresholds, and rollback paths before transferring freight or authority across a new organizational boundary. The strongest systems will treat acquisitions, carrier changes, automation deployments, and capacity commitments as versioned operating changes with acceptance tests and measurable stabilization periods.
September 9 adds a promise-governance requirement for 2027: operators will need canonical events across carriers, sensors, stores, yards, factories, suppliers, and ports, plus thresholds that turn those events into accountable action. The strongest platforms will reconcile whether each intervention actually improved acceptance, traceability, condition, utilization, inventory, cost, and customer service.
September 8 adds a decision-clock requirement for 2027: tariffs, integrations, capacity purchases, personnel transitions, border equipment, airport disruptions, cargo-security exposure, inventory buffers, and carrier bids will all need effective-dated rules and explicit intervention thresholds. Winning operators will connect those thresholds to accountable owners, tested fallbacks, and outcome reconciliation instead of leaving the decision inside an inbox or spreadsheet.
September 6 adds a clear 2027 priority: continuity controls will become first-class TMS data. Equipment retirement dates, inspection exposure, maintenance confidence, quality-release status, gateway diversion options, acquisition cutover gates, leadership baselines, and carrier-allocation thresholds should sit beside rates and milestones. The strongest systems will simulate the cost of waiting versus intervening, keep human approval where consequence is high, and retain enough evidence to learn whether the intervention actually protected service and margin.
September 5 added a confidence-adjustment requirement for 2027: autonomous workflows will ingest more nominal capacity, published ETAs, market indexes, sensor readings, inspection results, compliance documents, automation benchmarks, and provider commitments than people can validate manually. Winning operators will score the reliability and completeness of each input, bind it to explicit release thresholds and named recovery actions, and reconcile predicted confidence with actual service, cost, quality, and compliance outcomes.
September 4 added a timing-and-qualification requirement for 2027: fee windows, customs rules, credentials, facility cutoffs, packaging thresholds, and vendor ownership can all change the economics or legality of a shipment before a conventional planning cycle catches up. Winning operators will manage those facts as versioned execution data, with automated effective dates, validation holds, scenario tests, and fallback paths.
September 3 added a provenance requirement for 2027: AI recommendations, marketplace promises, climate-triggered reroutes, compliance holds, vendor transitions, and infrastructure fallbacks will cross more organizational boundaries and happen faster. Winning operators will require every material action to carry its source evidence, decision owner, threshold, timestamp, fallback, and measured outcome—making explainability an operational capability rather than a reporting exercise.
September 2 added a portability warning for 2027: autonomous workflows will span more vendors, modes, facilities, regulatory regimes, and external data sources than any one platform can permanently control. Winning operators will require exportable records, effective-dated rules, explicit permissions, tested manual fallbacks, mode-aware controls, and outcome reconciliation before allowing software to make or carry a commitment across an execution boundary.
September 1 added a governed-commitment warning for 2027: autonomous vehicles, AI execution, scarce infrastructure, multimodal networks, outsourced operations, and dynamic sourcing will create more commitments than centralized teams can validate manually. Winning platforms will distribute bounded authority to the point of work, require comparable readiness evidence and explicit thresholds, preserve overrides and custody, and feed realized cost, safety, service, and financial outcomes back into the next release rule.
August 29 added a continuity-orchestration warning for 2027: autonomous systems will fail safely only when human escalation, cyber recovery, data-provider outages, carrier distress, workforce gaps, policy changes, peak-price calendars, and trade shocks already have structured fallback rules. Winning platforms will preserve a trusted record through the disruption, limit authority by risk tier, measure customer and financial exposure, and reconcile every temporary decision when normal interfaces return.
August 28 added an operational-qualification warning for 2027: autonomous systems will ingest more forecasts, indexes, tariffs, capacity offers, facility claims, security statistics, and infrastructure announcements than people can validate manually. Winning platforms will convert those signals into effective-dated eligibility, tested throughput, lane-specific thresholds, named decision rights, reversible commitments, and closed-loop outcome evidence before agents award freight, release capacity, approve duties, or promise service.
August 27 added a promise-to-proof warning for 2027: autonomous systems will see more new services, facilities, technologies, investment claims, and rapid-delivery offers than teams can validate manually. Winning platforms will qualify physical readiness, effective dates, door-to-door economics, service evidence, decision authority, and fallback capacity—and then measure the realized outcome—before software commits freight, inventory, money, or customer promises.
August 24 added a release-assurance warning for 2027: AI agents will encounter convincing synthetic identities, volatile infrastructure, specialized-capacity shortages, uneven channel demand, and rapid network integration. Winning platforms will make continuous identity, plausibility scoring, end-to-end capacity qualification, cost-to-serve evidence, named fallback ownership, and rollback rules prerequisites for autonomous commitment.
August 23 added an executable-capacity warning for 2027: AI planners will increasingly see warehouse space, quota availability, route suggestions, licensed drivers, funded equipment, and lower-carbon packaging as optimization inputs. Winning platforms will distinguish potential from usable capacity, validate every constraint at shipment level, preserve the evidence behind each release, and learn from downstream failures before authorizing more volume.
August 22 added a corroboration warning for 2027: autonomous systems will increasingly act on sensor reads, capacity forecasts, supplier claims, insurance files, climate alerts, and sustainability records. Winning platforms will require independent physical or documentary confirmation for high-consequence decisions, preserve confidence and exception ownership, test alternate modes and sources against full landed economics, and feed the verified outcome back into the next release rule.
August 21 added an authority-and-evidence warning for 2027: AI agents, real-time market feeds, autonomous delivery modes, and cross-company workflows will generate more recommended actions than people can inspect manually. Winning platforms will encode who may decide, which evidence is mandatory, how long a signal remains valid, what economic threshold applies, when a fallback activates, and whether the realized result supports granting the system the same authority again.
August 20 added a recovery-proof warning for 2027: autonomous planning, connected warehouses, expanded gateways, consolidated providers, and multimodal cold chains will create larger shared failure domains. Winning platforms will qualify capacity with service evidence, preserve custody across handoffs, encode degraded operating modes and decision rights, reconcile every transaction after disruption, and feed recovery outcomes back into carrier, technology, and network choices.
August 19 added a signal-expiry warning for 2027: autonomous systems will consume more schedules, market indexes, infrastructure notices, security advisories, and capacity claims than teams can review manually. Winning platforms will time-stamp those signals, map them to shipment-level exposure, distinguish theoretical from usable capacity, enforce decision deadlines and authority, and learn from the service and cost outcome before reusing the same rule.
August 17 added a closed-loop warning for 2027: autonomous logistics systems will increasingly set customer promises, allocate constrained components, select gateways and carriers, release inventory, and claim incentives. Winning platforms will preserve the original decision, confidence, authority, physical outcome, economic result, exception, and corrective action—then use that evidence to govern the next decision.
August 16 added an eligibility-and-sustainability warning for 2027: autonomous systems will increasingly book capacity, release imports, change warehouse logic, assign equipment, shift parcel volume, and recommend workforce plans. Winning platforms will preserve product and component origin, effective authority, software versions, safety context, shipment-level cost, duty-window feasibility, capacity commitments, and reversal rules before automated decisions become operational commitments.
August 15 added an evidence-action warning for 2027: more automation will make decisions from provider scores, credentials, maintenance signals, sustainability claims, port events, supplier files, and financial transactions. Winning platforms will preserve source and effective-date lineage, segment averages into actionable detail, enforce approval boundaries, calculate operational consequences, and require closure proof before systems release freight, approve money, or restore normal operations.
August 14 added a commitment-control warning for 2027: AI and optimization will recommend more capacity, rate, routing, and automation decisions than operators can validate manually. Winning platforms will encode energy limits, acceptance thresholds, capacity-release rules, draft and weight constraints, handoff clocks, lane economics, service baselines, and qualified fallbacks before autonomous workflows commit freight, contracts, or customer promises.
August 13 added a decision-context warning for 2027: AI and analytics will ingest more market, infrastructure, regulatory, supplier, and asset signals than operators can review manually. The winning systems will not simply summarize those signals. They will preserve source and assumption lineage, translate each signal into eligible shipments and assets, apply margin and compliance gates, and measure whether the resulting action improved service, throughput, resilience, or cost.
August 12 added a coordination-readiness warning for 2027: multimodal networks, consolidated carriers, AI agents, automated facilities, third-party integrations, and human-machine warehouse teams will create more nominal capacity than truly executable capacity. Operators should make connection milestones, permission tiers, concentration thresholds, exit gates, dependency checks, recovery objectives, and exception ownership standard platform controls before systems commit freight, inventory, money, or customer promises.
August 11 added an evidence-lifecycle warning for 2027: autonomous logistics will increasingly initiate work, release freight, close orders, approve invoices, and reverse commitments. Operators should make identity, eligibility, effective dates, custody transitions, measurement provenance, decision authority, deadlines, and closure evidence standard platform objects so automation cannot confuse a visible status with a defensible outcome.
August 10 added a capacity-qualification warning for 2027: increasingly dynamic contracts, electrified facilities, concentrated trade corridors, stricter customs enforcement, connected equipment, and volatile import cycles will make nominal availability misleading. Operators should make time windows, independent approvals, resource registries, energy budgets, corridor constraints, velocity measures, condition-based derating, and order-book reconciliation standard inputs before software commits capacity or customer promises.
August 9 added an eligibility-and-valuation warning for 2027: autonomous execution will increasingly touch expiring authority, driver credentials, importer identity, refund ownership, food-grade assets, constrained inventory, and terminal capacity. Operators should make effective dates, identity crosswalks, qualification evidence, dependency maps, ownership rights, and cost-to-service tests standard inputs before systems release freight or assign financial value.
August 8 added a continuity-control warning for 2027: more connected logistics networks will also create larger shared failure domains. Operators should make offline data packs, constraint-aware priority scores, staged restart gates, identity keys, contractual recovery objectives, and chain-of-custody closure standard platform capabilities before cyber events, labor shocks, capacity shortages, or compliance holds force teams into improvised manual work.
August 7 added a qualification-and-recovery warning for 2027: faster automation will not compensate for incomplete cost models, weak release gates, blended capacity signals, or undefined recovery clocks. Operators should make total-cost normalization, lot and lab evidence, supplier qualification milestones, equipment-specific triggers, gateway fallbacks, settlement rights, and response deadlines standard inputs before software commits freight, inventory, cash, or customer promises.
August 6 added a context-and-causality warning for 2027: higher-value cargo, leaner inventory, provider restructuring, network rebalancing, new gateways, reusable assets, and broader logistics roles will make isolated shipment events increasingly misleading. Operators should connect each action to capacity eligibility, decision authority, asset custody, service evidence, and a normalized cost bridge so automation can distinguish a viable option from a merely visible one.
August 5 added an eligibility-and-reversibility warning for 2027: autonomous workflows will increasingly encounter expiring credentials, disputed tariffs, restricted equipment origins, uncertain disruption milestones, allocation conflicts, and auditable sustainability claims. Operators should make expiry horizons, country-of-origin files, acceptance scorecards, immutable baselines, timed contingency records, and entry- or shipment-level evidence standard inputs before systems commit capacity, money, inventory, or customer promises.
August 2 added a decision-readiness warning for 2027: AI agents, recovery plans, robotics fleets, capacity indexes, parcel tools, and network models will produce faster recommendations than many organizations can safely execute. Operators should make authority matrices, data-quality cost ledgers, interface budgets, commissioning gates, capacity reconciliations, and recovery tests standard parts of the execution record before granting systems more autonomy or removing physical redundancy.
July 31 added a continuity warning for 2027: AI recommendations, automation assets, workforce credentials, yard decisions, campaign plans, rail milestones, and carrier-risk signals will outlive individual pilots, names, owners, and market conditions. Operators should make identity crosswalks, evidence bundles, value ledgers, support obligations, approval boundaries, and outcome measures portable parts of the execution record before the next organizational change tests them.
July 30 added a comparability warning for 2027: growth forecasts, rate cards, equipment catalogs, carrier earnings, and service claims are inputs, not decisions. Operators will need portable operating data, shipment-level cost normalization, contractual acceptance gates, and finance reconciliation to distinguish apparent savings from durable throughput, service, and margin improvement.
July 28 added a capability-proof warning for 2027: service menus, network maps, investment headlines, fuel tables, and AI alerts will not compensate for weak facility evidence, vague decision rights, disconnected operating data, or untested recovery rules. The next generation of logistics automation will be judged by whether it can prove what a provider or asset can actually do, recognize when a threshold has been crossed, route the decision to the right owner, and verify the service and cost outcome after action.
The direction for 2027 is already visible. Expect more agentic workflows, more warehouse orchestration, more pressure for API standardization, and more investment in resilience technologies that can absorb trade, capacity, and regulatory shocks in real time. Also expect more spend flowing into the unglamorous control points — packaging, accessorial audit, workforce-retention design, and cyber-governed plant operations — because that is where too much margin still dies. Healthcare cold-chain networks will attract further 3PL investment as GLP-1 volumes, mRNA supply chains, and biopharma complexity make temperature-sensitive freight a distinct strategic category rather than a warehouse niche. The gap should widen further between operators using technology as core infrastructure and those still treating it like an IT project.
June 9 added a practical 2027 warning: data quality will increasingly matter before the shipment exists. Supplier diversification rules, tariff scenarios, package dimensions, containerboard supply, LNG bunkering windows, and breakbulk equipment limits all have to be modeled upstream. June 10-12 extended that warning across parcel portfolios, cloud TMS, brokerage APIs, smart containers, regional freight corridors, customs brokerage, frontline AI adoption, and event logistics. June 14 made the warning even more concrete: identity proof, ETA triggers, freight-order tags, load-board API confidence, origin qualification, port-call optionality, and mode-downshift economics all need to be represented before automation chooses the next move. June 15 added the planning-slack warning: carrier costing, recall scope, cold-chain node design, LMI triggers, pallet continuity, frontloaded imports, rail conversion, software vendor risk, and warehouse process debt must be tested before stale assumptions become expensive exceptions. June 16 added the readiness warning: role-based data permissions, freight-engineering recommendations, defense allocation clocks, packaging control points, franchise item masters, rail asset events, upstream fuel-policy triggers, maritime crew risk, guided warehouse work, and EV route economics all need to be represented before AI or automation can safely change the plan. June 17 added the execution-edge warning: terminal operating events, importer identity, farm-cost evidence, grocery assortment volatility, rural last-mile judgment, highway-work closures, robot-cell supply, network simplification, and SCaaS continuity all have to be visible before platforms can make reliable decisions. June 18 added the adaptability warning: legacy-system constraints, medical-device traceability, forced-labor proof, Gulf Coast port optionality, import/export imbalance, logistics-cost volatility, and port-labor trust all have to be interpreted before a static transportation plan becomes an expensive exception. June 19 added the accountability warning: supplier conduct, procurement-cycle speed, food-network capacity, committed-lane economics, inventory constraints, circular disposition, surcharge exposure, fertilizer timing, manager capability, and sanctions ambiguity all need owners and evidence before risk turns into cost. June 20 added the execution-adaptability warning: parcel exceptions, AI workforce design, drone inventory counts, electric drayage corridors, rail-served packaging, Southeast Asia air gateways, brownfield automation, retail demand shifts, committed-freight performance, and humanoid robot readiness all need to be modeled before volatility reaches the dock, route guide, or customer promise. June 21 added the measurement-trigger warning: scan quality, air-rate thresholds, inland rail handoffs, sortation throughput, track-inspection signals, hazmat language controls, LTL damage-density-delay metrics, cost-per-shipment ownership, and WMS workaround maps all need to be represented before reports can become useful action. June 22 added the operating-trust warning: accepted-demand signals, AI source verification, autonomous-lane fallbacks, driver-pipeline geography, sensor-backed safety files, vendor financial pressure, regional 3PL nodes, maritime fee triggers, consolidated-data confidence, and subcontracting controls all need to be represented before teams hand more decisions to software. June 23 added the production-and-origin warning: reshored plant geography, domestic supplier ramp-up, packaging loops, dealer replenishment, high-risk commodity evidence, lot-level origin proof, warehouse conversion records, and customs-procurement handoffs all need to be represented before a shipment plan can prove it is executable. June 24 added the governed-optionality warning: segmented 3PL roles, scarce-provider ownership, supplier labor economics, pharma trade exposure, rail telecom dependencies, ISM sector signals, inflation-sensitive inventory placement, and Mexico corridor handoffs all need to be represented before a backup plan can prove it is more than a spreadsheet. June 25 added the execution-accountability warning: aircraft maintenance exposure, cold-chain custody, WMS launch risk, Roadcheck readiness, PFAS chain of custody, vendor evidence, pallet identity, delivery-promise economics, procurement-supply chain integration, and Hormuz recovery timing all need accountable records before handoffs, assets, vendors, or customer promises fail under pressure. June 26 added the cost-and-control warning: first-mile supplier readiness, LTL mode-mix rules, detention evidence, carrier-vetting history, dock-door automation, interest-rate scenarios, IOR identity, warehouse rent signals, nuclear component milestones, and contracted freight optionality all need to be represented before finance, compliance, or physical-flow constraints turn into emergency logistics. June 27 added the data-readiness warning: broker-ready import files, duty-refund ownership, parcel dimensions, apparel product attributes, vertical LTL service rules, vendor-health signals, terminal-level gateway options, inventory receipt calendars, trade-deficit lane signals, and quantum constraints all have to be structured before automation or optimization can act responsibly. June 28 added the data-liability warning: ELD provider status, reefer fuel-tax evidence, export-control screening, biometric consent, carrier compliance records, supplier flow controls, commodity-cost timing, ocean data contracts, power-project milestones, and marketplace sanctions checks all need to be represented before data can safely travel across insurers, regulators, brokers, carriers, suppliers, and platforms. July 1-12 added the execution-evidence warning: routing-guide health, carbon claims, parcel allocation, EV charging windows, rail-ramp choices, brokerage files, warehouse exceptions, frontline confirmations, tariff effective dates, battery chemistry, life-sciences quality events, industrial import milestones, and AI infrastructure chokepoints all have to be structured before automation can be trusted. July 13 added the feedback-loop warning: carrier onboarding, plant launches, fuel tables, customs-first promises, energy-margin exposure, SKU-level cost-to-serve, item verification, service-parts demand, AI forecast follow-through, and warehouse exits all need closed-loop records that prove what happened after the plan. July 14 added the granular-capacity warning: premium-air allocation, packaging version control, border-crossing choice, high-altitude securement, LMI restocking pressure, Mexico driver depth, Rhine gauge thresholds, truckload repricing triggers, and robotics-aware dock capacity all have to be represented before physical constraints overwhelm digital plans. July 15 added the decision-governance warning: tariff-date calendars, intermodal triggers, safe-harbor deadlines, component-origin proof, drayage roadway design, 3PL event files, last-mile promise math, import demand sensing, EDI trust, and orchestration proof all need auditable evidence before software changes the plan. July 16 added the peak-pressure warning: rate highs, Amazon fee windows, cross-border item data, provenance records, sanctions scenarios, conveyor downtime, controlled air capacity, auto port choice, and trend filtering all need owners and triggers before peak season turns weak records into margin and service failures. July 17 added the handoff-governance warning: 4PL scope, rail merger evidence, emissions qualification, border-aware node rules, technology-pilot interfaces, cyber fallback paths, order-cycle timestamps, manufacturing freight readiness, material risk registers, and always-on exception ownership all need accountable records before connected systems can act with confidence. July 18 added the control-file warning: semiconductor input approval, packaging commodities, ERP migration, food acquisition transitions, replenishment timing, tariff refunds, Scope 3 reporting, supplier compliance, Singapore hub optionality, and postal air dependency all need live operating files before volatility becomes a customer-facing failure. July 19 added the live-trigger warning: AI rack dependencies, project-priority freight, cold-storage energy exposure, freight-rate calendars, automation support capacity, technology handoffs, ocean bid windows, LMI thresholds, origin evidence, and voice procurement signals all need action rules before faster markets create faster failures. July 20 added the outcome-proof warning: AI renewal baselines, fuel-pathway claims, camera evidence rules, DDMRP release thresholds, diesel allocation, finished-vehicle staging, supplier-change scenarios, defense port readiness, Saudi milestone files, and governed GenAI answers all need proof records before systems, partners, or autonomous tools can speak for the operation. The best systems will not just optimize a booked load; they will validate whether the supplier, package, customs record, carrier portfolio, corridor, workforce process, pallet supply, cyber posture, fuel window, identity record, route economics, asset status, platform dependency, labor exposure, port optionality, maintenance exposure, custody record, capital-cost exposure, facility economics, dock-flow constraint, product attribute, refund record, consent status, data standard, insurance requirement, export-control check, dimensional measurement, bridge route, water-depth threshold, dock-slot capacity, tariff date, project milestone, fee window, provenance record, handoff rule, continuity plan, supplier evidence, emissions file, hub scenario, postal dependency, procurement signal, software outcome baseline, camera evidence rule, fuel allocation, vehicle staging status, AI answer source, and decision log make the load executable in the first place.
The multimodal divergence that defined Q2 2026 is not a temporary anomaly. It is a structural feature of a freight market that has permanently fragmented. Ocean, trucking, and air cargo operate on different supply-demand dynamics, different carrier concentration levels, and different vulnerability profiles to geopolitical disruption. The operators who build procurement systems that can see across modes and act on divergence in real time will have a compounding advantage.
The trucking capacity story will likely dominate the second half of 2026 and extend into 2027. The EPA 2027 pre-buy cycle, the regulatory driver removal cascade, and the demographic shortage are not self-correcting. Shippers who build carrier relationships, tender early, and invest in modal optionality now will maintain service levels. Those who don't will pay a premium — in rate, in missed deliveries, and in network disruption — that compounds quarterly.
On the AI front, the 2026 lesson is that the implementation gap is widening. Organizations that invested in planning maturity, data governance, and workforce enablement alongside their technology purchases are pulling away. The ones treating AI as a software purchase are filling the 60% failure bucket. That divergence will show up in competitive operational performance long before it shows up in a vendor's marketing materials.
Quantum computing's commercial tipping point adds a forward planning horizon worth monitoring. DHL, IBM, and Volkswagen have moved from theory to field trials with measurable outcomes. The 3-7 year path to commercial scale at operational logistics scale is real — but the strategic move now is building the data and integration foundations that make quantum adoption practical when it arrives. Operators who start quantum readiness programs today — experimenting with cloud quantum systems and auditing data quality — will be the ones ready to plug in solvers the moment they become viable at scale.
That is the real story of 2026. Logistics technology did not become more interesting. It became more consequential.
The May data points — Walmart reaching 30-minute delivery for 36% of U.S. households, Target lifting inventory turns 10%, tariff-refund workflows spanning $35.46B in payments and $85B in accepted refunds, U.S. warehouse robotics growing from $29.98B in 2025 to $65.74B by 2031, ocean spot rates sitting 28.9% below the 10-year average, OETA/ISP rail reporting exposing facility-level service data, UPS investing $50M in Mexico air capacity, Amazon Connect Decisions packaging 25+ supply chain tools into agentic planning teammates, logistics IT providers reporting 65% sales growth of 10%+, robotics adoption reaching 52% with a 47% first-buyer education gap, long-term contract rates resetting roughly 8%, vehicle out-of-service rates at 21.6%, and sustainability services shifting toward operationalization — plus RELEX confirming AI crossed into live production deployment with 67% increased confidence and 54% human-in-the-loop preference, the connected worker market reaching $20B with hard productivity numbers, the three-layer freight audit stack framework clarifying where 60-70% of recoverable freight dollars are being left unexamined, accessorial fee analysis showing 15% of parcel invoices carry errors and 1-5% of freight spend is recoverable, Cass confirming shipments down 4.5% YoY while expenditures rose 4.2%, LTL pricing entering a structural discipline phase at 7.2% YoY PPI, the multimodal visibility market at $1.2B confirming fragmentation is now a competitive risk, electric trucks crossing the $100B market threshold with Tesla Semi hitting high-volume production at 50,000 units/year, BCG's autonomous supply chain maturity framework establishing a five-stage model that puts most mid-market operators between levels 2 and 3, digital logistics reaching $55.57B, SCM software reaching $36.39B, dock/yard manual-process bottlenecks hitting 40.3%, and Section 232 derivative tariff exposure turning classification into a cost-control workflow — are the closing confirmation of a year that moved from pilots to infrastructure at scale. The multimodal divergence is not a Q2 story. It is the new operating environment. May 22 made the next layer clear: the winners will be the operators that model fuel exposure, customs deadlines, enforcement windows, in-stock reliability, manipulation robotics, supplier optionality, policy-driven demand signals, renewable-energy commitments, inland-port rail options, safe-parking access, and operator-adoption friction as executable workflow data rather than separate specialist spreadsheets. May 23 sharpened the same argument around simplification and evidence: AI produce inspection, port productivity, big-and-bulky service tiers, plant consolidation, SKU rationalization, packaging recovery proof, fuel-sensitive home delivery, and safety-rated trucking capacity all have to become executable data before they become durable savings. May 27 added the recovery-and-readiness layer: tariff refunds, warehouse-footprint constraints, supplier inbound data, robot supplier concentration, pedestrian safety, and unitizing quality all have to be modeled as live workflows rather than specialist side files. May 28 added the proof-and-corridor layer: de minimis refunds, detention-charge settlements, maritime modernization funding, LNG diversification, cold-chain labor triggers, industrial plant recovery, and e-commerce service-tier cost signals all have to become executable records rather than scattered emails after the fact. May 29 added the execution-control layer: active caching, postal handoff design, freight-spend governance, marketplace product-safety proof, supplier quality, workforce orchestration, autonomous-truck readiness, critical-goods stockpiles, export-productivity risk, and rail-merger planning all have to be modeled as connected operating signals rather than specialist side files. May 30 added the scorecard-and-optionality layer: store-fulfilled speed, WMS leakage, rail service metrics, ocean spot triggers, tariff-refund documentation, dual-sourced SKUs, procurement AI pilots, and Mexico air freight all need evidence-rich workflows that make the economic tradeoffs visible before teams commit. May 31 extended that into proof-before-movement: fuel volatility, origin qualification, Taiwan refunds, Vietnam IP enforcement, food-waste reduction, and social impact traceability all require connected records before shipments, sourcing decisions, or customer promises become expensive exceptions. June 1 closed the loop with execution records: Amazon-scale external networks, secure data platforms, clinical trial cold-chain controls, Samsung labor continuity, Airbus supplier recovery, cobalt chain-of-custody, and AI ROI governance all point to the same 2027 advantage — operators that keep a trusted, portable, auditable record of logistics truth will move faster and negotiate from strength. June 2 extended that advantage upstream: port rail redundancy, supplier footprint changes, postal labor and cash stability, production PMI, green-yard evidence, trucking credit health, and selective premium air capacity all have to be interpreted before the freight market prints the obvious signal. June 4 sharpened the operating rule: the next winners will treat 3PL partner data, brownfield automation sequencing, cold-chain map changes, tariff proof, freight intelligence, robotics readiness, brokerage rate signals, supplier documentation, load-density options, and integration exceptions as one live execution layer. June 5 added the interface warning: if AI makes screens cheap and consolidation hides more carrier decisions behind bigger portals, shippers need independent execution records more than ever. June 6 added the operating warning: those records also need to carry capacity triggers, maintenance risk, parcel allocation, ocean surcharge logic, perishable inventory status, rare earth documentation, and healthcare cold-chain proof before exceptions become expensive. June 7 added the planning-speed warning: optimization engines, budget reforecasts, same-day regional capacity, grant applications, truck-air handoffs, WMS labor programs, and inventory-timing decisions all need the same trusted record before faster planning simply creates faster chaos. June 9 added the upstream-execution warning: supplier count rules, tariff-change scenarios, containerboard constraints, product dimensions, breakbulk lift capacity, India linehaul scale, Vietnam export imbalance, Russia sanctions, procurement AI handoffs, and LNG bunker scheduling all need to be represented as logistics data before planning systems can make reliable promises. June 10-12 extended that into portfolio and corridor governance: parcel accessorial leakage, cloud TMS adoption, freight-forwarder consolidation, ocean and Hormuz surcharges, API-native brokerage, cross-docking, customs brokerage, green freight proof, smart containers, regional market growth, AI upskilling, and event-logistics scheduling all need to live in the same execution record before operators can make reliable cost and service commitments. June 14 added the identity-and-control layer: deceptive pickup workflows, ETA compliance triggers, blockchain exception records, driver-first apps, freight-order tags, load-board APIs, local-content origin data, Japan-U.S. port-call optionality, and truckload-to-LTL downshift logic all have to be governed before automation can safely choose who gets the freight, which mode moves it, and what proof travels with the order. June 15 added the planning-slack layer: carrier costing, grocery traceability, India cold chain node design, LMI market triggers, pallet continuity, frontloaded import finance, intermodal conversion, vendor cyber risk, and warehouse process debt all have to be represented before the next disruption tests whether the network is still real. June 16 added the readiness-and-permission layer: freight engineering, defense alignment, packaging safety, franchise playbooks, rail asset visibility, fuel-policy triggers, maritime labor risk, guided warehouse workflows, EV route economics, and role-based freight data all have to be governed before faster systems can decide who sees what and which action should happen next. June 17 added the execution-edge layer: port software, AI-server components, importer identity, farm-cost proof, AI grocery ordering, highway closures, industrial robot supply, supply-chain simplification, SCaaS dependency, and rural route judgment all have to be modeled as operating facts before automation touches the plan. June 18 added the adaptability layer: AI-over-legacy integration, regulated DC proximity, forced-labor evidence, Gulf Coast port optionality, Los Angeles imbalance, CSCMP logistics-cost pressure, and West Coast labor trust all have to be represented before teams can shift execution with confidence. June 19 added the accountable-risk layer: animal-welfare governance, AI procurement timing, food-cost logistics, committed freight marketplaces, constraint planning, circular inventory, fuel surcharge modeling, fertilizer deadlines, logistics leadership scope, and sanctions sense-making all have to become operating records instead of specialist side files. June 20 added the execution-adaptability layer: parcel exception context, AI role design, continuous inventory images, electric-drayage route constraints, rail-served packaging flows, air-cargo gateway options, brownfield automation phases, retail demand signals, committed-freight reliability, and humanoid robotics readiness all have to be represented before teams can act fast without creating faster chaos.
If your team is trying to turn these trends into practical workflow improvements, CXTMS can help you connect transportation execution, visibility, and operational control in one system instead of another pile of dashboards.