San Pedro Ports' Zero-Emission Incentives: Compare Cost per Productive Move

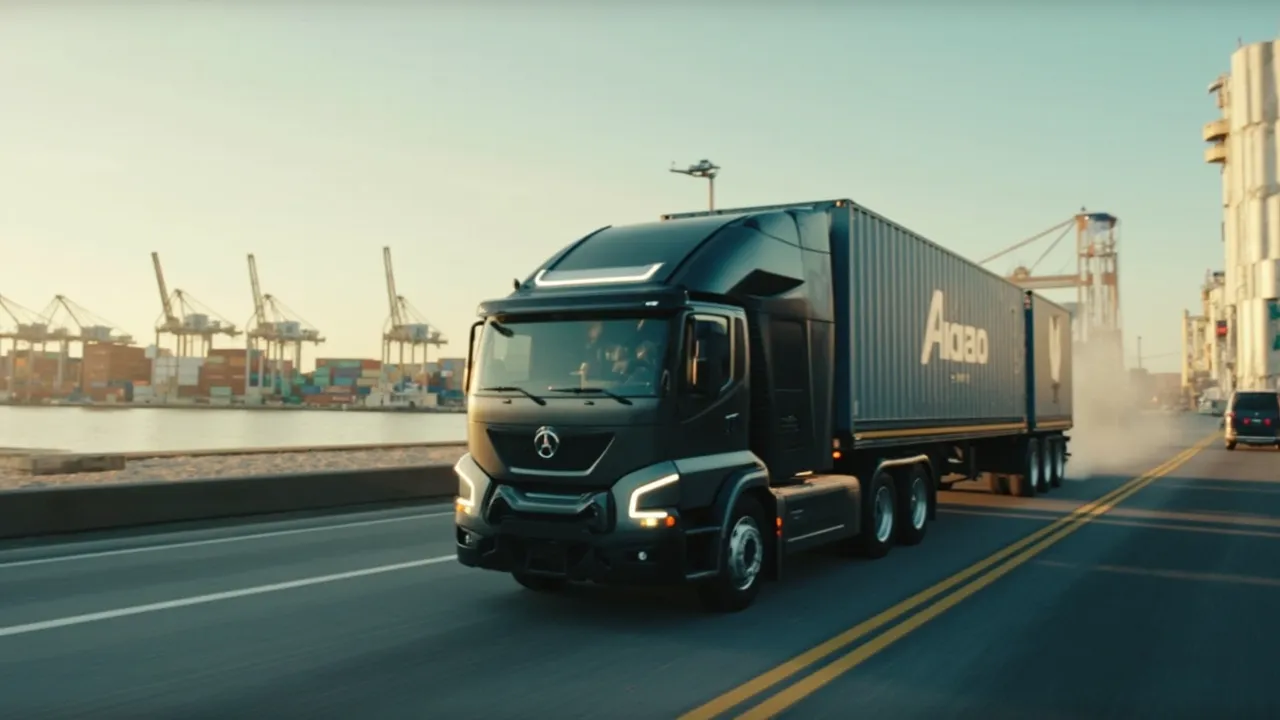
The Ports of Los Angeles and Long Beach are shifting zero-emission support from simply helping fleets buy trucks toward rewarding trucks that actually work at the port. That is the right direction. A clean truck parked beside an unfinished charger produces neither freight capacity nor emissions benefits.
The proposed incentive would pay qualifying zero-emission trucks up to $36,000 per year based on activity at the San Pedro Bay complex, according to Supply Chain Dive. For fleet operators, however, the headline payment is not enough to justify a purchase. The useful question is whether the truck can lower total cost per productive container move on a defined group of lanes.
That requires a model that combines acquisition cost, grants, energy, charging, downtime, payload, maintenance, and dispatch utilization. Fleets should qualify the operating pattern first and select the equipment second.
Separate vehicle support from infrastructure readiness
Purchase incentives address only one part of the economics. San Pedro Bay previously offered $60 million in vouchers for zero-emission Class 8 drayage trucks, with incentives of up to $150,000 per truck, as Supply Chain Dive reported. Those funds can materially reduce the capital gap, but they do not guarantee that a fleet has energized chargers, sufficient utility capacity, a workable tariff, or parking access during charging windows.
The remaining gap is significant. A diesel day cab can start near $150,000 while a battery-electric model may cost about $450,000, according to FreightWaves. A $150,000 purchase voucher and a potential $36,000 annual utilization payment improve the equation, but they should be treated as cash-flow inputs—not proof of operating viability.
Create two approval gates. The vehicle gate confirms truck price, incentive eligibility, financing, warranty, payload, and expected residual value. The infrastructure gate confirms charger location, power availability, energization date, charging speed, redundancy, parking rights, demand charges, and the party responsible for maintenance. Do not release a truck order merely because the first gate passes.
Build the comparison around productive moves
Traditional total-cost-of-ownership models often divide annual cost by miles. Drayage fleets need an additional denominator: productive loaded container moves. Port dwell, chassis availability, appointment timing, empty repositioning, and charging can change the number of revenue-generating turns completed in a shift even when mileage barely changes.
For each truck and lane group, calculate annual ownership and operating cost as:
Capital recovery + financing + insurance + energy + maintenance + charging infrastructure + driver time + downtime cost - confirmed incentives.
Then divide that figure by completed productive moves. Count a move only when it satisfies the operation's commercial definition—for example, a container delivered from terminal to customer or an export container returned to the terminal. Track bobtail and empty-container legs separately so they do not masquerade as output.
Run the diesel and zero-emission cases with the same freight demand, appointment assumptions, driver rules, and service requirements. Show incentives as separate lines with eligibility probabilities and expiration dates. A program that pays for port activity should also be modeled in tiers: the truck receives nothing below the qualifying threshold, a partial amount at the expected utilization level, and the maximum only when the fleet can realistically sustain it.
Qualify lanes before assigning electric trucks
Battery-electric drayage is strongest where work is repeatable and charging can fit into scheduled idle time. Current battery-electric truck models cited by FreightWaves offer roughly 150 to 330 miles of range, making short-haul, single-shift drayage a practical target. Nameplate range is not dispatchable range, however. Payload, grade, weather, congestion, battery reserve, and charger availability all reduce the planning envelope.
Score every candidate lane on four conditions:
- Daily miles: Use observed miles at the 90th or 95th percentile, not the average, and retain a defined battery reserve.
- Dwell pattern: Identify whether terminal, customer, break, and overnight dwell create reliable charging windows.
- Charger access: Confirm the truck can reach a compatible, operational charger without an unproductive detour or queue.
- Dispatch predictability: Favor repeat customers, known appointment windows, stable shift length, and low emergency reassignment frequency.
Payload needs its own check. Compare tractor tare weight and legal axle distribution for the actual containers carried. If battery weight forces loads onto another tractor or creates additional turns, the cost belongs in the electric case. Conversely, regenerative braking, lower routine maintenance, and lower energy cost should be credited only with fleet-specific evidence.
Start with a lane cohort, not the entire fleet. Good early candidates include short shuttle patterns between the ports and nearby distribution centers, especially where trucks return to a controlled yard. Long, variable trips with no dependable destination charging should remain outside the initial assignment pool even if their average mileage looks acceptable.
Price downtime and charging honestly
Charging time is not automatically downtime. Charging during a driver break, terminal dwell, or overnight parking may have little incremental cost. Charging that interrupts a second revenue turn is expensive. The model should distinguish coincident charging from displaced productive time.
Record charger arrival, plug-in, energy start, energy stop, unplug, queue time, failed sessions, and state of charge. Translate failures into missed appointments, substitute-tractor cost, driver hours, and lost moves. Include utility demand charges and charger utilization: an oversized site with lightly used hardware can make electricity appear cheap while infrastructure cost per truck remains high.
Build a fallback rule before deployment. Dispatchers need to know the minimum state of charge for accepting another move, approved alternate chargers, when to swap tractors, and which diesel unit protects the customer commitment. Without those rules, each low-charge event becomes an improvised operational decision.
Use an incentive-ready scorecard
Review performance weekly by truck, lane, customer, terminal, and shift. The core scorecard should include productive moves per operating day, loaded miles, empty miles, kilowatt-hours per move, energy cost per move, charging and queue minutes, charger success rate, maintenance hours, incentive earned, and all-in cost per productive move.
Add emissions per productive move rather than reporting only trucks purchased or tailpipe emissions avoided. That keeps environmental performance tied to freight output and exposes cases where extra repositioning or substitute equipment weakens the result.
The winning deployment is not the one with the largest grant or the most electric tractors. It is the one that repeatedly completes eligible port moves at a competitive cost while meeting service and emissions targets. San Pedro's utilization incentive can improve that outcome, but only disciplined lane selection and operational measurement can sustain it.
CXTMS can connect port moves, appointments, tractor assignments, charger events, energy costs, incentives, and exceptions in one operating record. Request a CXTMS demo to see how fleets can compare cost and emissions per productive move before scaling zero-emission drayage.