Port Rail Dwell Is Rising: Split Truck and Intermodal Gateway Scorecards

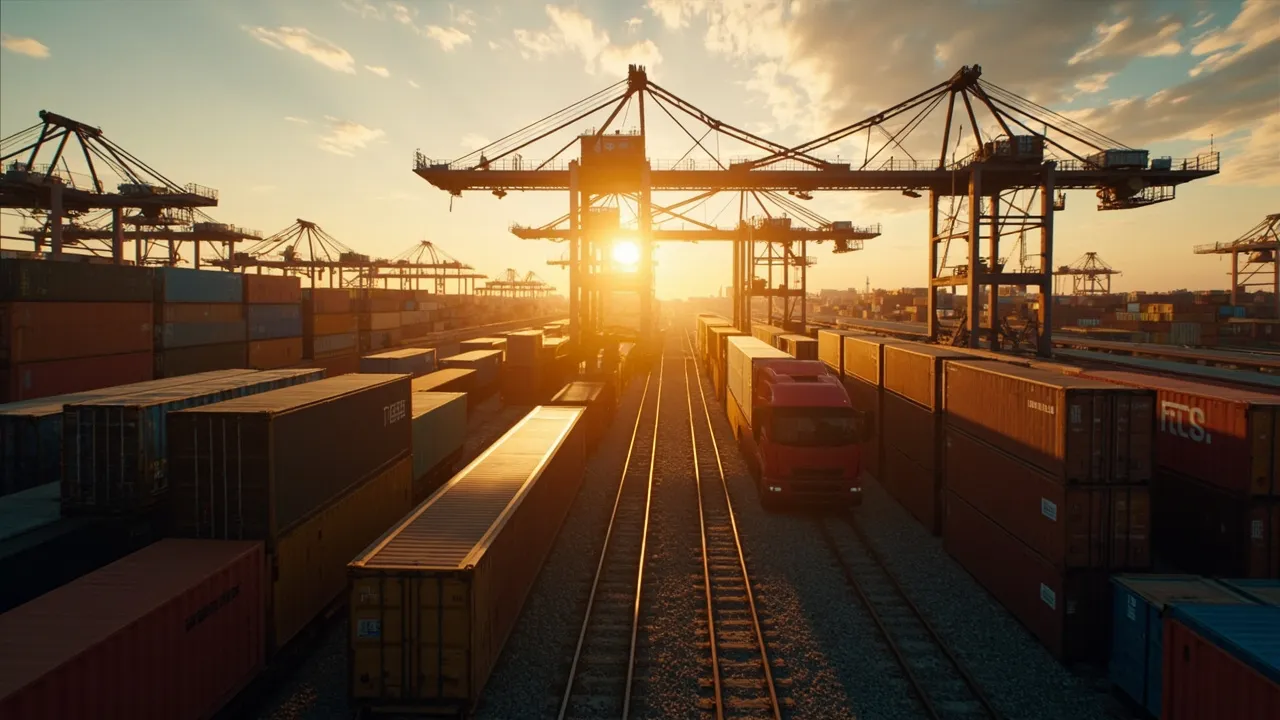
A port can look healthy on an executive dashboard while rail-bound containers sit for nearly a week. That is not a contradiction. It is what happens when truck and intermodal freight share a gateway but depend on different handoffs, capacity constraints, and departure schedules.
The distinction matters during the fall import season. A blended port-dwell average can reassure beneficial cargo owners just as rail congestion starts threatening inland delivery dates. Conversely, a rail problem should not trigger an expensive diversion of every container through local drayage. The practical answer is to split the gateway scorecard by mode and manage the delayed segment.
One terminal, two very different clocks
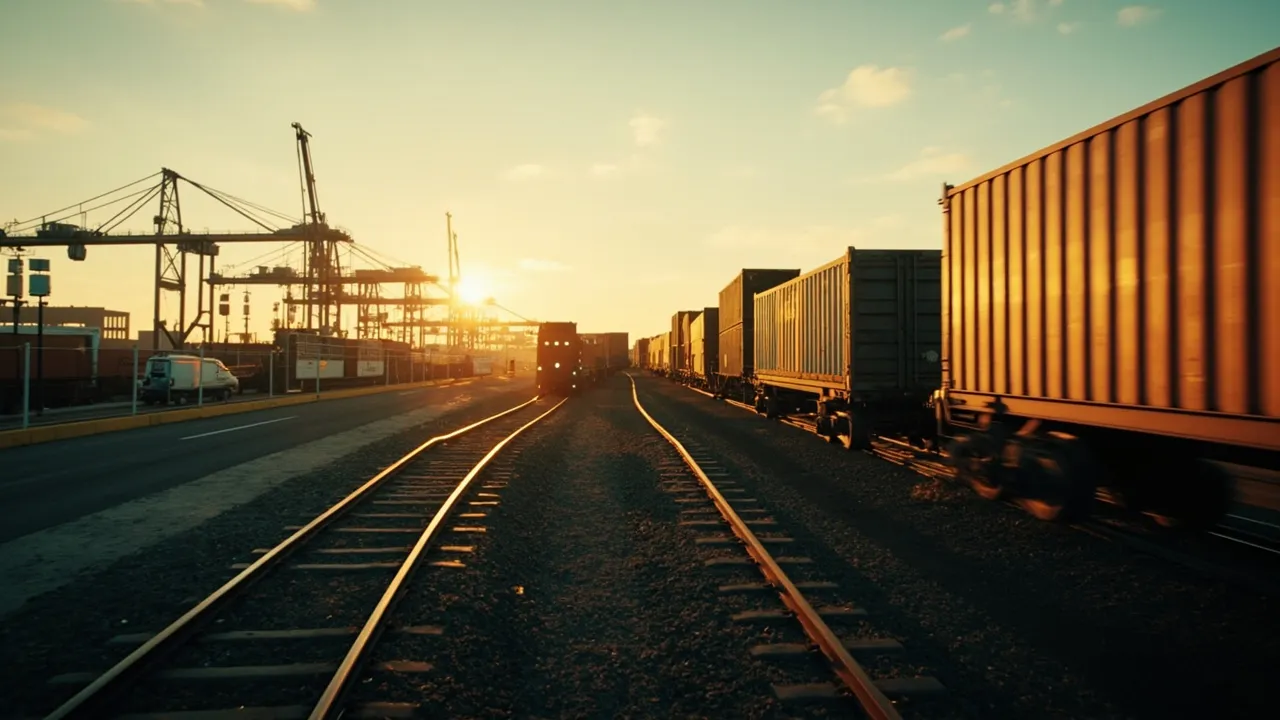
Recent Southern California data makes the gap clear. FreightWaves reported that average local truck dwell at the Los Angeles–Long Beach complex was 2.95 days, while dwell for rail-destined cargo increased from 6.34 days in July to 6.75 days. A single average would blur a difference of almost four days between the two flows.
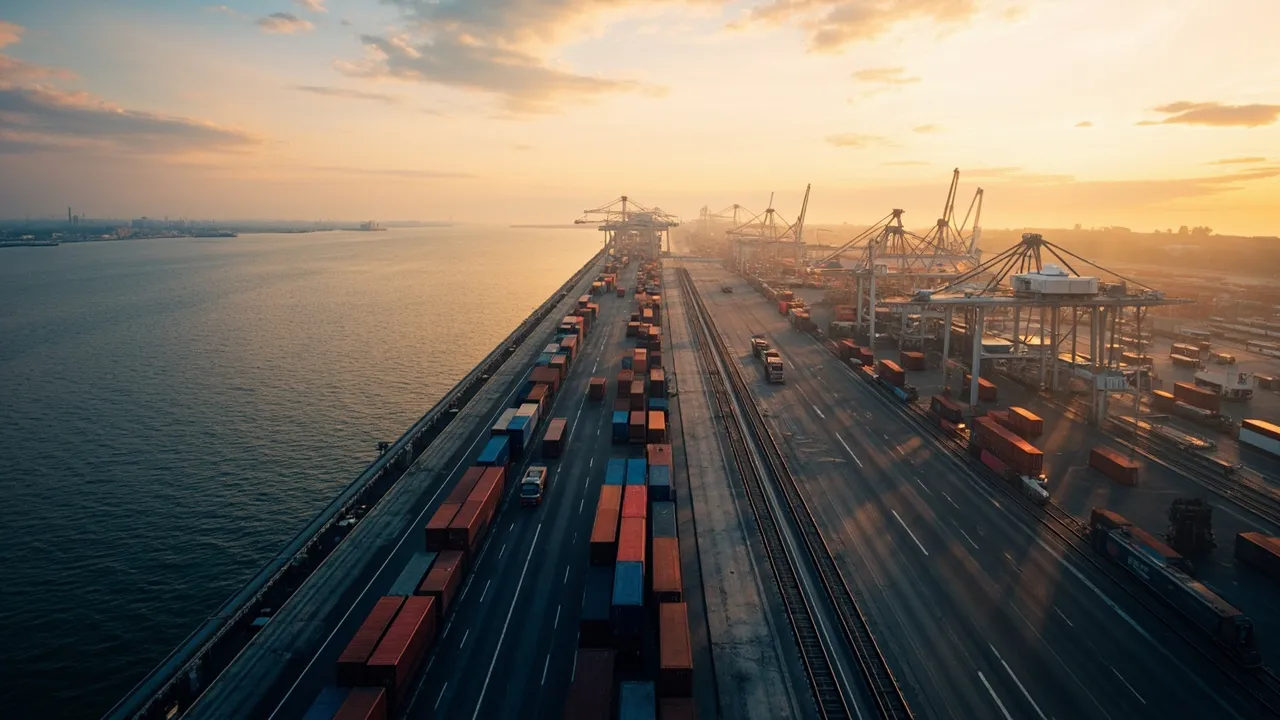
The pressure is arriving alongside substantial volume. In August, the Port of Long Beach handled a record 944,585 twenty-foot equivalent units (TEUs), according to FreightWaves. Through the first eight months of 2026, it moved 6,678,078 TEUs—1.3% more than the same period in 2025. High throughput is evidence that the gateway is working hard, not proof that every inland mode is flowing equally well.
Rail also represents a meaningful share of the system. FreightWaves reported separately that about 28% of containers were leaving the terminals by train. When more than one in four boxes depends on intermodal coordination, rail dwell cannot be treated as a footnote to an otherwise strong port average.
The issue is not limited to one surge. During a previous West Coast congestion period, Supply Chain Dive noted that Long Beach rail dwell was about four days as of November 12, 2024. That history reinforces the operational lesson: rail performance has its own cycle and needs its own thresholds.
Replace the average with an event chain
A useful scorecard does not start and stop with “container available” and “container departed.” It records each operational handoff so planners can see where time accumulates.
For truck-bound imports, track vessel discharge, customs and other-government-agency release, terminal availability, appointment availability, truck gate-in, gate-out, and empty return. The main questions are whether the box was legally available, whether the motor carrier could secure an appointment, and whether pickup occurred within free time.
For rail-bound imports, extend the chain. Record discharge, release, terminal availability, rail billing, train-plan assignment, loading to railcar, actual train departure, arrival at the inland ramp, inland availability, and final pickup. A container can be available at the marine terminal yet wait days for a railcar, a complete train block, or a departure slot. Calling that entire interval “port dwell” hides the responsible handoff.
Every timestamp should carry an exception code. Customs hold, documentation failure, chassis shortage, terminal congestion, railcar shortage, missed cutoff, train cancellation, and consignee delay require different owners and remedies. Without those codes, teams merely observe lateness; they cannot manage it.
Set mode-specific thresholds
Truck and rail flows should never compete against the same target. Their normal operating cycles are structurally different. Build thresholds from each lane's recent baseline and the delivery promise attached to the shipment.
A practical gateway scorecard should show:
- Truck dwell: median and 90th-percentile hours from terminal availability to gate-out, plus the share collected within free time.
- Rail loading time: hours from availability and complete billing to placement on a railcar.
- Rail departure time: hours from rail loading to actual terminal departure.
- Inland-ramp dwell: hours from destination availability to consignee pickup.
- End-to-end reliability: percentage reaching the final facility by the committed date, separated by truck and intermodal service.
Use warning and critical bands rather than one red line. For example, a rail lane might enter warning status when its rolling seven-day median rises 20% above its 28-day baseline, then become critical when the projected inland arrival threatens the customer or production commitment. The exact values should reflect contracted free time, train frequency, commodity urgency, and inland alternatives.
Volume belongs beside dwell, too. A six-day average affecting 50 containers is a different exposure from the same average affecting 2,000. Multiply delayed units by inventory value, demurrage risk, and hours of delivery slack to prioritize intervention.
Reroute the affected inland flows—not the whole gateway
When rail dwell rises, a blanket port diversion is usually too blunt. It disrupts ocean routings, carrier allocations, and warehouse plans while strong truck-side performance may still offer a targeted escape valve.
Start by identifying containers that are released but not yet rail-loaded and have the least delivery slack. Determine whether they can be converted to transload or direct drayage without violating customs status, terminal rules, or commercial terms. Compare the conversion cost with expected rail delay, storage charges, inventory risk, and customer impact.
Then segment the response:
- Protect rail moves with sufficient slack. Leave low-urgency freight on its planned service and monitor the next confirmed train event.
- Convert urgent regional freight. Use drayage or a nearby transload for shipments whose destinations and economics support trucking.
- Shift future bookings selectively. Move only the inland lanes repeatedly breaching thresholds to an alternate gateway or service string.
- Preserve the evidence. Record the delay cause, avoided cost, conversion premium, and final delivery result so the next decision uses actual performance.
The trigger should be shipment-specific. A high-value production component with one day of slack deserves attention before a low-value replenishment load with two weeks of inventory coverage, even if both have identical terminal dwell.
Build a gateway view that tells the truth
Executives still need a concise dashboard, but concision should not mean averaging away risk. Show truck and rail dwell side by side, then let users drill into terminal, carrier, inland ramp, commodity, and customer commitment. Add the count of containers at each event stage and the value of inventory exposed.
That design changes the operating conversation. Instead of asking whether the port is congested, teams can ask which rail handoff is late, which loads will miss their promises, and which alternatives cost less than waiting. During peak volume, that precision protects service without turning every exception into a network-wide crisis.
Ready to connect ocean milestones, terminal events, rail departures, and inland delivery commitments in one control view? Request a CXTMS demo to build mode-specific gateway scorecards and act on the exceptions that matter.