Prologis' Million-Square-Foot Minooka Warehouse: Testing Rail-Adjacent Location Economics

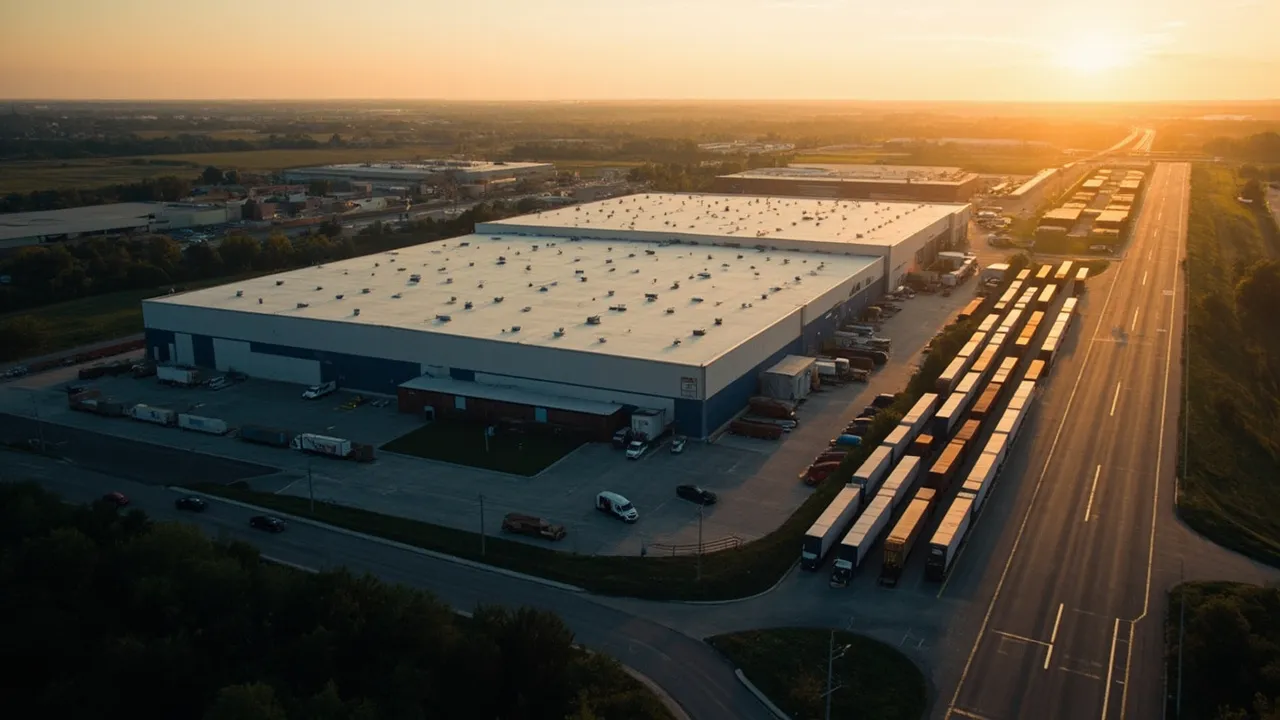
Prologis' plan for a giant warehouse southwest of Chicago is a useful reminder that a pin on a map is not a network strategy. Rail adjacency can lower transportation cost, but only when the building, freight profile, labor market, and operating cadence allow the network to capture that advantage.
Logistics Management reports that Prologis acquired 69 acres in Minooka, Illinois, for Minooka Exchange, a planned 1,002,000-square-foot facility near Interstate 80. The developer had not disclosed the purchase price, construction cost, completion date, or tenant when the project was announced.
Those unknowns matter. The building's proximity to a Canadian National rail hub and a major highway corridor creates options, but an operator still has to prove that those options improve total landed cost and service.
Rail adjacency is valuable only when freight fits
Intermodal economics improve as the rail linehaul becomes a larger share of the trip. FreightWaves found that intermodal shippers saved an average of 17% on hauls longer than 1,200 miles, compared with 9% across all lengths of haul. The Los Angeles-to-Chicago lane exceeds 2,000 miles, giving lower rail linehaul and fuel costs enough distance to offset first- and final-mile drayage.
Shorter lanes behave differently. In the Chicago-to-Atlanta corridor, FreightWaves recorded domestic intermodal volume falling from 325 containers per day to 270 as dry-van tender rejections declined from more than 5% to just over 2%. Truckload spot rates on the lane fell from above $2.90 per mile to $2.35, narrowing the intermodal advantage enough to move freight back to the highway.
That evidence turns “near rail” into a testable question. A Minooka user should segment inbound and outbound volume by lane, length of haul, shipment density, container compatibility, time sensitivity, and rate volatility. Long, dense, repeatable lanes may support rail. Short, irregular, or urgent flows may not.
Calculate the full transfer cost
The relevant comparison is not rail rate versus truckload rate. It is door-to-door cost and service, including:
- rail linehaul and fuel surcharge;
- origin and destination drayage;
- terminal lifts and chassis charges;
- container or trailer detention;
- transload labor and handling, when required;
- inventory carrying cost during added dwell;
- damage, shortage, and exception cost; and
- recovery transportation when a rail cutoff is missed.
Suppose rail saves $500 on linehaul but requires two $175 dray moves, $75 in lift charges, and one extra day of inventory. Most of the apparent advantage disappears before exception risk is considered. Conversely, reducing a terminal-to-warehouse dray by 25 miles across thousands of annual containers can create a durable saving. The answer depends on actual turns, not the facility brochure.
A useful model compares each candidate mode at the shipment level. Calculate cost per order, cost per hundredweight, door-to-door transit time, transit variance, and carbon intensity. Then stress-test fuel, truckload, chassis, labor, and detention assumptions. Rail adjacency is an option whose value changes with the market.
Four location variables belong in one model
1. Labor reach
A million-square-foot building can require a large workforce even with automation. Commute times, shift overlap, local wage competition, turnover, and access to technical maintenance skills affect the real operating cost. Inbound Logistics notes that professional site studies can examine more than 70 variables, including transportation access, operating cost, building configuration, labor availability, and business climate.
Model workers available within 30-, 45-, and 60-minute drive times by shift. Add wage premiums, overtime, vacancy days, training, and turnover. A small drayage saving can be overwhelmed by chronic understaffing.
2. Dray distance and reliability
Measure road miles and expected minutes from each usable rail ramp, not straight-line distance. Include congestion by time of day, gate hours, appointment performance, chassis availability, and driver round-trip capacity. A warehouse close to a ramp can still perform poorly if a container crosses a congested interchange or routinely misses the receiving window.
3. Inventory dwell
Rail can trade speed for cost. That trade works for predictable replenishment but can damage service on volatile or high-value products. Measure terminal dwell, warehouse dwell, demurrage exposure, stockout frequency, and the inventory value tied up per transit day. The network should reserve faster truck capacity for shipments whose margin or customer promise justifies it.
4. Highway access
I-80 access protects optionality. It supports regional truckload, final-mile replenishment, diversion during rail disruption, and balanced outbound moves. But the analysis should use actual carrier routes, tolls, congestion, winter reliability, and customer delivery windows. “Near the interstate” is not a KPI.
Turn the site thesis into post-opening KPIs
Before opening, operators should record the assumptions that justified the location. After launch, they should compare those assumptions with a monthly scorecard:
- rail share by eligible lane and actual savings per load;
- terminal-to-dock dray miles, cycle time, and on-time performance;
- rail and warehouse dwell by product class;
- missed cutoffs, demurrage, detention, and recovery spend;
- labor vacancy, overtime, turnover, and units per labor hour;
- truckload cost per mile and tender acceptance;
- inventory days, stockouts, and order-cycle variance; and
- cost-to-serve by customer and mode.
Set decision thresholds. If rail savings remain below transfer and inventory costs for three months, reallocate the lane. If dray cycle time breaches its target, change appointment windows or carrier allocation. If labor overtime erases transport savings, revise automation, shifts, or volume placement.
Minooka Exchange may ultimately prove an excellent node. Its strongest feature is not rail or highway proximity in isolation, but the ability to choose between them. The winning tenant will quantify that optionality continuously—and change mode, inventory, and capacity decisions when the economics move.
Want to connect site assumptions with live shipment, carrier, and cost data? Request a CXTMS demo and see how one transportation platform can turn network design into measurable execution.