Shein's 737,000-Square-Foot Indiana Distribution Center: A Goods-to-Person Launch Scorecard


Shein's newest Indiana distribution center is a large bet on automation, but its first months should be judged by more than how many robots move across the floor. A successful launch must translate machine activity into accurate, on-time customer orders without shifting congestion to receiving docks, replenishment aisles, packing stations, or parcel trailers.
Supply Chain Dive reports that the 737,000-square-foot facility in Lebanon, Indiana, is scheduled to begin operating in September 2026. It uses a goods-to-person system that brings products to employee workstations, reducing walking and manual handling. The building sits about 1.5 miles from Shein's existing Indiana operation, and the two sites give the retailer more than 2.5 million square feet of operational space in the state.
That scale makes the launch strategically important. It also raises the cost of measuring the wrong things.
Goods-to-person changes the constraint
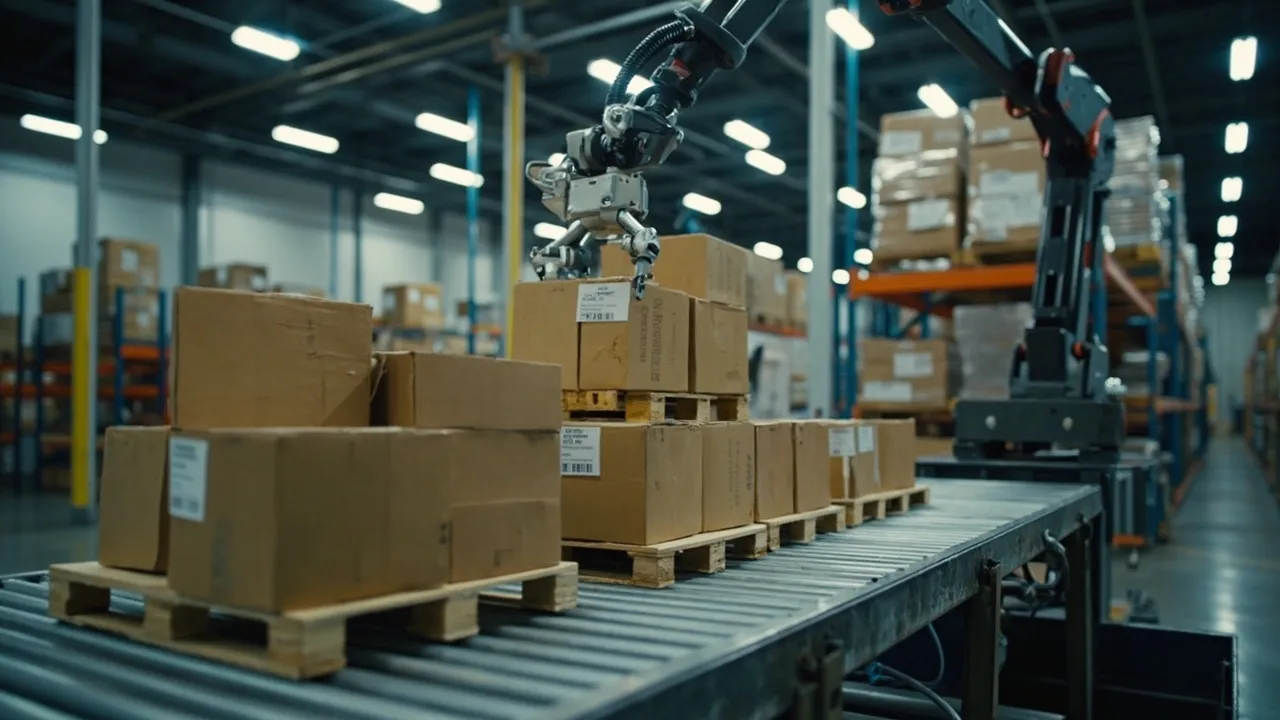
In a conventional picking process, associates travel to inventory. Goods-to-person reverses the movement: software and mobile equipment bring inventory to a fixed workstation, where an associate confirms and completes the pick. The change can reduce travel, simplify training, and improve ergonomics. It does not eliminate work; it redistributes it.
Replenishment becomes especially important. A station can only pick what the system presents, so late replenishment, inaccurate location data, or an unavailable tote can starve an otherwise productive workstation. Packing and sortation must also absorb the steadier output. If downstream capacity is insufficient, work-in-process accumulates between zones and reported picking gains fail to improve ship time.
The labor model changes with the flow. Fewer hours may be spent walking or driving equipment, while more attention goes to workstation quality, exception resolution, replenishment, equipment recovery, and flow control. Safety reviews should therefore measure ergonomic repetition, interaction zones, blocked sensors, and recovery procedures—not merely reductions in travel.
Why launch metrics need a baseline
Automation case studies show the upside, but they also illustrate why every facility needs its own baseline. Modern Materials Handling documented an Indiana GEODIS operation where robotic case picking raised average productivity by about 85%, reached a 150% improvement on some days, and enabled the facility to return from three daily shifts to two. The operation handled roughly 75% of its volume through case picking.
Those figures are valuable evidence that automation can materially change capacity. They are not a forecast for Shein. Product dimensions, SKU velocity, order profiles, replenishment rules, station design, packaging, and carrier cutoff times all affect results. The honest comparison is the new operation against a documented pre-launch or control-site baseline using the same definitions.
The four-part launch scorecard
1. Throughput that reaches the dock
Track units and orders completed per labor hour at picking, but pair those measures with packed orders and carrier-ready shipments. Report performance by hour and shift, not only as a daily average. Averages can hide startup losses, breaks, replenishment gaps, and cutoff surges.
Useful measures include station utilization, units presented per hour, completed picks per staffed hour, pack-line backlog, and the share of orders tendered before carrier cutoff. The governing metric should be shipped orders per total labor hour. That prevents one automated zone from declaring victory while another absorbs its unfinished work.
2. Inventory and order accuracy
Fast presentation of the wrong item is not productivity. Measure inventory accuracy at both the storage-unit and SKU level, then record short picks, wrong-item scans, quantity corrections, and misroutes. Cycle counts should be stratified by high-velocity items, new receipts, and locations with repeated exceptions.
Customer-facing accuracy belongs on the same scorecard: perfect-order rate, reships, refunds caused by fulfillment errors, and orders held for reconciliation. During ramp-up, operations teams should review the most common exception codes daily and assign owners rather than allowing a generic “system issue” category to grow.
3. Downtime and recovery
Availability alone can flatter a fragile system. Record planned and unplanned downtime separately, plus mean time to acknowledge, mean time to recover, and orders affected. Identify the failure domain: robot, workstation, conveyor, network, orchestration software, WMS interface, or upstream inventory condition.
A launch is becoming stable when recovery grows faster and repeat failures decline. Teams also need tested degraded modes. They should know which orders can be processed manually, how inventory movements will be reconciled afterward, and who can authorize a fallback during a carrier-cutoff window.
4. End-to-end order-cycle time
Measure elapsed time from order release to pick start, pick completion, pack completion, manifest, and physical carrier handoff. Use percentiles—especially the 90th and 95th—not just averages. A fast median can coexist with a long tail of stranded orders.
Segment results by service promise, order size, SKU velocity, and exception status. The goal is not simply a lower cycle time; it is predictable completion before the correct outbound cutoff.
Synchronize the TMS with the automation ramp
The transportation management system should act as the boundary between warehouse potential and executable freight capacity. On inbound moves, appointment plans should reflect receiving doors, unloading labor, quality checks, and replenishment priorities. The TMS can flag loads containing launch-critical or high-velocity SKUs and prevent too many arrivals from competing for the same receiving window.
Outbound planning needs the same discipline. Expected order completion by service level should be compared with parcel trailer capacity, pickup schedules, sort-center induction windows, and contingency carriers. As the automated system ramps, carrier capacity should rise in controlled steps—not from a theoretical maximum on opening day.
A shared control view should connect four timestamps: inbound appointment, inventory availability, promised order completion, and carrier cutoff. When projected output exceeds booked parcel capacity, planners can add a sweep, redirect volume, change order-release priorities, or protect premium-service orders before a dock backlog develops.
Ramp in gates, not optimism
Shein's new building should progress through defined volume gates. Each gate can require minimum inventory accuracy, maximum critical downtime, stable 95th-percentile order-cycle time, and confirmed outbound capacity for several consecutive operating days. Missed thresholds should hold the next increase until the root cause is closed.
This method makes the launch measurable and reversible. It also gives warehouse, transportation, IT, safety, and carrier teams one operational definition of readiness. In a goods-to-person network, local speed is useful; synchronized flow is the real prize.
Ready to connect warehouse output, inbound appointments, carrier capacity, and customer commitments in one execution layer? Request a CXTMS demo to see how transportation workflows can support an automation ramp from receiving through final tender.