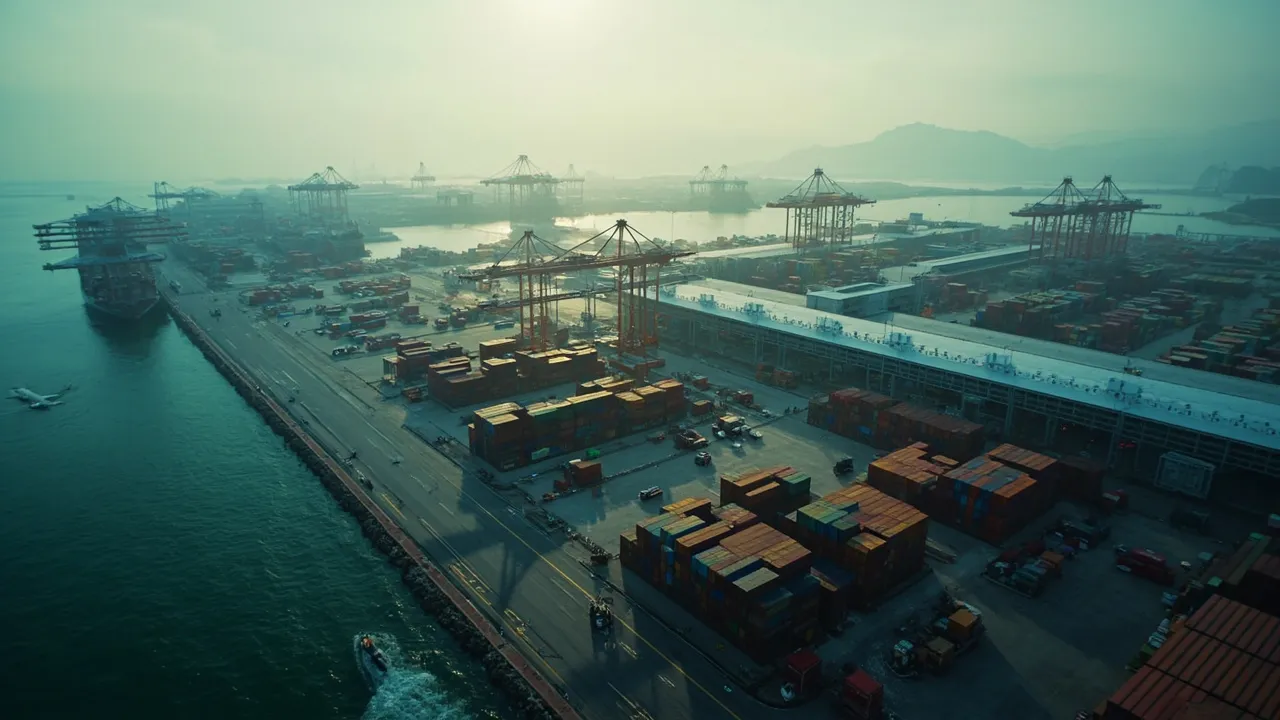
U.S.-Canada Trade War: Build a Commodity-Level Sourcing Exposure Map


Country-level trade totals tell executives that a U.S.-Canada trade dispute is large. They do not tell a planner which purchase order, border crossing, customer margin, or production schedule will fail first.
That distinction matters now. Supply Chain Dive reports that negotiations failed to avert 50% U.S. tariffs on $20 billion of Canadian goods, while Canada responded with tariffs of up to 50% on U.S. imports including steel, dairy products, appliances, and agricultural equipment. Exposure spans agriculture, forest products, apparel, consumer goods, food, and the packaging materials connecting them.
The practical response is not another country-risk dashboard. Shippers need a commodity-level sourcing exposure map that connects tariff classifications to suppliers, transportation lanes, contracts, and operational alternatives.
Start below the country total
A useful exposure record begins with the commodity and ends with the customer commitment. At minimum, capture:
- item and commodity description;
- supplier and production site;
- country and region of origin;
- Harmonized System or HTS tariff code;
- USMCA qualification and documentation status;
- normal border crossing and backup crossing;
- annual quantity, shipment frequency, and mode;
- current unit cost, duty rate, freight cost, and brokerage cost;
- customer contract, price-adjustment terms, and service commitment;
- approved substitutes, alternate suppliers, and qualification lead time.
This structure prevents a common analytical error: treating every Canadian-origin item as equally exposed. Two products can cross the same border under different tariff codes, origin rules, contract terms, and margins. One may remain commercially viable after a duty increase; the other may become unprofitable before it reaches the consignee.
The map must also distinguish where value is added. A finished consumer product assembled in Canada may contain U.S.-origin packaging or components that already crossed the border once. A tariff applied on the return movement can compound earlier transportation and inventory costs. Mapping only the final supplier obscures that loop.
Separate duty exposure from secondary risk
Direct duty exposure is the easiest calculation: customs value multiplied by the applicable tariff rate. It is also incomplete. The more consequential effects can appear in packaging availability, carrier capacity, lead time, and substitution constraints.
Packaging illustrates the problem. A separate Supply Chain Dive analysis notes that Canadian measures cover $27.6 billion in U.S. imports and include pulp and paper, while metal levies are set to double from 25% to 50%. The same report says U.S. can makers import nearly 80% of their tin mill steel, and Canada supplies about two-thirds of the primary aluminum used in the United States.
Those dependencies make packaging a secondary exposure for products that are not themselves tariffed. A food SKU may retain its existing duty rate yet face more expensive cans, corrugated cases, or pallets. An alternate domestic supplier may exist but lack immediate capacity. A material substitution may require new artwork, line trials, food-contact approval, or customer acceptance.
For each commodity, score secondary exposure across five operational fields: packaging dependency, alternate capacity, qualification time, lead-time volatility, and mode or crossing flexibility. Keep these as observable facts—not a vague red-yellow-green label. “Alternate supplier requires 14 weeks and a line trial” is actionable; “medium risk” is not.
Build a landed-cost scenario, not a tariff column
Each exposed lane should have a baseline and at least three scenarios: current policy, announced policy, and a disruption case. The landed-cost calculation should include purchase price, duties, freight, fuel, brokerage, insurance, handling, financing cost for inventory, and expected premium freight.
Then connect the result to the contract. Identify whether a surcharge is permitted, how much notice is required, and who approves a price change. A 50% duty on a low-value input may be manageable; a smaller increase on a high-value, low-margin product may require immediate commercial escalation.
Planners should also model time. Pulling inventory forward can reduce near-term duty exposure, but it consumes working capital and warehouse space. Rerouting through another crossing may avoid congestion, but add miles and carrier constraints. The map should show both dollars per unit and days added to replenishment.
Define triggers before the disruption
An exposure map becomes an operating tool only when each response has a measurable trigger. Useful triggers include:
- Alternate sourcing: activate when projected duty plus conversion cost exceeds the approved alternate's landed cost for a defined volume period.
- Inventory buffer: add days of supply when a tariff effective date is confirmed and storage, shelf-life, and cash constraints remain acceptable.
- Landed-cost reapproval: require review when total landed cost rises beyond a fixed percentage or erodes customer margin below its floor.
- Route change: move to a backup crossing when dwell time or rejection rates exceed the lane threshold for two consecutive cycles.
- Customer escalation: notify account owners when contract pricing cannot absorb the modeled cost or service promise.
Every trigger needs an owner, data source, approval path, and expiration date. Temporary buffers have a habit of becoming permanent inventory unless the unwind condition is recorded at the same time.
Make the map part of transportation execution
The final step is connecting sourcing analysis to shipment decisions. A transportation management system should carry the relevant item origin, tariff classification, supplier, crossing, customer contract, and landed-cost scenario alongside the load. That allows teams to prioritize compliant routes, compare executable alternatives, and preserve an audit trail for why a shipment moved under a particular plan.
CXTMS helps freight forwarders and logistics teams centralize shipment data, control cross-border workflows, and turn changing cost assumptions into operational decisions. Request a CXTMS demo to see how your team can manage sourcing exposure and transportation execution in one workflow.