Big-and-Bulky Last-Mile Delivery Is Slowing: How to Reprice Capacity When Housing Demand Falls

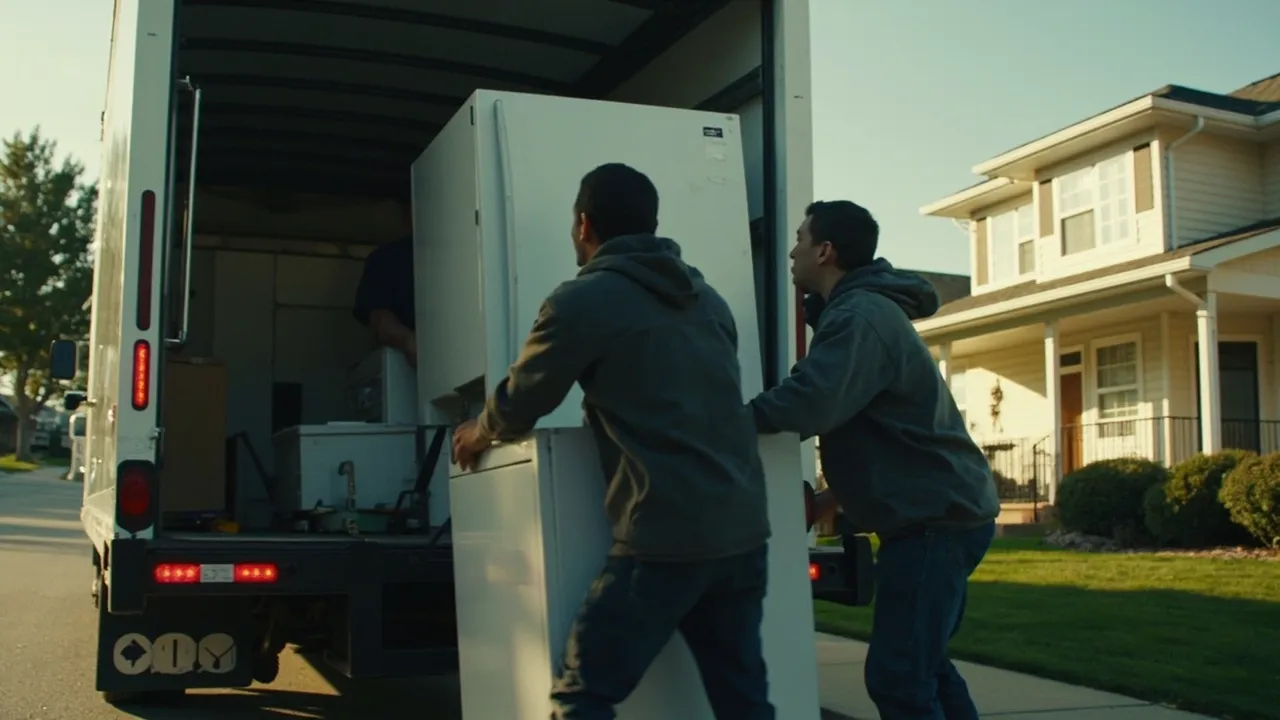
Big-and-bulky last-mile delivery has a demand problem that ordinary parcel benchmarks cannot explain. Furniture, appliances, mattresses, fitness equipment, and home-improvement products are tied closely to household moves and renovations. When fewer homes change hands, fewer consumers need to fill new rooms or replace major items.
That slowdown matters because oversized delivery networks carry a heavy fixed-cost burden. A box truck with a liftgate, a two-person crew, appointment capacity, and in-home service skills cannot be resized as easily as a parcel route. Operators therefore need to reprice capacity at the lane and service level—not apply one blanket increase across the network.
The Growth Reset Is Material
FreightWaves reports that the U.S. residential delivery market for oversized and heavyweight goods is valued at $10.6 billion. Armstrong & Associates estimates it will grow at a 5.1% compound annual rate through 2027, less than half the 10.6% rate recorded over the previous eight years.
The housing connection is unusually direct. Only 28 of every 1,000 homes changed hands last year, a 30-year low. That was 38% below the 2021 level of 44 per 1,000 and 44% below the pre-pandemic pace. This is not merely softer ecommerce growth. It removes purchase occasions for product categories that are expensive to deliver and difficult to consolidate.
At the same time, delivery economics remain unforgiving. The last mile can represent 30% to 40% of total transportation cost. Basic curbside or threshold jobs may generate only $70 per shipment, while a high-touch room setup with installation can produce up to $450. Gross margins in the sector slipped from 28.9% in 2022 to 27.5% last year.
Those ranges show why average revenue per stop is a weak pricing guide. Two deliveries on the same ZIP-code route can consume radically different labor, equipment, dwell time, and claims exposure.
Separate the Cost of the Stop From the Cost of the Promise
Every lane should be modeled in two layers. The first is physical execution: stem miles, route miles, crew hours, equipment, fuel, tolls, and expected dwell. The second is the customer promise: appointment precision, room of choice, stairs, assembly, installation, debris removal, haul-away, and return handling.
Start with a stop-level contribution calculation:
revenue − allocated route cost − service labor − expected exception cost
Expected exception cost should include failed appointments, redelivery, damage, access problems, and overtime. A lane that looks profitable on linehaul and planned labor can turn negative after one missed delivery forces a second two-person visit.
Then normalize the results by operational driver. Track cost per completed stop, cost per crew-hour, revenue per route-hour, dwell minutes per service type, first-attempt success, damage cost per shipment, and contribution per delivery day. These measures expose what a blended cost-per-shipment number hides.
Inbound Logistics notes that stable total freight spend can conceal worsening cost per order, shipment, or pound. It recommends connecting transportation data to financial outcomes and normalizing it against volume. That discipline is especially important when falling demand makes a route appear cheaper simply because fewer total dollars were spent.
Reset Capacity Lane by Lane
Repricing should begin with a rolling eight- to twelve-week view of each delivery zone. Group stops by service level, equipment requirement, appointment window, and crew configuration. Then calculate the minimum weekly volume required to cover fixed route costs at the target margin.
Use that analysis to make four decisions:
- Delivery-day coverage. Consolidate low-density zones into fewer scheduled days instead of running lightly loaded routes throughout the week. Preserve premium-day service only where customers will pay for it.
- Minimum charges. Set a base charge that covers truck dispatch and crew deployment before mileage and service add-ons. Remote or low-density stops should carry a zone minimum, not merely a small mileage increment.
- Capacity commitment. Match dedicated crews to durable baseline demand. Use flexible or brokered capacity for peaks, but price the added procurement and quality risk explicitly.
- Service menu. Price curbside, threshold, room-of-choice, assembly, installation, and haul-away as distinct products. Bundling them under one rate invites the most demanding stops to consume the margin from simpler work.
The goal is not to raise every rate. High-density lanes with short dwell and reliable customers may support sharper pricing. Low-density lanes with narrow windows and frequent exceptions require a higher minimum or a reduced delivery calendar.
Use TMS Data to Defend the New Price
A transportation management system should make the rate change auditable. For each customer, lane, and service code, it should preserve planned versus actual miles, arrival and completion timestamps, crew assignment, accessorial events, failed-delivery reasons, claims, and redelivery cost.
With those records, commercial teams can show why a price changed. A customer may discover that its core freight rate is reasonable while a high failed-appointment rate or overly narrow appointment promise is destroying capacity. The remedy could be better customer notifications and wider windows rather than a general increase.
The same data supports a weekly capacity review. Planners can compare booked stops with the break-even threshold, open or close delivery days, adjust cutoffs, and test whether stop density offsets longer dwell. Finance gains a direct bridge from route behavior to customer margin.
Big-and-bulky demand is still growing, but the easy double-digit expansion has ended. Operators that keep yesterday's routes and spread lower volume across them will slowly surrender margin. Those that measure the real cost of each stop, promise, and exception can resize capacity while protecting the service quality that retailers and consumers still expect.
Ready to turn shipment activity into defensible lane pricing and capacity decisions? Request a CXTMS demo to see how connected transportation data can improve last-mile planning and profitability.