Canada’s Food Supply Chain Probe Turns Grocery Inflation Into a Logistics Question
Canada’s latest grocery-cost investigation is easy to read as a retail pricing story. It is not. It is a logistics story with a retail symptom.
The Competition Bureau’s new examination looks beyond grocery stores into harvesting, production, processing, logistics, and transportation. That scope matters. If regulators want to understand why food prices remain painful for households, they have to trace how capacity, freight, cold-chain execution, supplier access, and regional distribution economics move through the system before an item ever reaches a shelf.
According to Supply Chain Brain, the bureau is building on its 2023 grocery competition work and focusing on the broader food supply chain because food prices have risen sharply in recent years. The same report notes that Canada’s five largest retail grocers—Loblaw, Sobeys, Metro, Walmart, and Costco—account for approximately 80% of total Canadian retail grocery sales.
That concentration figure is the headline. But the operational question underneath it is more useful: when a small number of large buyers dominate the route to the consumer, how easily can producers, processors, distributors, and regional carriers reach the market on fair economic terms?
Grocery inflation starts before the checkout lane
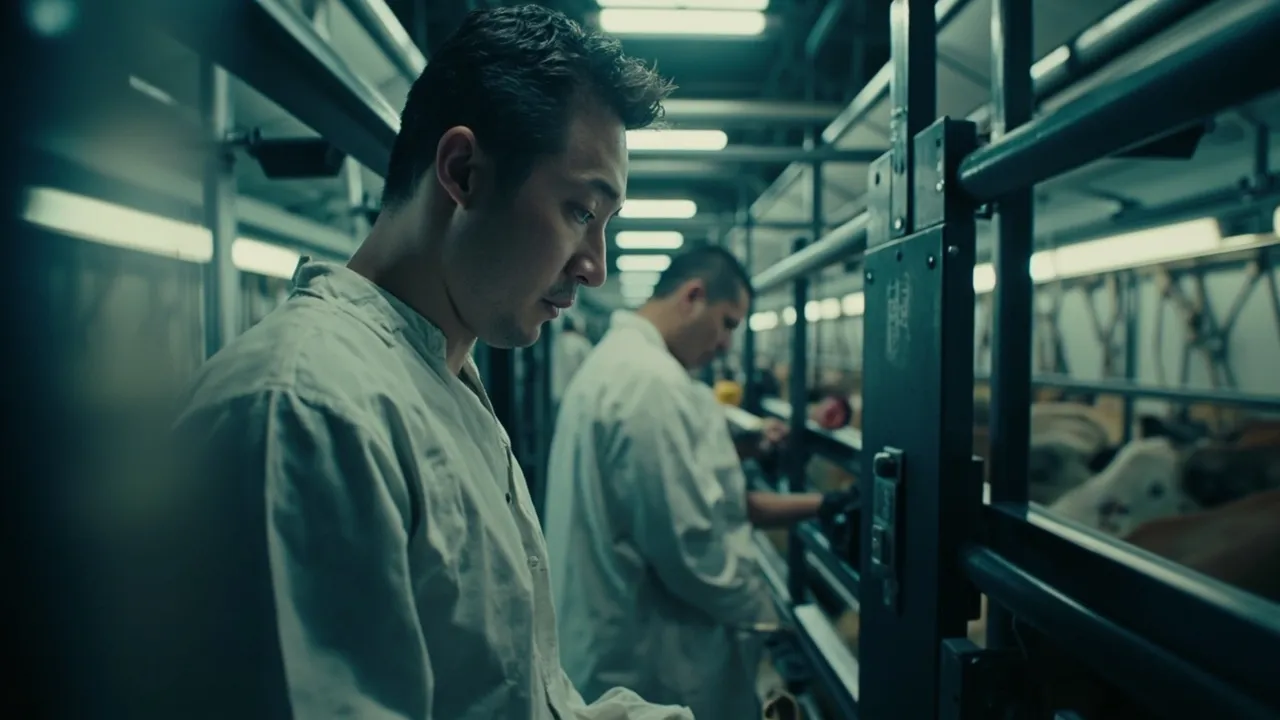
Food prices do not begin at the scanner. They begin with production economics, input availability, processing schedules, warehouse capacity, and transportation networks that often have narrow timing windows.
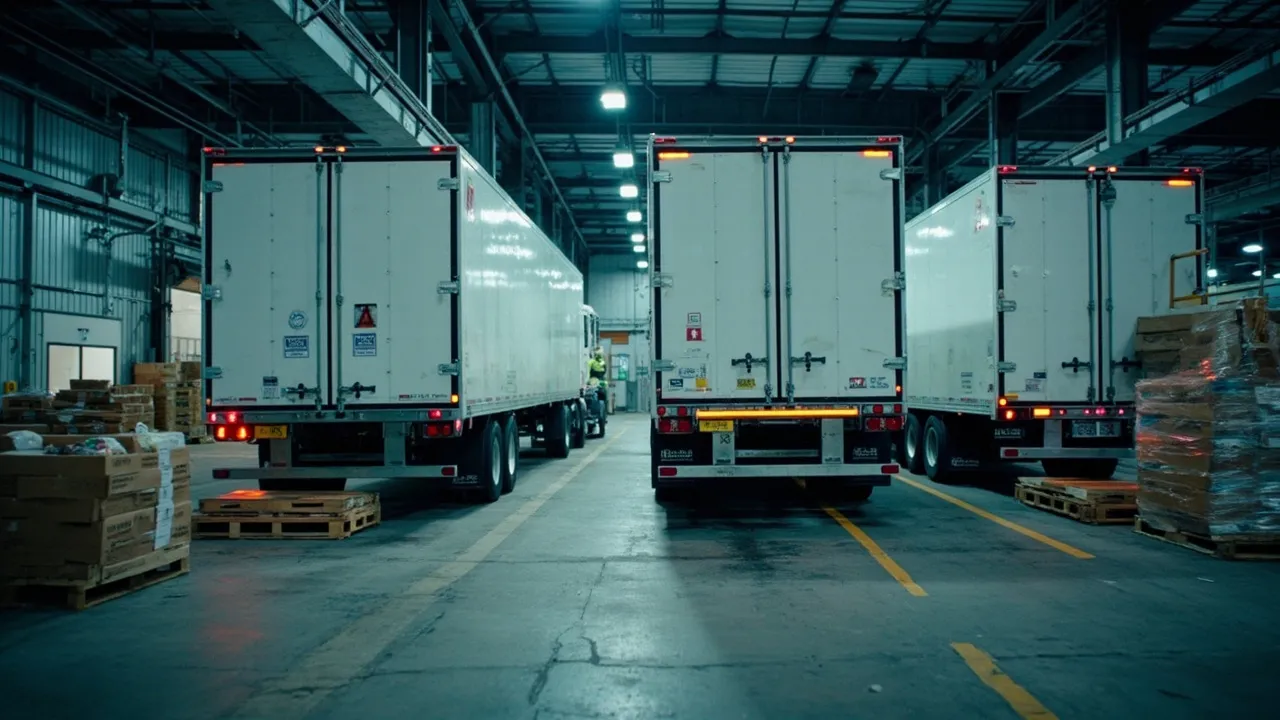
A dairy processor cannot simply wait out a weak lane the way a slow-moving durable goods shipper might. A produce supplier cannot ignore dwell time, temperature abuse, or missed appointment windows. A frozen food distributor cannot reroute without considering cold-chain capacity, backhaul economics, and store-level receiving constraints. Even dry grocery networks depend on predictable inbound supply, regional warehousing, replenishment cadence, and fuel-sensitive delivery routes.
That is why the bureau’s inclusion of logistics and transportation is significant. Freight is not just a cost line buried inside a finished product. It decides which suppliers can serve which regions, how much spoilage or shrink enters the system, how much safety stock retailers carry, and how quickly price pressure travels from upstream disruption to consumer shelf.
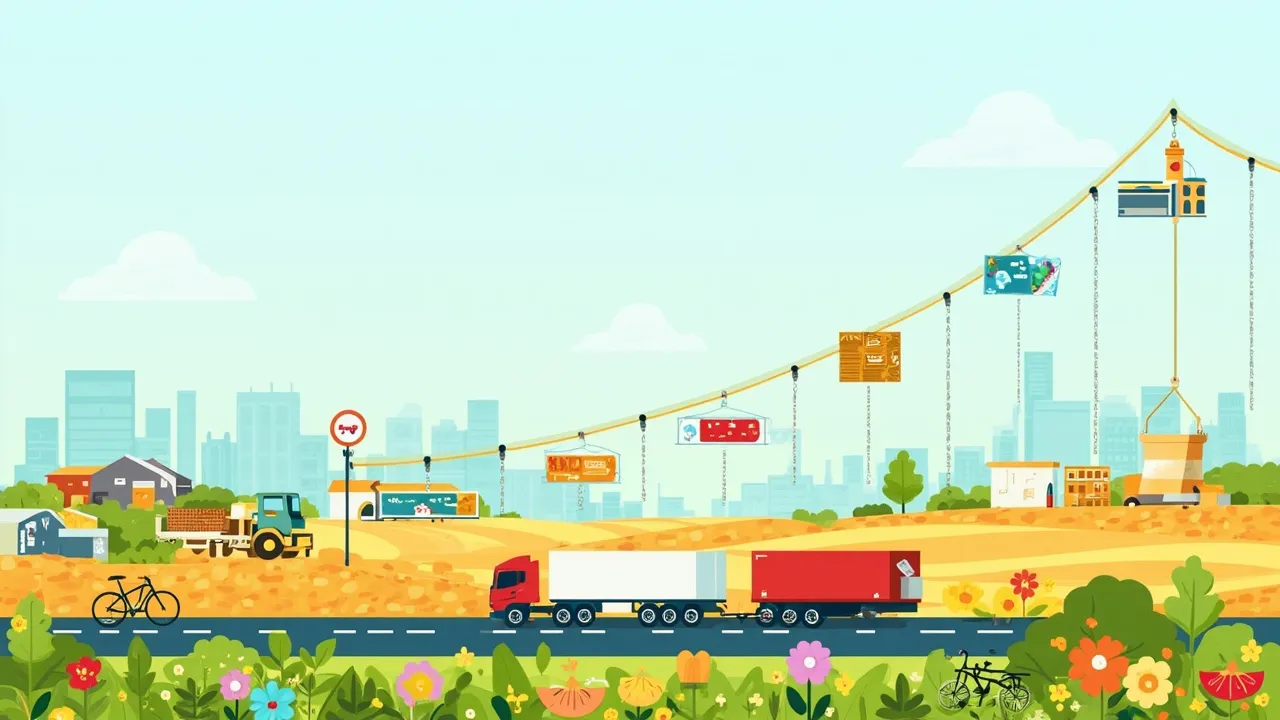
Inbound Logistics made a similar point in its discussion of fertilizer pressure behind food costs: agricultural inputs move through ports, rail terminals, barges, storage sites, cooperatives, distributors, and rural trucking networks before they affect crop economics. The article notes that fertilizer has represented 33% to 44% of corn operating costs and 34% to 45% of wheat operating costs since 2020, citing USDA data. That is not a grocery-store margin issue. It is an upstream logistics and input-availability issue that can surface months later as ingredient or finished-food cost pressure.
Concentration changes the logistics math
A concentrated retail market changes how suppliers think about service, risk, and negotiation. Large grocers can create efficiency through scale: fuller trucks, standardized packaging, consolidated distribution, and better forecasting signals. Those benefits are real.
But scale also creates access problems when the network becomes hard for smaller suppliers to enter. A regional food producer may have a strong product but struggle with chargebacks, appointment compliance, packaging requirements, electronic document standards, cold-chain proof, or the volume commitments needed to justify consistent transportation into a national distribution network.
That friction matters for competition. If the cost of reaching the shelf rises faster for smaller suppliers than for large incumbents, the market may look open in theory while remaining difficult in practice. Transportation minimums, distribution-center rules, late penalties, limited carrier coverage, and temperature-monitoring requirements can all become barriers to entry.
The same problem shows up geographically. Canada’s size makes food logistics inherently uneven. Serving dense corridors in Ontario or Quebec is different from serving Atlantic Canada, the Prairies, northern communities, or remote regions where distance, weather, backhaul scarcity, and limited carrier density can make cost-to-serve far higher. A national average grocery-price conversation can hide very different local logistics realities.
Regulators will need evidence, not anecdotes
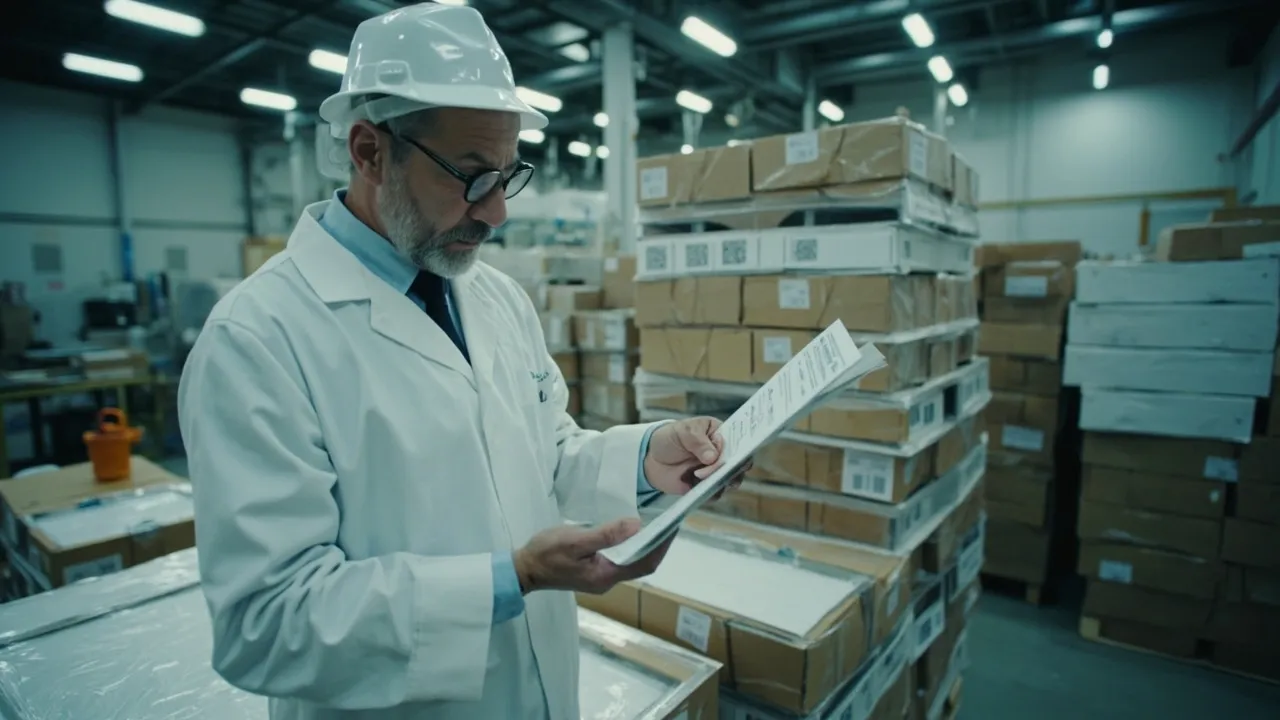
If food supply chain scrutiny increases, logistics teams will need cleaner operational records. Not because every company is doing something wrong, but because pricing pressure is hard to explain without evidence.
A credible record connects supplier performance, transportation cost, accessorials, temperature exceptions, missed appointments, claims, route changes, warehouse dwell time, inventory outages, and expedited freight. It also distinguishes between controllable execution failures and structural cost pressure: a carrier shortage, a port delay, a processing bottleneck, a weather event, or an input shortage upstream.
That distinction will matter commercially as much as it matters politically. Retailers will ask suppliers why costs increased. Suppliers will ask logistics teams why service degraded. Regulators may ask where competition is being constrained. Finance teams will ask which increases are temporary and which have become embedded in the network.
Without lane-level and order-level visibility, the answer often collapses into vague explanations: fuel went up, freight got tight, suppliers raised prices, inflation happened. That is not enough anymore.
What food logistics teams should do now
The practical response is not to build a regulatory war room. It is to make cost-to-serve and service performance visible enough that the business can explain itself.
Start with supplier lane performance. Which suppliers routinely require expedited freight? Which regions generate the most claims, spoilage, or appointment failures? Which carriers perform well on cold-chain moves, and which create exception patterns that become inventory or pricing problems later?
Then separate base freight from volatility. Fuel, accessorials, detention, lumper fees, reefer surcharges, cross-dock handling, and emergency replenishment should not sit inside one blended transportation number. When costs rise, teams need to know whether the issue is market rate, operational friction, poor planning, or structural network design.
Finally, preserve exception history. Food supply chains are full of one-off problems that become invisible after the invoice clears. A modern transportation management system should keep those exceptions tied to orders, suppliers, carriers, locations, and customers so leaders can see repeat patterns instead of arguing from memory.
Canada’s probe is a reminder that grocery inflation cannot be understood from the shelf backward only one step. The real story runs through farms, processors, warehouses, carriers, distribution centers, and the rules that govern access to each handoff.
CXTMS helps logistics teams make that story measurable. If your food or grocery network needs clearer cost-to-serve visibility, supplier lane performance tracking, and exception histories that can stand up to commercial or regulatory scrutiny, schedule a CXTMS demo and see how execution data becomes decision-ready evidence.