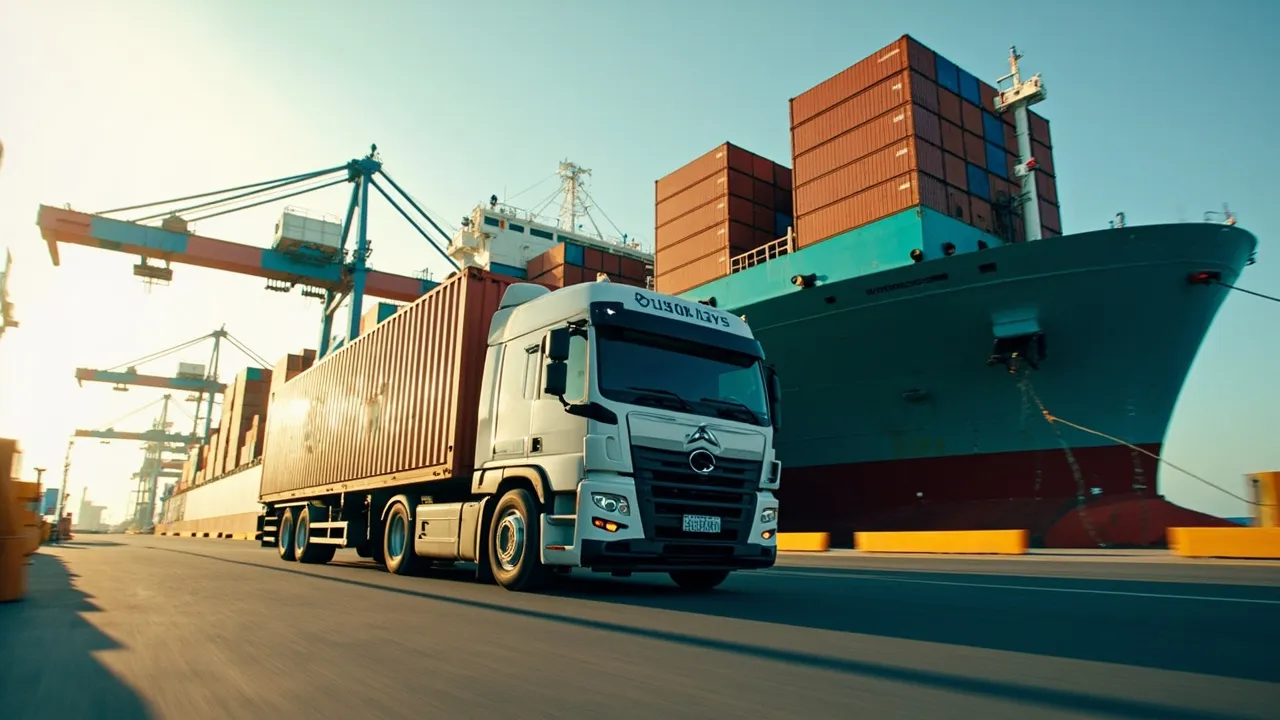
Port of New York and New Jersey's $39M ZEV Voucher Program: Build a Drayage Replacement Queue


The Port of New York and New Jersey is putting meaningful money behind zero-emission drayage. For fleet operators, however, the opportunity is not simply to submit a voucher application and buy whichever electric truck becomes available first. The real work is selecting the trucks, routes and charging plan that can deliver reliable port turns after the incentive is spent.
That requires a replacement queue: a ranked list of vehicle candidates connected to duty-cycle data, charger readiness, funding eligibility and expected delivery dates. Built correctly, the queue converts a public incentive into a disciplined fleet transition rather than a collection of disconnected purchases.
The incentive changes acquisition economics
Supply Chain Dive reports that the Port Authority plans to launch a $39 million zero-emission vehicle voucher program in fall 2026. Manufacturers will be selected on a rolling basis according to sign-ups. A separate $5 million Green Drayage Accelerator will support new charging hubs.
Those two pools address different constraints. The voucher reduces the capital hurdle for the truck. The charging investment addresses the infrastructure that makes the truck productive. Treating them as one coordinated operating decision is essential, especially because electric Class 8 equipment still carries a large price premium. FreightWaves reported in 2024 that a diesel day cab could start around $150,000 while a battery-electric model cost about $450,000—roughly three times as much.
The case for focusing on drayage is strong. Port routes are comparatively short and repeatable, with natural dwell periods at depots. Reuters has described drayage as particularly well suited to early truck electrification because predictable round trips can match available battery range and allow overnight yard charging. Locally, the emissions opportunity is significant: FreightWaves reported that drayage trucks account for 48% of the port's greenhouse-gas emissions.
Rank trucks by operational fit
Voucher availability should not determine replacement order by itself. Build a score for every candidate tractor using five operational inputs:
- Port moves: Prioritize tractors with high, consistent move counts. More productive assets spread the incentive and infrastructure cost across more revenue-generating trips.
- Remaining useful life: Retiring a reliable, recently purchased diesel unit may destroy value. Older vehicles nearing a planned replacement point usually produce a cleaner business case.
- Route length: Compare actual daily miles, detours and seasonal variation with usable range—not the manufacturer's ideal figure.
- Payload: Model energy consumption and legal payload under the fleet's real container weights. Battery weight and heavy loads can change assignment economics.
- Depot dwell: Identify where trucks park, for how long and whether those windows are predictable enough to recharge without delaying the next dispatch.
A simple 100-point score could allocate 25 points to annual port moves, 20 to replacement age, 20 to route suitability, 15 to payload fit and 20 to dependable charging dwell. Fleet managers should then apply hard exclusions for routes without sufficient range margin, trucks parked at sites without a viable power plan, or assignments where missed turns create unacceptable customer risk.
This approach may put a moderately utilized older truck ahead of the fleet's busiest tractor. That is sensible if the busiest unit runs variable long routes while the older truck repeats two short port-to-warehouse cycles and returns to the same depot every evening.
Make truck and charger timelines one plan
An approved voucher is not a charging strategy. Each proposed vehicle needs a readiness record linking four dates: voucher eligibility, purchase commitment, vehicle delivery and charger energization. Add utility interconnection, permitting, civil works and charger commissioning milestones where applicable.
The go-live date should be the latest credible date across the entire chain, not the promised truck-delivery date. If a vehicle arrives before its depot can charge it, the fleet ties up capital or relies on public charging that may be unavailable, inconvenient or priced differently from the business case.
Dispatch data supplies the reality check. Use historical trips to group tractors by origin, destination, miles, container weight, terminal dwell and depot return time. Then simulate the proposed charging window against the next day's assignments. Preserve at least one fallback rule: a diesel substitute, an approved public charger, or a route reassignment threshold when state of charge falls below plan.
In CXTMS, fleets can connect the replacement candidate to asset records, recurring lanes and dispatch history. Voucher documentation, charger location, delivery milestones and exceptions can then live alongside the transportation operation they affect rather than in a separate spreadsheet.
Measure outcomes per move
Before the first electric truck enters service, freeze a 60- to 90-day diesel baseline. Compare the new operation against the same lanes and similar container profiles using four measures:
- Cost per completed move: Include vehicle payment, energy, maintenance, driver time, tolls, charging fees and any substitute-tractor cost.
- Charger utilization: Track occupied charging hours, energy delivered, queue time and downtime by connector.
- Missed turns: Count assignments missed or reassigned because of range, charger availability, charging duration or equipment faults.
- Emissions evidence: Retain vehicle miles, energy consumed, grid assumptions and the corresponding diesel baseline so reported reductions are auditable.
The denominator matters. Total energy cost can look favorable while missed turns quietly increase. Cost per successful port move reveals whether the new operating model is actually working. Charger utilization also needs context: very low use may signal stranded infrastructure, while near-constant use may leave no resilience for late returns or maintenance.
Review results weekly during the first 90 days. If missed turns rise above the diesel baseline, diagnose whether the cause is route assignment, charging schedule, infrastructure uptime or driver workflow before adding more vehicles. If performance holds, promote the next compatible tractor in the replacement queue.
Turn a voucher into a repeatable transition
The Port Authority's $39 million vehicle program and $5 million charging investment can narrow the financial gap, but incentives do not remove execution risk. Fleets that rank assets with operating data, synchronize truck and charger milestones, and measure results per completed move will be positioned to scale electrification without sacrificing port productivity.
CXTMS gives forwarders and drayage operators one place to connect fleet assets, dispatch decisions, route performance and compliance evidence. Request a CXTMS demo to build a more controlled path from voucher approval to reliable zero-emission moves.