Warehouse Leasing Is Normalizing: Recalculate the Cost of Flexible Overflow Space


The warehouse market is moving out of its post-pandemic correction, but that does not automatically make a long lease the right answer. Capacity planners now face a more useful question: at what sustained level of demand does flexible overflow become more expensive than a permanent node?
The latest market indicators show the supply-demand gap closing. Inbound Logistics reports that U.S. industrial leasing activity reached 490.6 million square feet in the first half of 2026, up 27.1% year over year and the strongest first half since the 2021-2022 boom. Logistics Management, citing Prologis, reported that vacancy had declined 10 basis points to 7.4% as demand began to exceed new supply, with recovery expected to continue through 2026.
That is normalization, not a return to emergency conditions. Shippers should use the current window to rebuild their capacity economics before rents, labor constraints, or customer commitments force a rushed decision.
Compare capacity on a fully loaded basis
A quoted storage rate is not a comparable cost. Every option changes transportation, handling, systems work, and service risk. Build a cost per usable pallet-position-month or order-month that includes all consequences.
Fixed lease. Include base rent, common-area and property charges, utilities, security, material-handling equipment, racking, insurance, systems, maintenance, management, and labor. Add the cost of unused positions during slow months and amortize startup and exit costs across the expected term.
Shared or public warehousing. Include minimum monthly charges, storage, inbound and outbound handling, order fees, value-added services, integration, and account management. The unit rate may look high, but the shipper avoids paying for empty space and can often enter or leave faster.
Pop-up capacity. Add temporary labor premiums, short-term equipment rental, portable connectivity, site setup, inventory counts, and management travel. Pop-ups can work for a defined peak, but frequent launches and shutdowns create recurring transition costs.
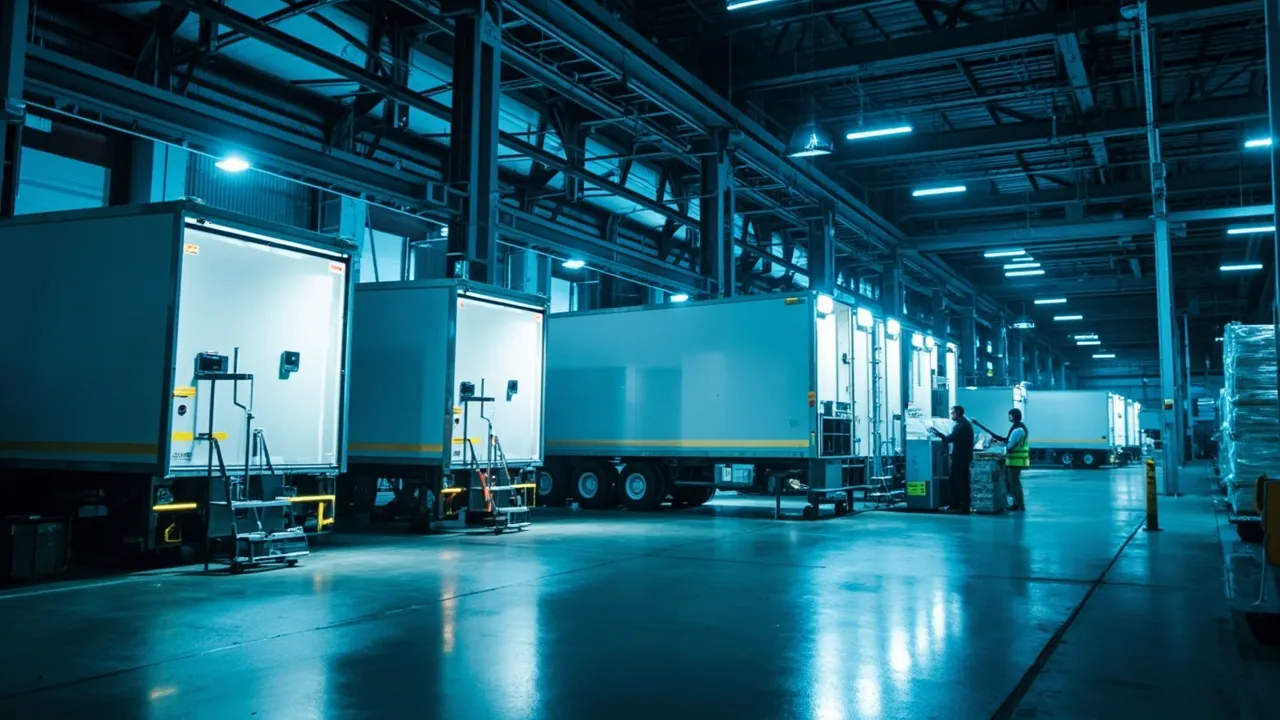
Trailer storage. Count trailer rental, yard rent, spotting, detention, shunting labor, weather exposure, product damage, and the time spent locating inventory. A trailer may be cheap as static cubic capacity and expensive as an active picking location.
Outsourced overflow fulfillment. Include storage and handling plus order processing, packaging, parcel or LTL rates, returns, technology fees, and service-level penalties. It can preserve customer cutoffs during a surge, but fragmented inventory may increase split shipments and make network-wide stock harder to control.
For each option, calculate:
Fully loaded monthly cost = fixed facility cost + variable handling + incremental transport + labor premium + systems/admin + expected service failure cost
Use the same volume forecast, inventory turns, order profile, and service promise for every scenario. Otherwise, the comparison is theater.
Model the transport and labor consequences
Overflow space is never just storage. Its location changes drayage, transfer miles, delivery zones, and cutoff times. A remote building with a low rate can create two extra touches and a daily transfer shuttle. If an import container must be drayed past the primary DC and freight later returned toward the customer, cheap square footage can raise total landed cost.
Map every expected movement: port or supplier to overflow, overflow to the primary facility, and overflow to the customer. Apply real load factors rather than assuming every transfer runs full. Include empty repositioning, tolls, fuel, driver time, appointments, and detention.
Labor deserves the same scrutiny. A facility is not capacity until trained workers can receive, locate, pick, and ship inventory. Compare local wage rates, agency markups, overtime, supervisor coverage, training time, and expected productivity. Shared warehouses may charge more per transaction while giving a shipper access to a pooled workforce that would be difficult to recruit for a short peak.
Customer cutoff times can decide the result. Measure whether inventory at each candidate site can still make carrier collection, store replenishment, or next-day parcel promises. The expected cost of missed cutoffs, expedites, cancellations, and chargebacks belongs in the model.
Protect inventory accuracy across locations
Temporary space tends to create permanent data problems when teams manage it through emailed spreadsheets. Every overflow site needs a defined facility code, bin structure, inventory owner, status rules, cycle-count schedule, and transaction feed. Receipts, transfers, holds, picks, and adjustments should update the same operational record used by transportation and customer-service teams.
Track accuracy by site and by transaction type. A low storage price loses its appeal if teams cannot confirm where sellable inventory sits or whether it can meet an order promise. CXTMS can connect transfer movements, appointments, milestones, documents, and exceptions to the shipment record, giving planners the evidence needed to judge the real performance of an overflow strategy.
Set a threshold for converting to a permanent node
Do not approve a permanent facility because one peak month made overflow look expensive. Use a demand threshold and a persistence rule.
First, calculate the permanent node's monthly fixed cost, including amortized startup costs. Then estimate its variable cost per pallet or order. Compare that with the flexible option's variable rate and any transport savings created by the permanent location.
Break-even volume = permanent monthly fixed cost / (flexible unit cost - permanent variable unit cost + permanent transport savings per unit)
Suppose a permanent node costs $180,000 per month, including amortized setup. Its variable operating cost is $9 per pallet-month, while flexible overflow costs $25. If the permanent node also saves $4 per pallet in transfers and outbound transportation, the contribution advantage is $20 per pallet. Break-even demand is 9,000 pallet-months.
The arithmetic is only the first gate. Require forecast demand to remain above the threshold for a defined period—often two planning seasons or 9 to 12 months—and stress-test downside volume. Also require acceptable labor availability, customer service coverage, inventory accuracy, and exit flexibility. A permanent node should survive a reasonable forecast error, not merely the base case.
Turn normalization into an operating advantage
Market recovery creates urgency, but not permission to skip analysis. Review overflow economics monthly, keep flexible capacity where volatility is high, and convert it only when sustained demand and network savings support the commitment. The winning choice is not the lowest rent; it is the capacity model that protects cost, control, and customer promises together.
Ready to compare warehouse scenarios using shipment-level transportation and exception data? Request a CXTMS demo and build a capacity plan around the true cost of execution.