Averitt's 100,000-Square-Foot Jackson Facility: Test a New Node Before Moving Volume

A new distribution node looks compelling on a map. It may shorten final-mile distance, create later order cutoffs, and give shippers another place to hold inventory. But a dot on a network diagram does not prove that the node will lower total cost or improve customer service.
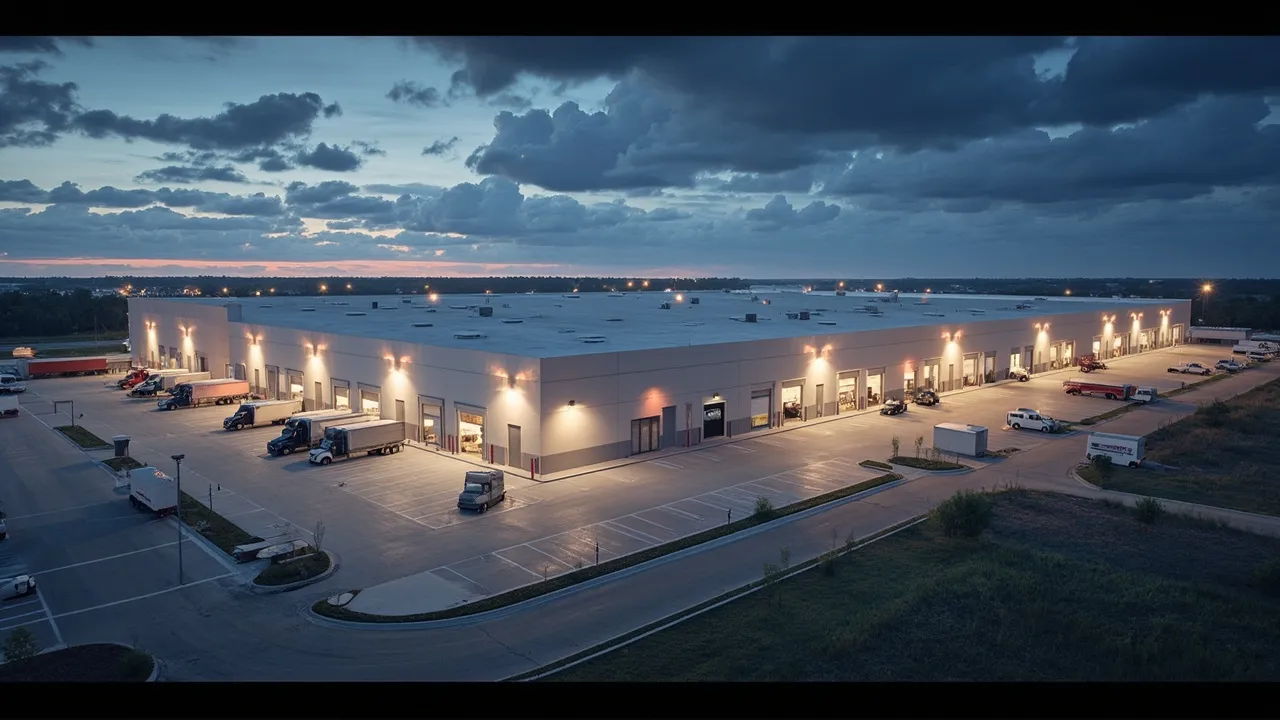
Averitt's new 100,000-square-foot distribution and fulfillment facility in Jackson, Mississippi, creates exactly this kind of opportunity. The right response is not to shift a large block of volume immediately. It is to run a controlled test that compares actual shipment outcomes with the current network baseline.
Start with what the new facility actually changes
FreightWaves reports that Averitt opened the 100,000-square-foot Jackson facility as part of a broader expansion. The carrier has announced plans to add 900,000 square feet of warehouse space, 379 dock doors, and 2,000 truck parking spaces across its network by 2027. It also opened a 33-door facility in Tulsa in June.
Those figures establish scale, but they do not establish the business case for an individual shipper. Jackson could improve access to customers in Mississippi and surrounding markets, consolidate regional LTL flows, or support distribution and fulfillment closer to demand. Whether it does so profitably depends on the shipper's origins, order profile, customer locations, service promises, and inventory economics.
The first analysis should therefore compare the proposed Jackson flow with the current routing at the shipment level. Measure origin-to-node mileage, node-to-customer mileage, transit schedules, carrier cutoff times, minimum charges, fuel, accessorials, and expected handling. A shorter final leg can still lose money if it requires an inefficient inbound replenishment lane or adds another touch.
Establish the baseline before the pilot
A node test needs a clean control period. Use at least several representative weeks of current shipments and preserve seasonality, weekday mix, customer class, product type, weight, cube, and service level. The baseline should include total delivered cost—not merely the linehaul rate.
Track cost per shipment, cost per hundredweight, cost per order, on-time pickup, on-time delivery, damage, claims, detention, redelivery, dwell, and exception frequency. For fulfillment flows, add order-cycle time, pick accuracy, dock-to-stock time, inventory turns, split shipments, and the percentage of orders shipped complete.
This broader view matters because network expansion creates a genuine tradeoff. Inbound Logistics explains that transportation costs tend to decline as warehouses are added, because more freight can move efficiently inbound and shorter distances outbound. Inventory costs, however, rise as the network expands. The new node earns volume only if transportation and service gains exceed the cost of duplicated safety stock, space, labor, handling, and working capital.
Select lanes that can produce a clear answer
Do not begin with every Mississippi-bound shipment. Choose a narrow set of origin-destination pairs with enough weekly density to measure and with customers whose receiving patterns are understood. A useful pilot group might contain repeat LTL shipments to central and southern Mississippi, paired with a similar control group that continues through the incumbent node.
Before launch, state the hypothesis in numbers. For example: Jackson should reduce average final-mile distance by a defined percentage, improve on-time delivery by two percentage points, or lower fully allocated cost per order without increasing damage or inventory days. These are test thresholds, not promises about the facility.
Keep the initial product set simple. Favor predictable, faster-moving SKUs that can support replenishment in economic quantities. Avoid introducing highly seasonal, slow-moving, regulated, or unusual-handling inventory until the operating process is stable. The pilot should reveal what the node changes, not bury the signal under exceptional freight.
Treat cutoff time as an operating variable
A nearby facility can create value through time as well as distance. Document the final order-release cutoff for same-day processing, the carrier's pickup window, trailer-close time, linehaul departure, arrival appointment, and customer receiving hours. Then compare the complete event chain with the current route.
A later order cutoff is valuable only if freight still makes the planned departure. Likewise, a nominal one-day transit improvement is not real if orders wait overnight for consolidation or miss a customer's receiving window. Capture timestamps from order release through proof of delivery and separate carrier transit from warehouse dwell.
Site evaluation should also extend beyond mileage. Inbound Logistics notes that one site-selection consultancy examines more than 70 variables, including transportation access, building configuration, operating costs, labor availability, and business climate. A shipment pilot cannot answer every strategic question, but it can expose whether labor schedules, dock capacity, yard operations, and linehaul timing support the modeled service.
Put inventory duplication under a hard limit
The easiest way to make a new node look successful is to overstock it. High availability improves service during a short trial while hiding the cost of excess inventory. Set explicit limits for days of supply, safety stock, SKU count, and replenishment quantity before the first transfer.
Measure inventory used to generate each service improvement. If Jackson saves a day in transit but requires materially more safety stock across the network, calculate the carrying cost and obsolescence exposure. Track transfers between nodes as their own cost category; emergency rebalancing is evidence that placement rules need work, not free inventory movement.
A phased approach controls this risk. Phase one can use cross-dock or flow-through freight with little stored inventory. Phase two can position a limited group of high-velocity SKUs. Only after demand and replenishment behavior are visible should the shipper consider a broader assortment.
Make the volume decision with shipment evidence
Review the pilot weekly, but do not change the scorecard whenever results disappoint. Compare the test and control groups, isolate weather or customer-caused exceptions, and calculate confidence over a representative period. Record why each shipment missed cost or service targets.
The final decision should fall into one of three categories: expand, adjust and retest, or return volume to the existing flow. Expand when the node clears the predefined cost and service thresholds without exceeding inventory limits. Retest when a fixable process issue—such as an early cutoff or poor SKU placement—distorts otherwise promising results. Exit when savings exist only in a narrow rate comparison or depend on persistent overstocking.
CXTMS gives logistics teams the shipment-level cost, milestone, carrier, and exception data needed to compare a new node with the incumbent network. Request a CXTMS demo to build a controlled network pilot and turn facility expansion into an evidence-based volume decision.