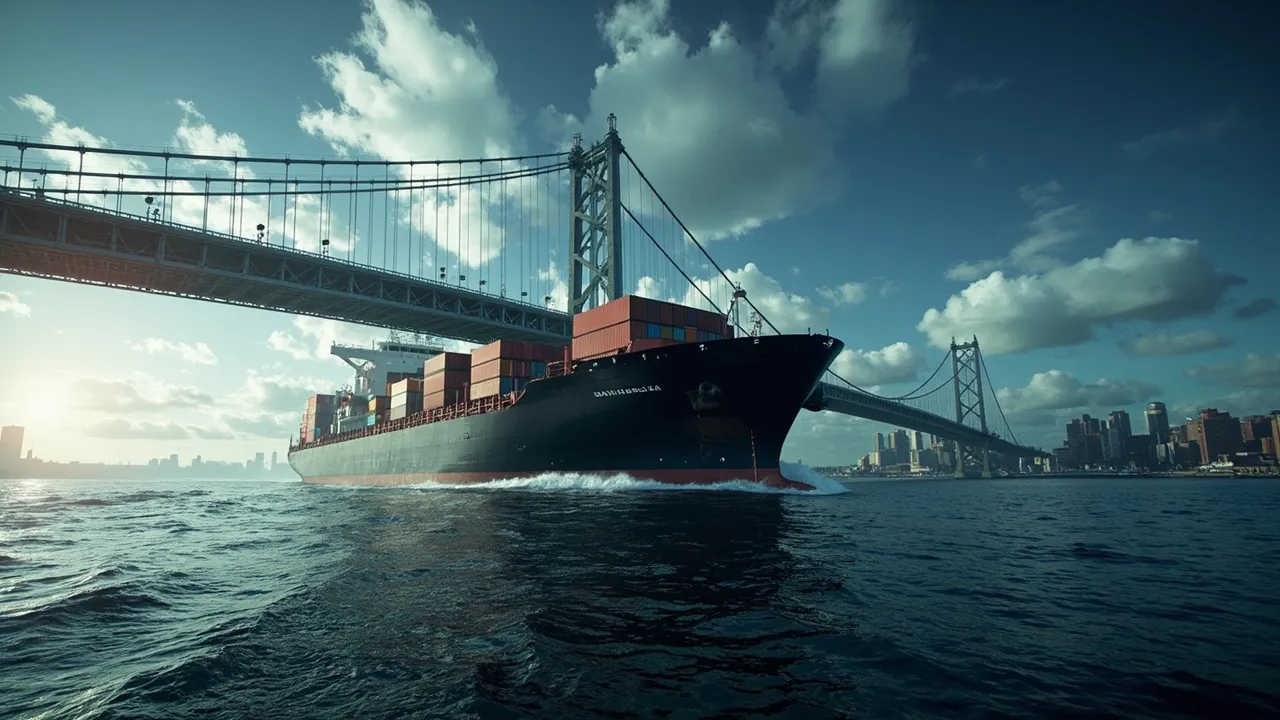
U.S.-Bound Container Imports Fell for a 12th Month. The Planning Risk Is Mix, Not Just Volume.

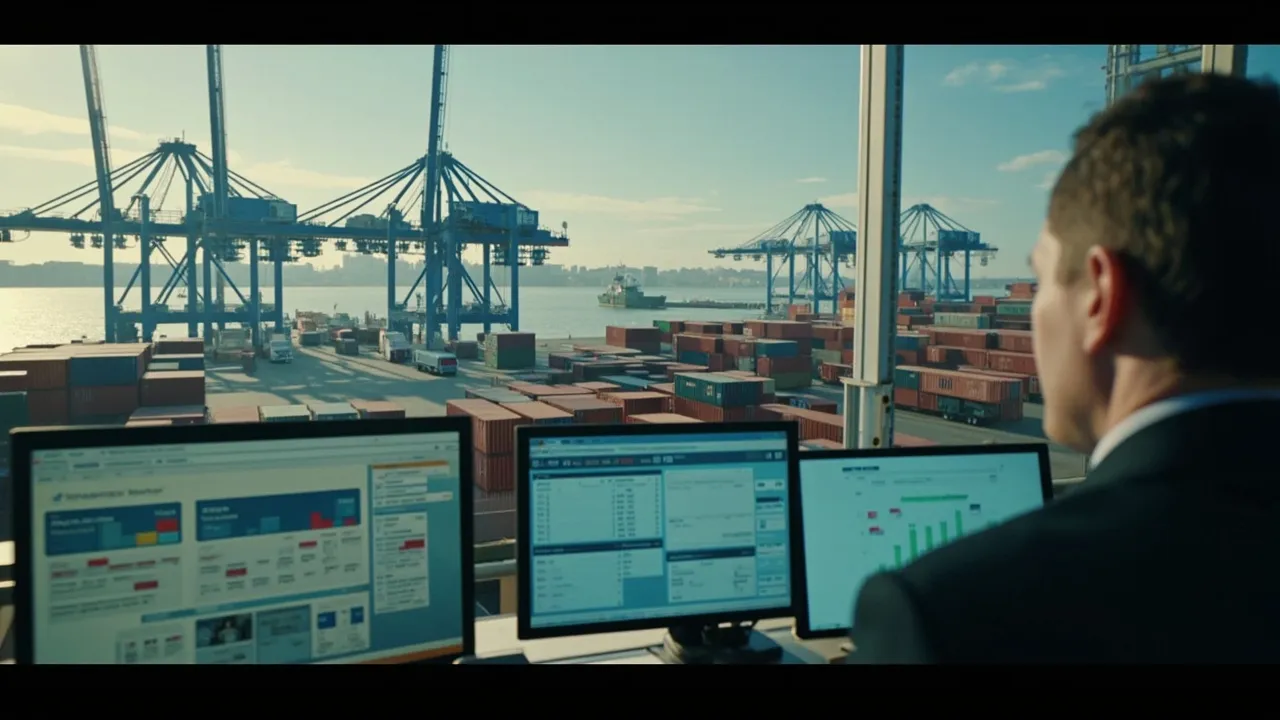
A lower TEU count is not the full story. The mix inside those boxes is where the operational risk lives.
U.S.-bound containerized freight imports fell for a 12th consecutive month in April, according to Logistics Management’s report on S&P Global Market Intelligence data. Imports totaled roughly 2.635 million TEU, down 5.2% year over year. That was a sharper decline than March’s 0.4% annual drop, and it came with weakness in several categories that matter far beyond the port gate.
The headline says demand is soft. The operating reality is more complicated. Materials, capital goods, consumer durables, and auto parts all moved differently. For freight forwarders, brokers, importers, and drayage providers, aggregate ocean volume is a useful signal — but a dangerous planning shortcut.
The April decline was broad, but not uniform
S&P Global Market Intelligence data cited by Logistics Management showed several category-level declines in April:
- Metals: down 12.9% year over year
- Capital goods: down 28.9%
- Consumer durables: down 6.5%
- Auto parts: down 16.4%
That split matters. A 5.2% total decline can look manageable on a dashboard. A nearly 29% decline in capital goods tells a different story about industrial investment, plant projects, equipment demand, and manufacturing confidence.
Materials weakness also has a second-order effect. S&P Global’s Chris Rogers noted that recent gains in U.S. new manufacturing orders could reverse some of the declines in materials and capital goods. In plain English: if manufacturing demand firms up, the categories currently dragging import volume lower could snap back faster than a broad TEU forecast suggests.
That is why forwarders should not treat April as a simple capacity-relief story. Lower inbound volume may reduce congestion pressure, but it can simply shift the risk to timing, allocation, and readiness.
Peak season is still coming — just unevenly
Consumer-goods freight is behaving differently from industrial freight. Logistics Management reported that peak shipments for consumer goods, including apparel, are expected to increase heading into June, with the historical arrival peak landing in the August-to-October window after goods leave Asian factories from late June onward.
That seasonal pattern has not disappeared. What has changed is the confidence behind it.
Supply Chain Dive reported that some U.S. shippers are delaying long-term ocean contract signing amid uncertainty, leaving more containers exposed to the spot market in the near term. The same report cited National Retail Federation and Hackett Associates projections that June U.S. ocean import volumes would be 2% lower than May, followed by a 4% month-over-month increase in July.
That is a messy planning environment: soft annual comparisons, tactical peak-season builds, contract hesitancy, and carrier efforts to defend spot rates. The better question is not whether peak season is strong or weak. It is where peak season concentrates.
Commodity mix should drive the plan
Ocean planning still often starts with aggregate volume: how many boxes, which port pair, which carrier allocation, which rate. That is not enough now.
Commodity mix changes the downstream workflow. Metals and petrochemicals affect packaging, manufacturing, and industrial inventory. Auto parts have different production-window consequences than apparel. Consumer durables create retail replenishment pressure but may also face tariff timing effects. Capital goods often need tighter project coordination, special handling, or delivery sequencing.
Those differences influence booking lead times, transload requirements, chassis availability, customs documentation, inland mode choice, warehouse labor, and exception thresholds.
A shipment of apparel front-loaded before a seasonal sales window is not operationally equivalent to machinery tied to a factory installation schedule. Both may be one container in a TEU report. They are not one container in execution.
Origin shifts can hide inside the same TEU number
April’s data also points to origin risk. Logistics Management reported that direct imports from the Middle East fell 28.5% year over year, while S&P Global warned that a continued surge in shipping from ASEAN could reverse if materials shortages bite.
That is a major planning clue. A decline from one origin and growth from another can leave total import volume looking stable enough, while completely changing sailing schedules, transshipment exposure, documentation requirements, drayage timing, and inland arrival patterns.
Forwarders should be watching origin-level changes alongside commodity mix. If ASEAN volumes soften because upstream materials tighten, importers may need alternate sourcing, different booking windows, or faster escalation when suppliers miss cutoffs. If Middle East-linked materials remain constrained, packaging and industrial inputs may create downstream delays that show up far from the original lane.
Mode conversion needs trigger points, not panic
When ocean uncertainty rises, the instinct is to ask what should move by air, rail, intermodal, or truck. That question is useful only if teams define trigger points before the exception hits.
The trigger should not be “the shipment is late.” Better triggers include factory-ready dates slipping past vessel cutoffs, tariff deadlines approaching, customer penalties exceeding premium freight cost, production-shutdown risk rising, port dwell exceeding the recovery window, or inventory coverage dropping below the next replenishment cycle.
This is where a transportation management system has to do more than tender freight. It should connect demand signals, ocean bookings, purchase orders, customs readiness, carrier performance, and inland execution so planners can see conversion options early.
The CXTMS view: import planning has to be connected
The lesson from April is not “imports are down, relax.” That is the lazy read.
The better read is that import planning is becoming more category-specific, more origin-sensitive, and more deadline-driven. Aggregate TEU counts still matter, but they are only the first layer. The real planning work happens when teams connect what is inside the container to when it is needed, where it enters, how it clears, and what happens next.
For freight forwarders and logistics teams, that means the import workflow should not live across disconnected spreadsheets, booking portals, inboxes, and customs documents. It needs one operating layer where demand, ocean bookings, drayage, customs milestones, and exception triggers can be managed together.
That is exactly the kind of discipline CXTMS is built to support. When volume signals are mixed and peak season is uneven, the winners are not the teams with the prettiest forecast. They are the teams that can see risk early, coordinate across partners, and execute without guessing.
If your team needs better control over ocean imports, drayage coordination, customs readiness, and mode-conversion decisions, book a CXTMS demo and see how connected logistics execution turns volatile freight data into cleaner decisions.