Freight Moves $68 Billion a Day: Turn the 2026 National Freight Plan Into a Facility Risk Map


The United States freight system is so large that national statistics can feel abstract. The 2026 National Freight Strategic Plan puts the scale in sharper terms: more than 54 million tons of goods worth over $68 billion move through the network every day. For a shipper, however, the useful question is not whether the national network is important. It is which specific bridge, port gate, border crossing, rail ramp, or highway interchange can interrupt tomorrow's orders.
That is why the plan should become an operating input—not a document filed under government affairs. A facility risk map translates public infrastructure priorities into the lanes and nodes that determine service, inventory, and revenue.
Start With the Network Behind the Headline
Logistics Management reports that the 2026 plan is a multi-year roadmap aimed at freight bottlenecks across a system moving more than 54 million tons and $68 billion in goods daily. Another Logistics Management analysis describes the national cargo network as nearly seven million miles and notes a proposed five-year, $580 billion highway bill moving through Congress.
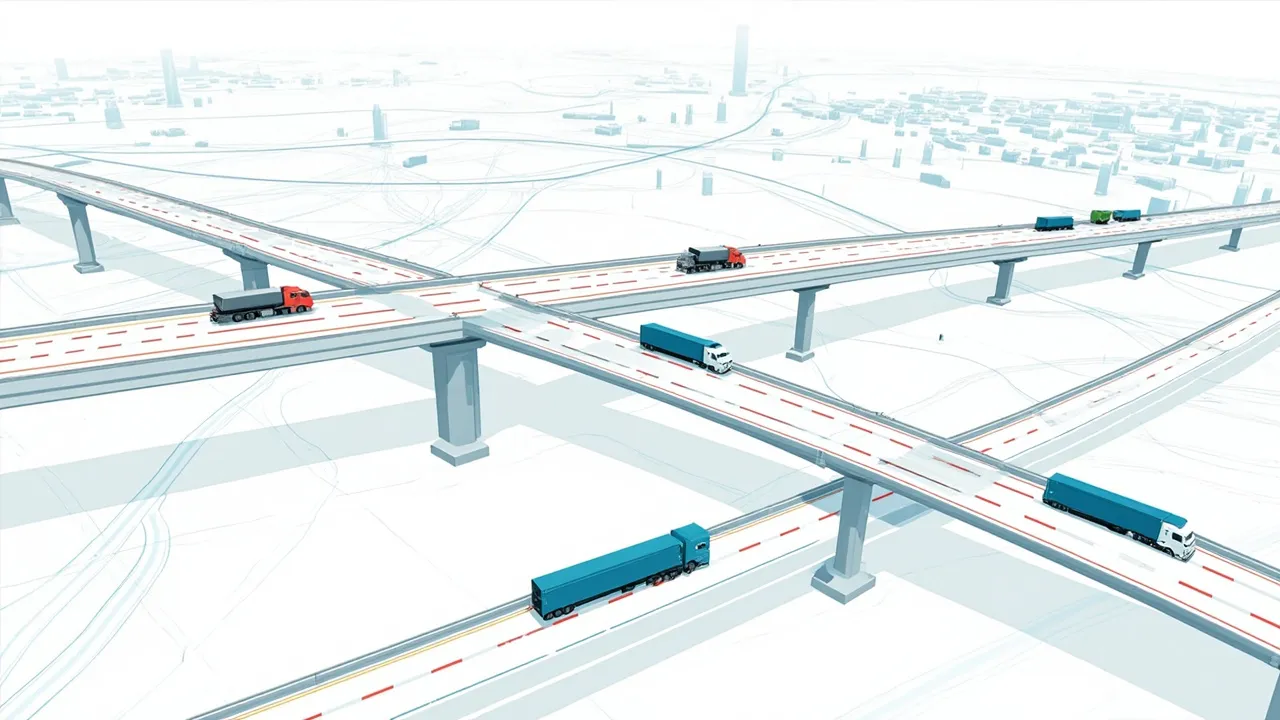
Those numbers describe system scale, but they do not rank a company's exposure. Two distribution centers may both sit beside an interstate while carrying radically different risk. One may have three practical approaches and a nearby intermodal substitute. The other may depend on a single weight-restricted bridge and a congested urban junction.
The first job is therefore dependency discovery. For every plant, warehouse, cross-dock, store cluster, port, and supplier origin, identify the public assets that freight must traverse. Include access roads, bridges, tunnels, mountain passes, rail ramps, locks, port gates, border crossings, and airports. Then connect each asset to actual shipment records rather than relying on a generic network drawing.
Build a Facility-Level Exposure Score
A useful risk score should combine consequence with recoverability. Begin with five factors, each scored on a consistent scale:
- Freight volume: weekly loads, tons, pallets, or containers exposed to the asset.
- Value and service criticality: shipment value plus the cost of missing a customer promise or production window.
- Dependency concentration: the share of a facility's flows that use the same public asset.
- Alternative-route penalty: extra miles, hours, tolls, permits, mode changes, or equipment constraints when the asset is unavailable.
- Recovery time: how long the operation can tolerate disruption before inventory, labor, or customer commitments fail.
A simple model can multiply probability by operational impact, then increase the result where alternatives are weak. Precision is less important than consistency. The score must make a vulnerable $5 million weekly lane rank above a low-volume road merely because the latter appeared in a government announcement.
Do not stop at facilities. Score important origin-destination lanes and the shared assets between them. Ten seemingly diversified suppliers can still create one concentrated risk if every inbound shipment crosses the same bridge or enters through the same port complex.
Connect Public Priorities to Private Operations
The national plan highlights where government attention and capital may move, but an announced priority is not completed capacity. Each relevant project needs its own status: proposed, funded, permitted, under construction, restricted, or operational.
Public work can reduce long-term risk while increasing short-term variability. Lane closures, detours, reduced bridge clearances, nighttime gate schedules, and construction queues can all affect service before a project delivers benefits. The risk map should therefore store both the expected improvement and the temporary operating constraint.
It should also distinguish asset types. A bridge failure may add predictable road miles. A port restriction can alter vessel calls, drayage capacity, appointment availability, and container dwell simultaneously. A border disruption may introduce documentation and inspection delays that a geographic detour alone cannot solve.
This is where a transportation management system earns its place. Shipment history reveals which assets support the highest volume, which carriers have used viable alternatives, and what those alternatives actually cost. Planned loads can then be checked against active restrictions before dispatch rather than after a missed appointment.
Pre-Approve Alternatives Before Disruption
An alternate route is not real until operations can execute it. For every high-risk dependency, record a primary and secondary response. Validate carrier coverage, equipment compatibility, operating hours, permits, fuel availability, toll exposure, and customer appointment implications.
The same principle applies to modes. SupplyChainBrain recommends diversifying transportation modes and exploring alternative routes as infrastructure faces flooding, heat, and other pressures. But mode flexibility requires more than naming rail or air as a backup. Teams need known ramps or airports, contracted capacity, packaging requirements, lead-time assumptions, and decision thresholds.
Create triggers that convert the map into action. Examples include a bridge weight restriction affecting an assigned vehicle, construction delay exceeding two hours, port dwell crossing a defined threshold, or a project milestone slipping beyond the inventory buffer. Assign an owner and response time to every trigger.
Establish a Practical Review Cadence
Infrastructure risk changes more slowly than a spot market but faster than an annual network design. Use a tiered cadence:
- Review alerts, closures, restrictions, and severe weather weekly for critical assets.
- Review grants, permits, construction milestones, and official project schedules monthly.
- Recalculate exposure quarterly using current shipment volume, value, carrier performance, and recovery-time assumptions.
- Run a full network challenge annually, including route tests and a cross-functional disruption exercise.
Procurement, transportation, facilities, inventory, and customer service should share the same view. A detour that looks acceptable to transportation may exhaust safety stock or violate a customer delivery window. Likewise, a facility team may know about access-road construction before lane planners see its network effect.
The 2026 National Freight Strategic Plan is valuable because it frames freight infrastructure as an economic system. Its real operational value emerges when a shipper brings that view down to individual dependencies, quantifies exposure, validates alternatives, and monitors change. At $68 billion moving each day, infrastructure risk is not background noise. It is a measurable input to every reliable freight plan.
Ready to connect infrastructure exposure with live shipment planning? Request a CXTMS demo and see how your team can turn network risk into earlier, better transportation decisions.