Maersk's $100M Massachusetts Hub Makes Anchor-Customer Exit Risk a Facility KPI


Maersk's new fulfillment hub in Hopedale, Massachusetts, is an impressive piece of logistics infrastructure. It is also a clear lesson in customer concentration risk.
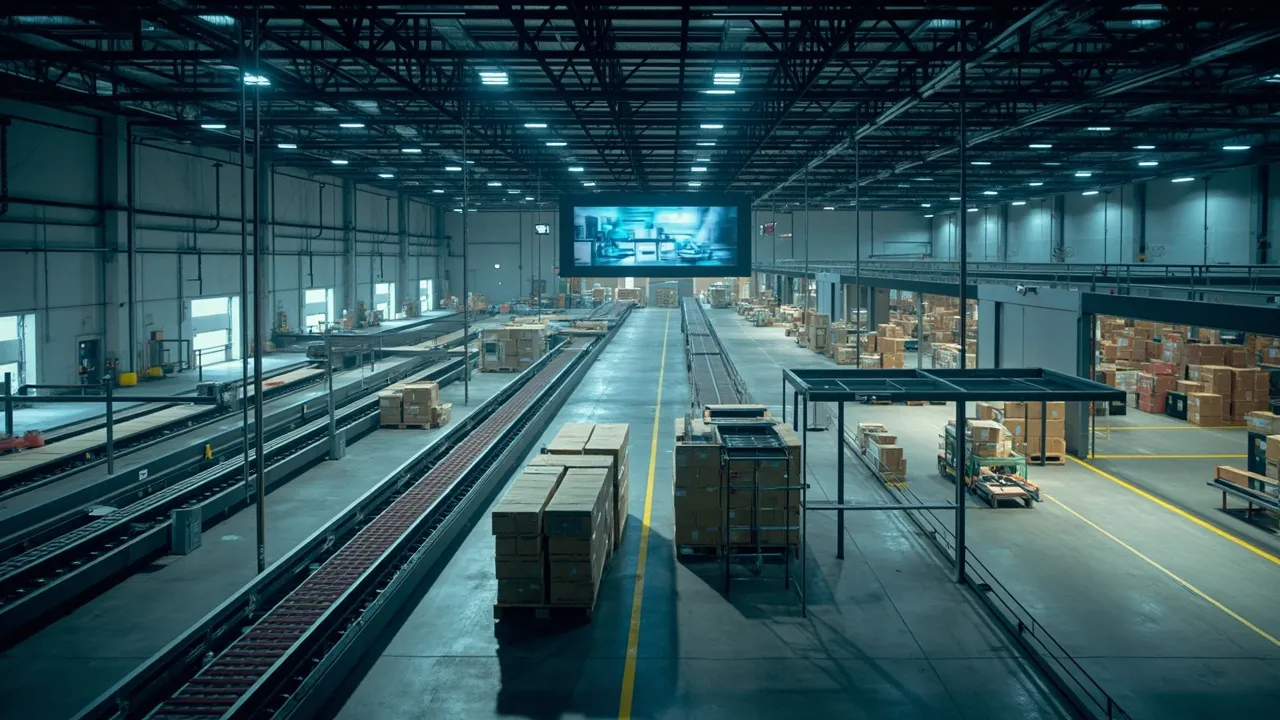
The 617,000-square-foot facility represents a $100 million investment and is scheduled to open in late August. It is expected to add roughly 1,000 jobs and process as many as 330,000 units per day at peak capacity. But the most strategically important detail is not its size or throughput. The operation was designed to serve one undisclosed large-scale e-commerce customer.
Supply Chain Dive reports that the site's conveyor and sortation technology was co-designed with that customer. That alignment can produce excellent service while volumes are strong and the contract is secure. It can also make a customer exit, volume reduction, or network redesign much harder to absorb.
For any single-customer facility, anchor-customer resilience should therefore become a measurable facility KPI—not a risk discussed only during contract renewal.
Scale Magnifies Both Efficiency and Exposure
The economics of a dedicated fulfillment center are attractive. Consistent product profiles support tuned automation, repeatable labor standards, predictable carrier schedules, and tightly configured inventory flows. The building can be optimized around the customer's order patterns instead of accommodating a broad mix of operating requirements.
At Hopedale, peak capacity of 330,000 units per day translates to more than half a unit of daily peak throughput for every square foot of building space. That is a useful indicator of the density and speed expected from the operation, even though actual daily volume will vary.
The same specialization creates exposure. If the anchor customer moves inventory elsewhere, insources fulfillment, changes its service area, or experiences a sustained demand decline, the operator cannot assume another account will fit the building immediately. Conveyor logic, storage media, workstations, packaging equipment, labor skills, dock schedules, and transportation lanes may all reflect the original customer's profile.
The issue is not whether a dedicated building is inherently too risky. It is whether management can see the risk early enough to protect the asset.
Four Metrics Belong on the Facility Scorecard
1. Effective utilization
Headline utilization should not be based only on occupied square footage. A facility can look full while its automation, labor, and outbound doors remain underused.
Operators should measure storage occupancy, units processed versus engineered capacity, labor hours versus planned hours, and dock turns together. The most revealing measure is effective utilization: the share of practical facility capacity consumed by profitable, service-compliant volume.
That figure should be tracked daily and by shift. A decline in orders may first appear as fewer conveyor hours or incomplete outbound waves, long before it becomes obvious in monthly financial reporting.
2. Contract runway
Contract runway is the time remaining before an anchor customer can reduce volume, terminate, or materially renegotiate its commitment. It should be displayed alongside forecast volume and fixed-cost exposure.
A facility with 24 months of contractual protection has a different risk profile from an identical building with six months remaining. Renewal milestones, notice periods, minimum-volume commitments, capital-recovery clauses, and early-termination protections should feed a common countdown. When runway crosses a defined threshold, commercial teams should begin alternate-customer qualification—not wait for a non-renewal notice.
3. Labor flexibility
Logistics Management says the Hopedale investment will add about 1,000 jobs. That workforce is a major operating capability and a significant fixed or semi-variable commitment.
Labor flexibility should measure how quickly staffing can move across functions and volume levels without damaging safety or service. Useful indicators include the percentage of employees cross-trained for multiple work areas, overtime dependence, temporary-labor lead time, training hours required for a new product profile, and the gap between scheduled and productive hours.
This is not simply a cost-cutting metric. A cross-trained workforce makes the facility more marketable to a second customer and reduces onboarding time if the anchor account changes.
4. Alternate-customer onboarding time
The final metric asks a blunt question: how many days would it take to put a compatible new customer into production?
The answer requires more than an available-sales pipeline. It should include systems integration, slotting, equipment changes, compliance review, hiring or retraining, carrier procurement, packaging setup, and test-order validation. Management should estimate onboarding time for several customer archetypes and refresh those scenarios as the facility changes.
If every plausible replacement requires a nine-month retrofit, the building has more concentration risk than its contract coverage alone suggests.
Transportation Data Is the Early-Warning Layer
Warehouse metrics describe what is happening inside the facility. Transportation data shows whether the node can work as part of a broader multi-client network.
A transportation management system can map inbound origins, outbound destinations, shipment frequency, mode, carrier capacity, cost per order, and delivery performance. Those records help identify customers whose freight already moves through compatible Northeast lanes. They also reveal whether potential replacement volume arrives in the right cadence, requires similar equipment, and can share linehaul or final-mile capacity.
This allows commercial and operations teams to evaluate alternate customers against real network fit. A prospect with attractive revenue may still be a poor match if its inbound freight arrives through different gateways, its order peaks conflict with the anchor customer's waves, or its delivery footprint requires an entirely new carrier base.
Transportation events also expose early changes in the anchor account. Falling inbound appointments, smaller outbound loads, fewer active lanes, rising expedites, and shifting inventory origins may indicate that the customer's network strategy is changing. Individually, those signals may look routine. Together, they can justify a review of utilization forecasts and contract exposure.
Turn a Dedicated Site Into a Resilient Asset
The objective is not to dilute the operational focus that makes a dedicated facility effective. It is to preserve options.
Facility leaders should maintain a live concentration-risk dashboard, test an anchor-exit scenario at least annually, document which automation and systems configurations are reusable, and keep a qualified list of customers with compatible transportation profiles. Capital approvals should also include a recoverability test: what portion of the investment remains productive if the original volume disappears?
Maersk's Hopedale hub demonstrates the scale available when logistics infrastructure is built around a major e-commerce account. Its long-term resilience will depend on whether that specialization is managed as a measurable exposure.
CXTMS connects shipment execution, carrier performance, lane economics, and facility-bound transportation events in one operational record. Request a CXTMS demo to see how transportation data can support customer-concentration monitoring and resilient fulfillment network planning.