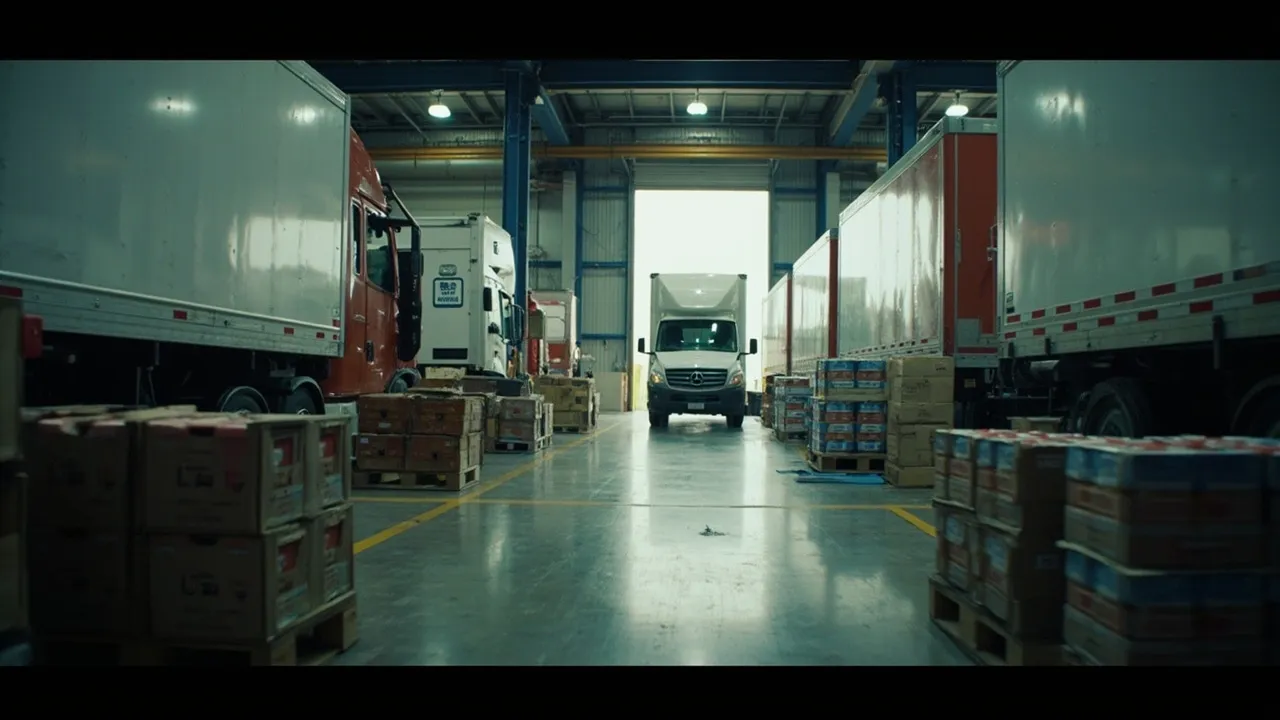
Warehouse Costs Are Rising Despite Vacancy: Reprice the Full Cost-to-Serve Model


More available warehouse space should create savings. Yet a lower asking rent can produce a more expensive logistics network once labor, inventory, handling, transportation, and service failures enter the calculation.
The market itself sends mixed signals. Supply Chain Dive reported that tenants pursued newer, large-format buildings at lower rents during 2025, often in more distant markets. The trade-off was supported by low freight rates and inventory front-loading, but the publication noted that logistics real estate pricing could become less favorable to tenants in 2026. A site decision built around last year's transportation economics can therefore age badly before the lease is fully operational.
The better question is not, “Which building costs less per square foot?” It is, “Which network configuration delivers each order at the required service level for the lowest total cost?”
Vacancy Does Not Remove Operating Friction
Vacancy is a real-estate measure, not a measure of usable logistics capacity. A building may be available but poorly positioned for the current supplier base, customer demand, parcel zones, truck capacity, or labor market. It may also require racking, automation, security, temperature control, yard work, or systems integration before it can process the intended freight.
Rent is only one fixed-cost line. Each warehouse also creates management overhead, utilities, insurance, maintenance, technology, and minimum staffing requirements. Inbound Logistics explains that facility, inventory, labor, and transportation costs are interdependent; labor costs occur at every warehouse regardless of size or throughput, while out-of-stocks may force emergency transportation from remote facilities.
That interaction matters more than a favorable vacancy headline. A cheaper building 80 miles farther from customers may add stem miles to every delivery. A larger footprint may spread inventory across more locations, increasing safety stock and working capital. An older facility may need more touches per order because its layout cannot support efficient slotting or automation.
Tariffs and Trade Shifts Change the Workload
Tariff volatility changes not only the landed cost of goods but also how inventory flows through a warehouse. Importers may front-load purchases, hold goods longer, reroute through different ports, change suppliers, or use bonded space. Each response changes receiving peaks, dwell, storage density, labor scheduling, and outbound transportation.
Reuters reported that one importer ordered 20% to 25% more strollers for spring 2026 while front-loading against tariff risk. That kind of inventory surge can make an apparently inexpensive warehouse costly through overflow storage, double handling, overtime, congestion, and slower order cycles. In a separate report, Reuters described growing importer interest in bonded warehouses, including a fulfillment operator that expected conversion of a Utah facility to take three to four months.
Network models must therefore test more than an average annual volume. Use scenarios for front-loaded imports, delayed customs release, supplier relocation, port changes, and demand declines. A site that wins under steady flow may lose when inbound volume arrives in waves or inventory stays 30 days longer than planned.
Build a Full Cost-to-Serve Equation
Start with cost per fulfilled order, shipment, unit, or customer—not cost per square foot. The model should include:
- Facility: rent, taxes, utilities, maintenance, insurance, security, fit-out, and depreciation.
- Labor: receiving, putaway, replenishment, picking, packing, loading, supervision, overtime, training, and turnover.
- Inventory: working capital, safety stock, shrink, obsolescence, damage, and markdown exposure.
- Handling: touches, travel time, equipment, packaging, cross-docking, and rework.
- Transportation: inbound and outbound linehaul, parcel zones, drayage, fuel, accessorials, empty miles, and expedites.
- Service risk: late orders, stockouts, claims, penalties, lost sales, and customer recovery.
- Transition: moving inventory, duplicate operations, systems setup, hiring, validation, and launch disruption.
Allocate those costs to the demand that causes them. A low-volume rural customer with strict appointment rules should not look as profitable as a dense urban customer receiving consolidated loads simply because both buy the same product. Segment by customer, channel, SKU velocity, order profile, geography, and service promise.
Real operating data also beats standard assumptions. Inbound Logistics documented a warehouse improvement that cut transportation spending by 10% and reduced carton quantity by 35% to 50%, even with relatively flat or slightly lower unit volume. The lesson is broader than that case: layout, packaging, inventory, and transportation decisions move together. A network comparison that freezes three of those variables will misprice the fourth.
Compare Sites as Operating Scenarios
For every candidate location, run the same demand file through realistic operating scenarios. Estimate inbound lanes, customer distances, parcel zones, modal mix, labor availability, throughput by shift, inventory days, and peak capacity. Then stress the model for fuel increases, wage inflation, volume swings, supplier changes, and service failures.
Do not accept a site because its average case wins by 2% if a modest volume shift makes it the most expensive option. Show the break-even points: the transportation rate, wage, throughput, or inventory level at which the ranking changes. This makes lease and network decisions defensible and exposes which assumptions require monitoring.
The analysis should also account for time. A remote site may offer immediate rent relief but create five years of higher delivery expense. Conversely, a higher-cost building near demand may reduce outbound miles, delivery variability, and inventory buffers enough to produce a lower net present cost.
Set Triggers for a Network Review
A cost-to-serve model should become a management system, not a one-time real-estate exercise. Recalculate it monthly or quarterly and launch a formal network review when defined thresholds are breached.
Useful triggers include volume moving more than 10% from plan, dwell rising for three consecutive periods, labor hours per order exceeding standard, overtime becoming structural, average outbound distance increasing, or expedite spending crossing its budget. Add triggers for inventory days, storage utilization, order-cycle time, on-time delivery, touches per unit, and cost per shipment.
Assign an owner to every trigger and define the response: validate the data, identify affected customer and SKU segments, model alternatives, and approve corrective action. The answer may be reslotting, revised replenishment, pool distribution, a cross-dock, changed carrier strategy, or a network redesign—not necessarily another warehouse.
CXTMS connects orders, shipments, rates, execution milestones, and actual freight costs so teams can see how a warehouse decision changes transportation and service performance. Instead of evaluating rent in isolation, operators can measure the full cost of serving each lane, customer, and order profile.
Ready to replace rent-per-square-foot comparisons with an executable cost-to-serve model? Request a CXTMS demo to connect network assumptions with real shipment costs and service outcomes.