Walmart's Automated California Fulfillment Center Needs a Launch-Control Scorecard

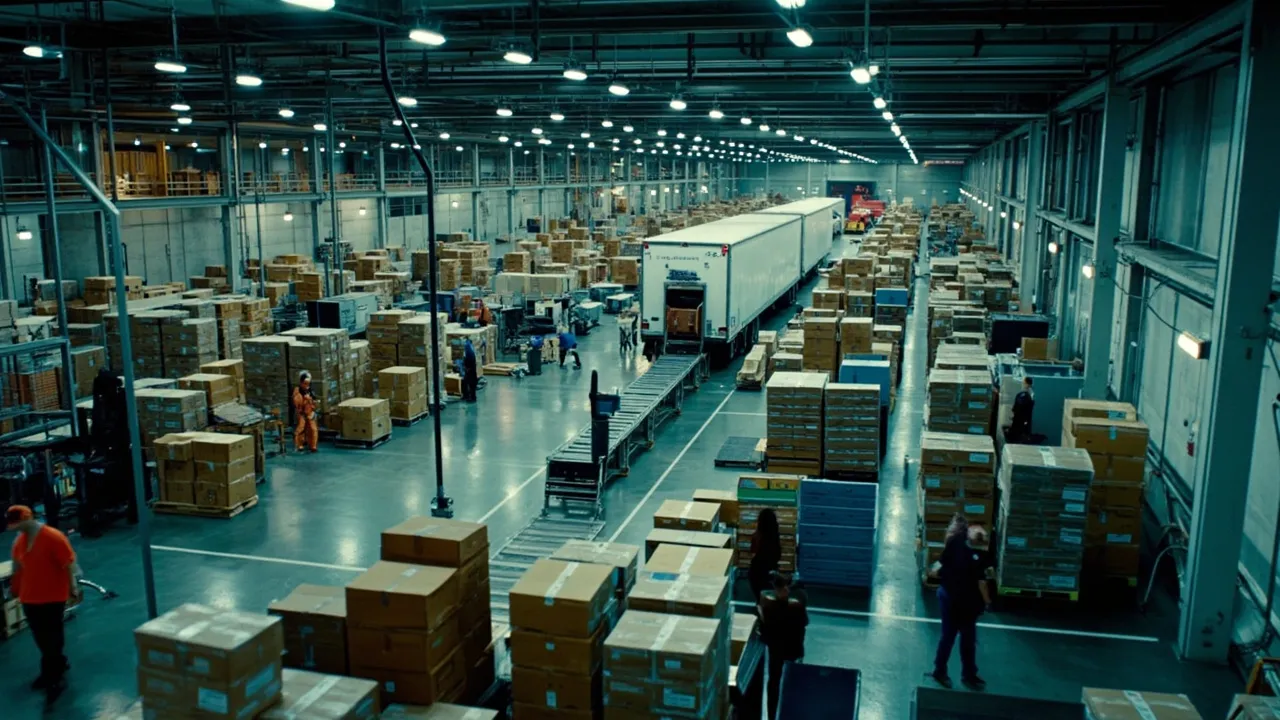
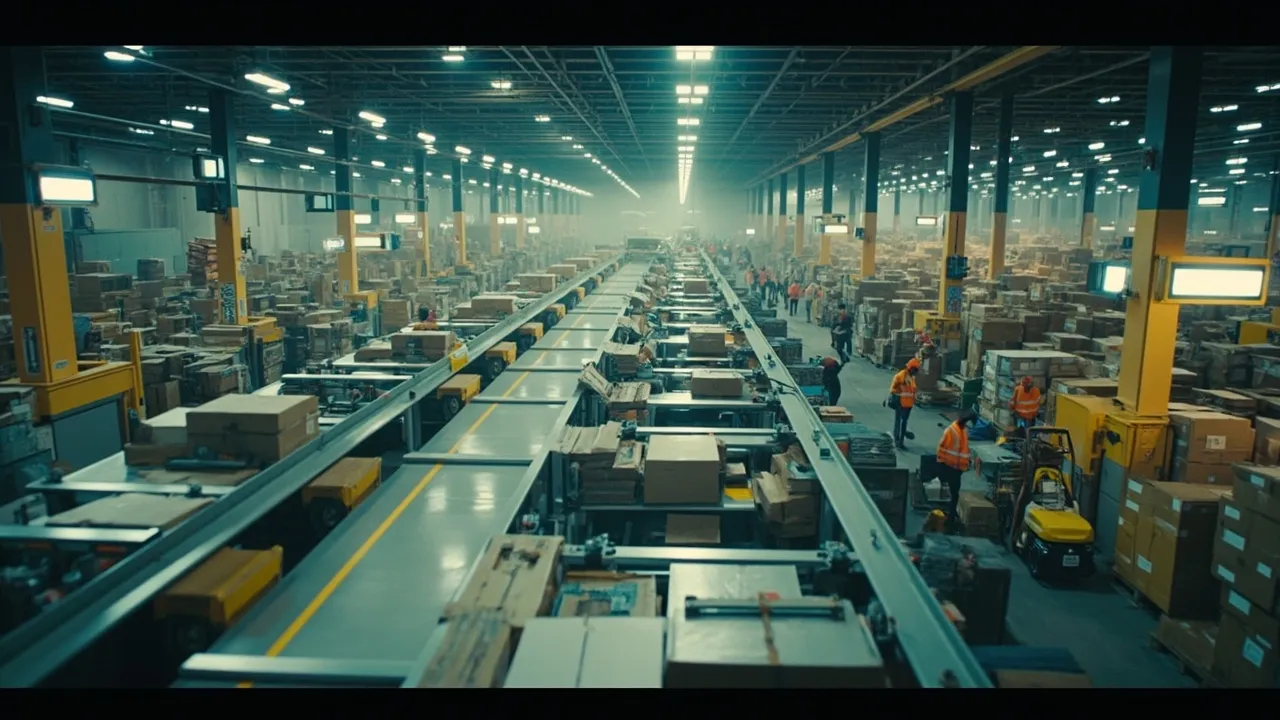
Walmart's newest automated fulfillment center adds major e-commerce capacity in California's Central Valley. Its real launch test, however, is not how fast robots move inventory. It is whether the building can repeatedly convert inbound products into complete, accurate orders that make their promised carrier departures.
That requires a launch-control scorecard spanning the entire flow—from receiving and storage through picking, packing, staging, and final-mile handoff. Warehouse and transportation teams need one operating view because a local gain in automated throughput can create a downstream queue just as easily as it can improve customer service.
Start with the network promise
FreightWaves reports that the Stockton facility covers 900,000 square feet and is Walmart's fifth next-generation fulfillment center. The site will employ more than 1,000 workers at full operation and support Walmart Marketplace merchants through Walmart Fulfillment Services as well as Walmart's own e-commerce orders.
The location is intended to put more capacity near West Coast customers and relieve pressure elsewhere in the network. Together with Walmart's four other next-generation sites, the network is positioned to offer next-day or two-day shipping to 95% of the U.S. population. E-commerce already represents 23% of Walmart's total sales, according to the same report.
Those figures define the promise, but they do not prove launch stability. During a ramp, leaders need to know whether Stockton is absorbing the intended demand, whether upstream inventory is arriving in the right profile, and whether downstream carriers can handle the resulting parcel volume by service and destination zone.
Measure the complete order path
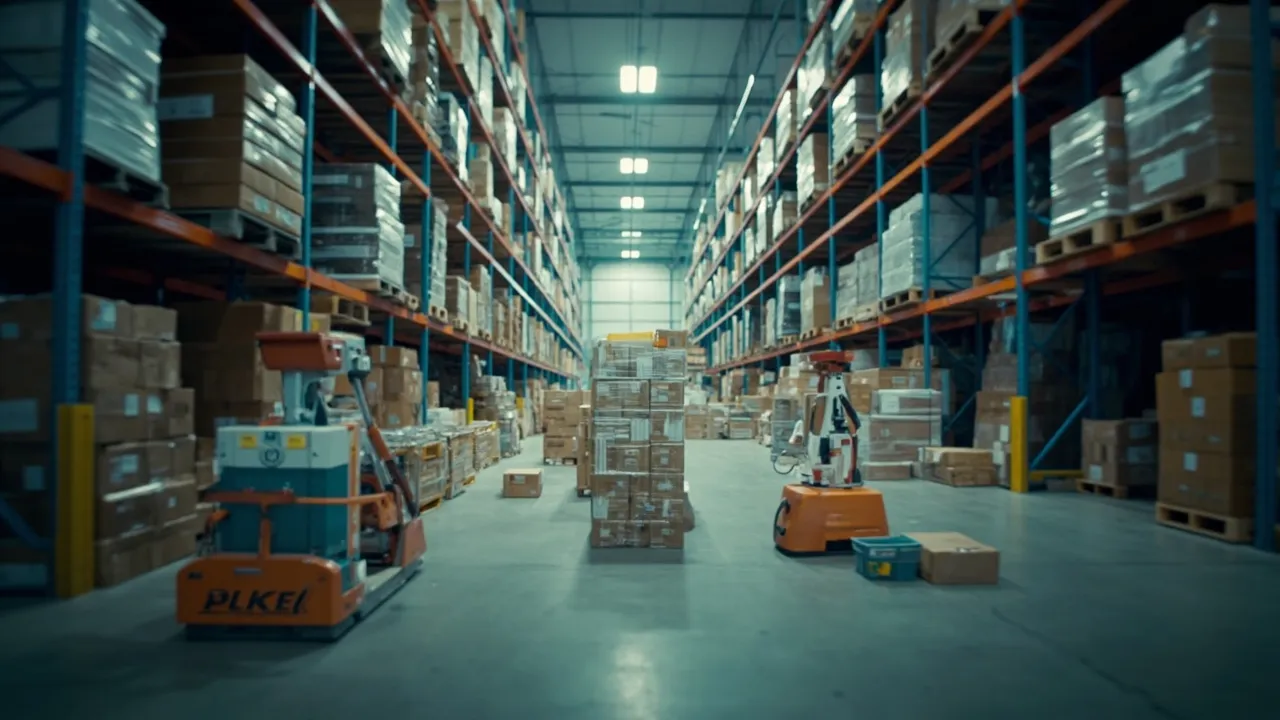
Walmart's high-density storage and retrieval system reduces a traditional 12-step fulfillment process to five steps, FreightWaves reports. Fewer touches can reduce manual work and improve storage and order capacity. Yet a five-step process still fails if one step cannot keep pace with the others.
A useful scorecard should track six linked stages:
- Induction: units received per hour, advance-shipping-notice accuracy, unload-to-induct time, and receipts waiting beyond target;
- Storage: putaway cycle time, location accuracy, usable capacity, and inventory unavailable because of system or quality holds;
- Picking: released versus completed lines, picks per labor hour, short picks, substitutions, and work aging by promised ship time;
- Packing: orders completed, packaging exceptions, rework, label errors, and cartons waiting for equipment or materials;
- Staging: cartons ready by carrier, service, destination, and cutoff, plus dwell in outbound lanes; and
- Departure: trailers or parcel sweeps planned, tendered, accepted, loaded, and departed on time.
The scorecard needs hourly and shift views, not just daily averages. A building can hit its daily unit target while missing a late-afternoon cutoff that drives thousands of orders into the next delivery day.
Separate machine throughput from customer-ready throughput
Automation dashboards naturally emphasize equipment availability, cycles per hour, and units moved. Those are necessary engineering measures, but they are not customer outcomes. The controlling metric should be orders that are complete, quality-cleared, manifested, staged, and still capable of meeting the promised departure.
For example, a storage system may release inventory faster than packing can build right-sized cartons. The apparent productivity gain then becomes work in process. Similarly, packing may produce cartons faster than the dock can sort them into carrier loads. The backlog merely changes location.
This distinction matters because automation investment is often justified by productivity. Modern Materials Handling reported that 78% of respondents in a PMMI operational-readiness survey identified productivity as their top goal, while cost and automation were each named by 47%. Launch governance should make productivity measurable without allowing a local machine metric to stand in for end-to-end performance.
Track the ratio of customer-ready orders to units inducted alongside raw automation speed. Add first-pass yield, exception age, missed-cutoff volume, and recovery time. If equipment throughput rises while that ratio falls, the launch team has found an imbalance—not a win.
Put exceptions on the main board
New facilities rarely fail only through total outages. More often, small exception queues accumulate: an unreadable label, an inventory mismatch, a carton rejected at sortation, a late inbound trailer, or a carrier that cannot accept the planned volume.
Give every exception a type, owner, opened time, promised-ship exposure, and resolution target. Display exception inventory and aging beside production volume. Set escalation triggers for both absolute counts and rates; 500 exceptions have different implications at 5,000 orders than at 100,000.
The broader automation design also matters. Modern Materials Handling notes that e-commerce growth has shifted order profiles toward smaller, more fragmented shipments, increasing fulfillment complexity. It also highlights right-fit packaging and the integration of packaging with upstream picking and sequencing. Stockton's scorecard should therefore connect item mix and order complexity to packaging performance rather than assume every order consumes equal capacity.
Connect warehouse milestones to transportation
Outbound capacity should scale from actual release forecasts, not static appointment plans. Share rolling projections of customer-ready cartons by carrier, service level, destination zone, cube, and cutoff. Then compare those projections with accepted tenders, trailer capacity, scheduled parcel sweeps, dock doors, and labor.
Create explicit triggers. If forecast-ready volume reaches 85% of planned carrier capacity several hours before cutoff, activate an additional sweep or trailer. If an exception queue puts a material share of expedited orders at risk, prioritize recovery by promise time rather than by the sequence in which problems appeared. If departure reliability drops, stop increasing induction until staging and carrier capacity recover.
CXTMS can connect inbound appointments, warehouse release milestones, carrier tenders, dock activity, departures, and delivery events in one control view. That gives teams a shared timeline for deciding when to add capacity, protect a cutoff, or slow upstream flow. It also preserves the data needed to compare planned and actual performance by shift, carrier, lane, and order profile.
The right launch scorecard does more than report Stockton's output. It shows whether every additional unit of automated capacity becomes a reliable customer promise.
Build a launch control tower with CXTMS
CXTMS helps logistics teams coordinate warehouse milestones with transportation capacity, carrier commitments, and delivery performance. Request a CXTMS demo to build an end-to-end launch scorecard for your next fulfillment expansion.