U.S. Rail Traffic Up 3.5%: Convert National Growth Into Lane Availability Signals

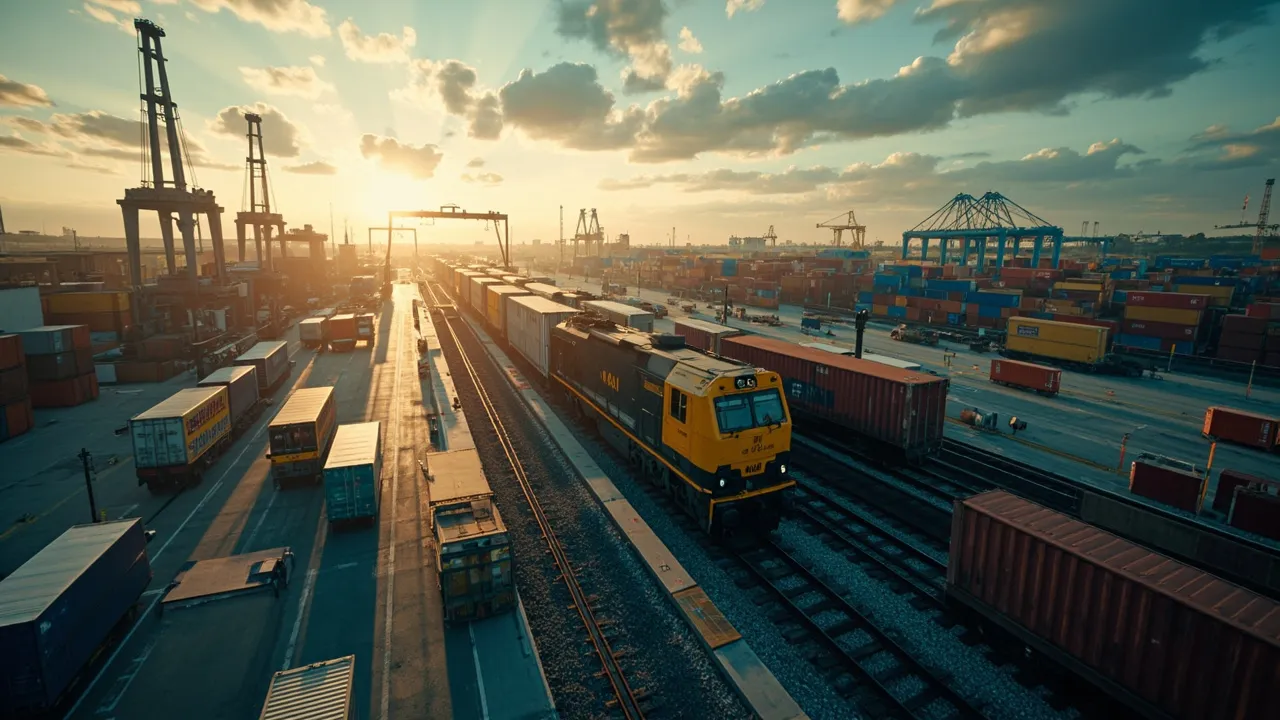
U.S. rail freight entered November with strong momentum. Total traffic rose 3.5% year over year in the latest reported week, while cumulative traffic increased 3.8% through the first 43 weeks of 2026. Those numbers indicate a healthy national network, but they do not answer the question transportation teams actually face: Can we secure the right equipment and service on a specific origin-destination pair next week?
FreightWaves reported the Association of American Railroads data behind the 3.5% weekly gain and 3.8% year-to-date increase. The direction is positive. Still, a national aggregate blends different commodities, railroads, terminals, corridors, and equipment pools. Shippers that treat it as a blanket capacity signal risk booking too late on tight lanes or paying for unnecessary protection where space remains plentiful.
The better approach is to translate the headline into a weekly lane availability score.
National growth is context, not a booking signal
Rail traffic can rise nationally while conditions diverge sharply by lane. A surge in grain can tighten covered hoppers in one region without affecting domestic containers elsewhere. Strong international intermodal volume can strain port ramps while an inland terminal has excess lifts. A railroad may have adequate systemwide capacity but limited chassis, dray drivers, train starts, or receiving windows at one location.
The mix matters as much as the total. FreightWaves' report identifies intermodal as the leader in the latest weekly gains. Earlier in 2026, U.S. intermodal volume reached 6.98 million units through June, up 3.3% year over year and the second-highest first-half result on record, according to Logistics Management. By September, U.S. railroads were averaging 295,504 intermodal containers and trailers per week, 6.7% above the prior year.
Those totals confirm sustained demand. They also make local execution data more important. As more freight enters the network, the gap between nominal capacity and usable capacity can widen.
Build a four-part lane score
A useful lane score should combine four categories and refresh at least weekly. Score each category from 0 to 25, producing a 100-point view of expected availability.
1. Commodity pressure
Track carload and intermodal growth for the traffic that competes with the shipment. The relevant comparison is not merely all rail volume; it is demand for the same train capacity, terminal lifts, or equipment type. Flag rapid week-over-week acceleration, seasonal peaks, and large customer programs near the origin.
For intermodal, monitor domestic and international units separately. For carload freight, segment by commodity and car type. A national increase driven by coal should not automatically change a domestic container decision, but it may affect shared crew or network resources on a particular corridor.
2. Terminal performance
Measure gate turn time, ingate acceptance, lift availability, cutoffs, grounding delays, and storage exposure at both ends of the lane. Terminal dwell is especially valuable because it reveals friction before it becomes a broad service failure.
A practical exception threshold is a loaded container that has not departed a ramp within 48 hours. Supply Chain Dive's review of rail visibility KPIs identifies 48-plus hours without movement as a dwell warning. Shippers should tighten that threshold on high-frequency lanes and compare it with the lane's normal range rather than relying on one universal limit.
3. Equipment and dray capacity
Count confirmed equipment, not theoretical equipment. Monitor container or railcar availability, chassis supply, empty repositioning time, dray tender acceptance, and appointment lead time. Equipment at a nearby terminal is not usable capacity if repositioning would miss the cutoff.
Network changes also deserve attention. Norfolk Southern and Schneider National are expanding domestic intermodal capacity across the eastern United States, with implementation planned for January 2027, according to Supply Chain Dive. Capacity additions can improve options, but transportation teams should wait for lane-specific schedules, ramps, and equipment commitments before changing routing guides.
4. Service trajectory
Combine train speed, terminal dwell, on-time departure, on-time arrival, and missed-connection frequency. Direction matters: three weeks of gradual deterioration can be more actionable than one bad reading. Logistics Management's 2026 rail roundtable noted that average speeds slowed as volumes increased, although on-time arrivals were improving and industry dwell had not risen materially. That is precisely why a composite score is stronger than any single measure.
Convert scores into booking rules
The score only creates value when it triggers action. A simple operating policy might use three bands:
- 80-100, available: Book through the normal routing guide and standard lead time.
- 60-79, watch: Secure equipment earlier, confirm terminal appointments, and quote a truck alternative.
- Below 60, constrained: Protect rail capacity immediately, split volume, or shift time-sensitive freight before service metrics visibly deteriorate.
Set separate thresholds for each shipment class. A low-value replenishment load with flexible delivery can tolerate more risk than a production-critical component. The system should also record why a score changed so planners can distinguish a temporary terminal event from a structural capacity problem.
Manage rail by lane, not by headline
The 3.5% weekly increase is encouraging because it shows railroads handling more freight than a year ago. It is not proof that every shipper can find space on every lane. National data should begin the planning conversation, while local commodity pressure, terminal flow, equipment supply, and service trajectory determine the booking decision.
CXTMS brings routing, capacity, milestone, and exception data into one operational view so teams can turn market signals into lane-specific action. Request a CXTMS demo to build earlier capacity warnings and more reliable mode-switch decisions into your transportation workflow.