U.S. Ocean Imports Set a September Record: Convert TEU Headlines Into Gateway Capacity Triggers

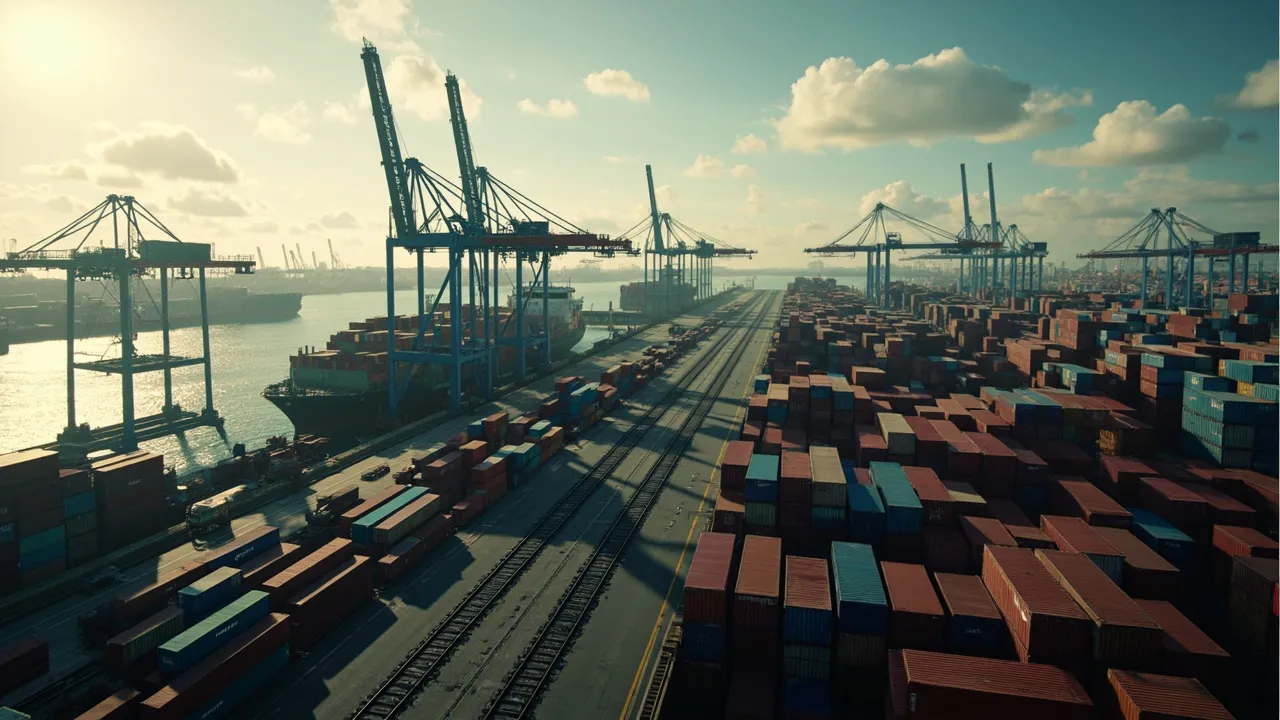
September's record U.S. ocean import volume is useful context, but it is not yet an operating plan. Freight teams need to translate the national headline into gateway-specific signals, shipment exposure, and predetermined actions.
Reuters reported that U.S. ocean container imports reached 2.55 million twenty-foot equivalent units (TEUs) in September, a record for the month. At the gateway level, the pressure was visible in Savannah: SupplyChainBrain reported more than 504,000 TEUs, up 3.7% year over year. Imports at Savannah rose 5.5%, while first-quarter fiscal-year throughput reached 1.5 million TEUs, 2.7% above the same period a year earlier.
Those figures do not mean every importer will experience the same disruption. National volume can rise while a specific terminal, rail ramp, or distribution center continues to flow normally. Conversely, one gateway can become constrained before a national dataset shows trouble. The operating question is therefore not simply, “Are imports high?” It is, “Where does our freight touch the system, and which constraints are beginning to tighten?”
Start With Exposure, Not the Headline
A useful import-risk view breaks the 2.55 million-TEU headline into four dimensions:
- Gateway exposure: containers and purchase orders by port, terminal, and inland rail ramp
- Time exposure: expected vessel arrivals by day and week, including revised estimated arrival times
- Commodity exposure: priority SKUs, seasonal products, and cargo with limited substitution options
- Customer exposure: orders, allocation commitments, and service-level penalties tied to each shipment
This distinction matters because a record month may be manageable when arrivals are evenly distributed. Risk rises when delayed vessels bunch into the same berth window, containers discharge faster than chassis or rail capacity can clear them, or warehouse appointments are already full.
Savannah illustrates why the local view matters. Its 504,015 September TEUs represented a monthly record, according to FreightWaves. The port attributed the extended peak partly to typhoon-related delays in Asia. That is a classic bunching mechanism: cargo that should have arrived across multiple weeks lands in a narrower period, concentrating demand on terminals, drayage providers, rail departures, and receiving docks.
Monitor Five Gateway Capacity Signals
Importers and forwarders should build a daily scorecard around signals that describe flow rather than total volume alone.
1. Vessel bunching
Compare scheduled arrivals with revised arrival times and berth windows. A practical trigger is the number of exposed containers arriving within a rolling 72-hour period. If that figure rises materially above the booked drayage and receiving capacity, add appointments or redirect freight before discharge.
2. Terminal dwell
Track median and upper-quartile dwell separately. The average can look healthy while a meaningful tail of containers sits for several days. Segment dwell by terminal, carrier, import availability status, and whether the box is rail- or truck-bound. Escalation should occur before free time expires, not after demurrage appears.
3. Chassis availability
Measure fulfilled chassis requests, split moves, and driver turnaways by location. A falling fulfillment rate is an early warning that a terminal release will not translate into a pickup. When chassis availability breaches the team's threshold, reserve equipment, use a compatible pool, or prioritize containers by customer impact.
4. Rail departures
For inland moves, monitor scheduled versus actual departures, rolled containers, and ramp dwell. The Appalachian Regional Port's first-quarter volume increased 13%, according to SupplyChainBrain, showing that inland rail nodes can absorb more cargo—but also that inland interfaces deserve their own capacity view.
5. Warehouse receiving capacity
Port fluidity does not prevent a bottleneck at the destination. Compare daily inbound appointments, labor plans, dock doors, yard slots, and available storage. A warehouse at 95% utilization may have less practical resilience than a terminal processing record volume efficiently.
Convert Signals Into Predetermined Actions
Thresholds should be agreed before congestion intensifies. Each company will calibrate them to its network, but a trigger table can begin with rules such as:
- If exposed arrivals exceed confirmed pickup capacity by 15% over 72 hours, secure overflow drayage and prioritize high-value containers.
- If projected terminal dwell approaches one day below free-time expiration, pre-pull to an approved yard or request an appointment exception.
- If chassis fulfillment falls below 90% for two operating periods, reserve equipment or shift pickups to a less constrained window.
- If rail departure reliability drops below the service commitment, compare expedited rail recovery with transload-to-truck cost and lead time.
- If receiving appointments are unavailable within 48 hours of planned pickup, activate drop capacity, extend receiving hours, or divert to a qualified transload site.
These are not universal benchmarks. They are examples of how to connect a measurable condition to an owner, response, and deadline. The thresholds should reflect free-time terms, cargo value, service commitments, and the cost of each intervention.
Alternate gateways require the same discipline. Moving freight from one port to another can trade terminal congestion for longer inland mileage, different rail schedules, added inventory days, or unfamiliar drayage capacity. Compare total landed cost and end-to-end reliability rather than port dwell in isolation.
Make the TMS the Decision Layer
A transportation management system should connect macro signals with the shipments they may affect. CXTMS can centralize bookings, vessel milestones, container availability, appointments, drayage capacity, costs, and customer commitments so teams can move from observation to action.
The most valuable workflow is exception-based. When a trigger is breached, the system should identify affected shipments, rank them by business impact, notify the responsible operator, and preserve the decision trail. That gives managers a clear view of which containers need attention without forcing them to manually reconcile carrier portals, spreadsheets, emails, and warehouse schedules.
Record import data should sharpen decisions, not generate generalized alarm. By mapping volume to gateways and enforcing measurable action thresholds, logistics teams can protect free time, truck turns, inventory availability, and customer service—even when the national TEU count reaches a new high.
Ready to turn market signals into shipment-level action? Request a CXTMS demo and see how one operational view can help your team manage ocean freight exceptions.