Reusable Packaging in the Warehouse: Calculate the Break-Even Trip Count Before You Buy

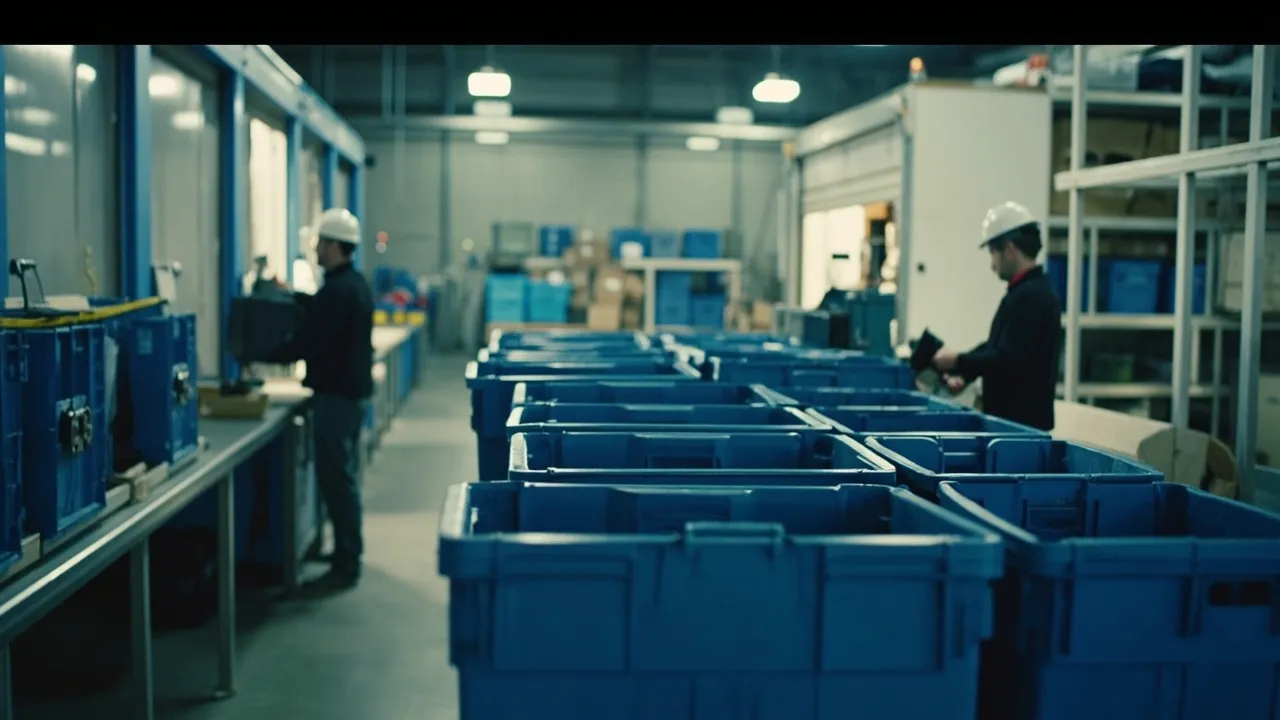
Reusable packaging can look like an obvious warehouse upgrade. Buy a durable tote once, circulate it repeatedly, and stop purchasing corrugated boxes for every shipment. But that simple comparison ignores the system required to bring each container back, clean it, repair it, and keep it moving.
The right question is not whether a reusable container costs more than a box. It is how many completed trips the container must make before its total cost per use falls below the disposable alternative—and whether the lane can reliably deliver that many trips.
That calculation should happen before procurement. Otherwise, a sustainability project can become a growing pool of working capital sitting at customer sites, in trailers, or in an untracked corner of the warehouse.
Start with a full cost-per-cycle model
For each container type and lane, separate the one-time acquisition cost from recurring cycle costs. A practical model includes:
- purchase price, labeling, and any tracking device;
- outbound handling and transportation effects;
- empty return transportation;
- inspection, cleaning, and drying;
- expected repair cost per cycle;
- expected loss cost per cycle; and
- end-of-life recovery or disposal value.
Let R be the reusable container's upfront cost, V its residual value, and C its recurring cost per completed cycle. Let D be the all-in cost of the disposable package for one trip. The basic break-even trip count is:
Break-even trips = (R − V) ÷ (D − C)
If a reusable tote costs $30, has a $2 residual value, and costs $0.85 per cycle for return freight, cleaning, handling, repair, and expected loss, while a corrugated alternative costs $2.25 per shipment, break-even occurs after 20 completed trips: $28 divided by $1.40.
That result is a decision threshold, not a forecast. If the tote is technically rated for 100 uses but the actual loop averages only 14 returns before loss or retirement, the program never reaches economic break-even.
Compare the entire disposable alternative
The disposable cost should include more than the box purchase price. Add erection labor, tape, labels, dunnage, disposal labor, waste-hauling charges, and any damage attributable to inadequate protection. Conversely, do not assume the reusable container eliminates all packing materials; some products still require liners, cushioning, or sanitation controls.
Modern Materials Handling advises comparing the full life cycle, including wash frequency, sanitation, drying, and water use. It also notes that corrugated packaging may be discarded after becoming wet, dirty, or damaged, while a rigid reusable container can reduce product damage.
Measure damage by lane and package type. A one-percentage-point reduction can matter more than the packaging price for fragile or high-value products. Calculate expected damage cost per shipment as the damage rate multiplied by the average claim, replacement, rework, and reshipment cost. Use actual claims data rather than a broad corporate average.
This analysis may produce different answers across the network. A short, balanced plant-to-DC shuttle may favor reusables, while a long, one-way customer lane with expensive empty returns may still favor corrugated.
Make return performance an investment gate
A reusable program is a closed-loop logistics program, not simply a packaging purchase. Set minimum gates before approving a lane:
- Required return rate: Calculate the loss rate the economics can tolerate. At a 95% return rate, 5 of every 100 dispatched containers fail to begin another cycle unless recovered later.
- Required completed cycles: Use the break-even result plus a safety margin. If break-even is 20 trips, a forecast of 21 is too fragile to justify the capital.
- Maximum cycle time: Define how long a container may remain away before it constrains the pool and triggers another purchase.
- Backhaul capacity: Confirm who returns empties, on which move, at what frequency, and at what incremental cost.
- Partner accountability: Assign custody, scan requirements, loss charges, and dispute rules at every handoff.
These controls matter because losses can erase savings quickly. Logistics Management reports that customers using an asset-management program saw reusable-packaging losses decline 30% to 50% in the first year. Treat that statistic as evidence that visibility can materially improve control—not as a guaranteed saving for every operation.
Track custody and dwell as transportation events
The container record should travel with the shipment workflow. Assign every tote, rack, pallet, or container a unique identifier or manage homogeneous assets as a controlled pool. Capture these events:
- issued from the origin pool;
- loaded to a shipment;
- transferred to a carrier;
- received by the destination;
- emptied and available for return;
- collected on a backhaul;
- received at the wash or inspection point; and
- returned to available inventory.
Each event needs a timestamp, location, responsible party, and associated shipment or route. From that history, operators can measure dwell by customer, identify containers stranded beyond the agreed window, and forecast when a lane will run short.
Technology should match asset value and network complexity. Barcode scans may be sufficient for a disciplined single-site loop. RFID can reduce manual touches at fixed portals. GPS or IoT tracking may be justified for high-value assets moving through less predictable networks. A SupplyChainBrain analysis notes that large RFID deployments can require significant infrastructure and describes implementations across 500 sites taking up to two years. That is a warning against buying sophisticated tracking before defining the events and responsibilities the technology must support.
Pilot one lane and test the assumptions
Begin with a high-volume, closed-loop lane with stable trading partners and natural return capacity. Run enough cycles to observe loss, cleaning, damage, dwell, and seasonal effects. Review the model monthly using actual results.
Approve expansion only when the pilot clears three tests: achieved cycles exceed the break-even threshold, the observed return rate supports the planned pool size, and service or damage performance is at least as good as the disposable baseline. If the economics miss, isolate whether the cause is return freight, slow turns, cleaning, asset loss, or the container itself before changing the design.
Reusable packaging succeeds when finance, warehouse operations, transportation, and trading partners manage it as one circulating asset system. CXTMS connects shipment execution, return moves, custody milestones, and exception workflows so teams can see whether containers are earning their next trip. Request a CXTMS demo to build a measurable closed-loop transportation process around your reusable packaging program.