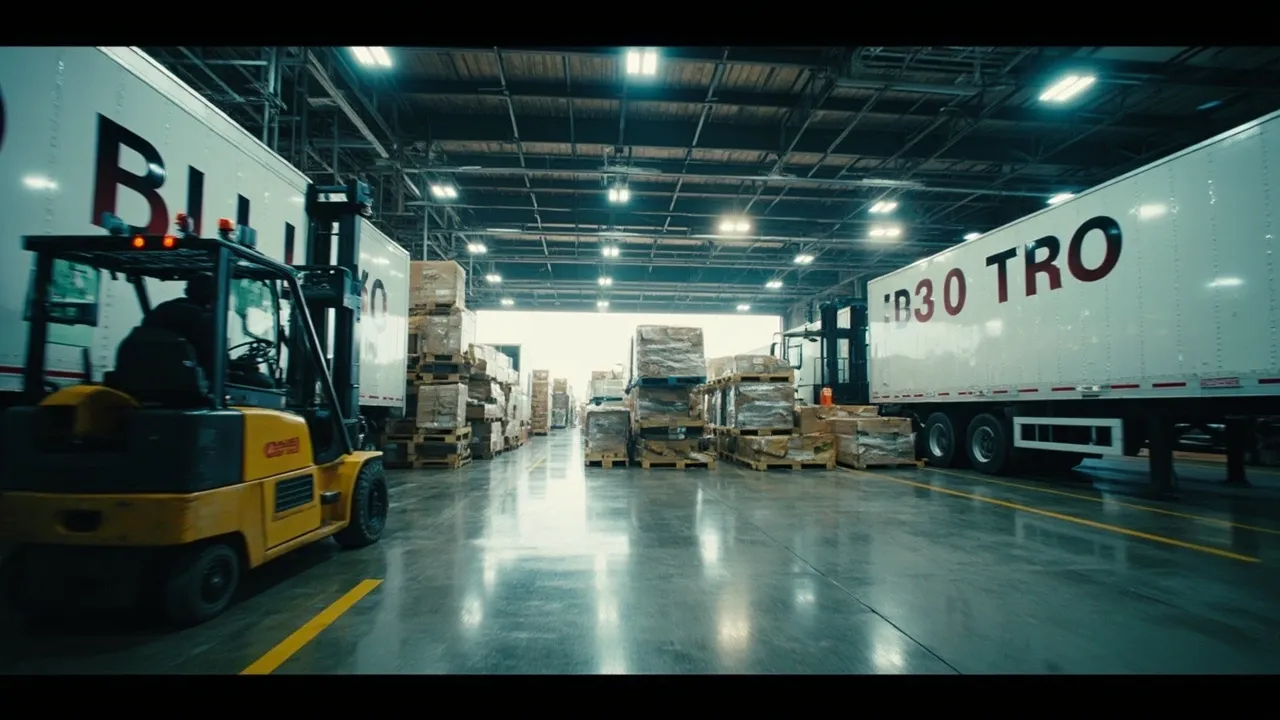
Prologis IBI Hits 59.3: Converting Warehouse Activity Into a Freight Demand Signal

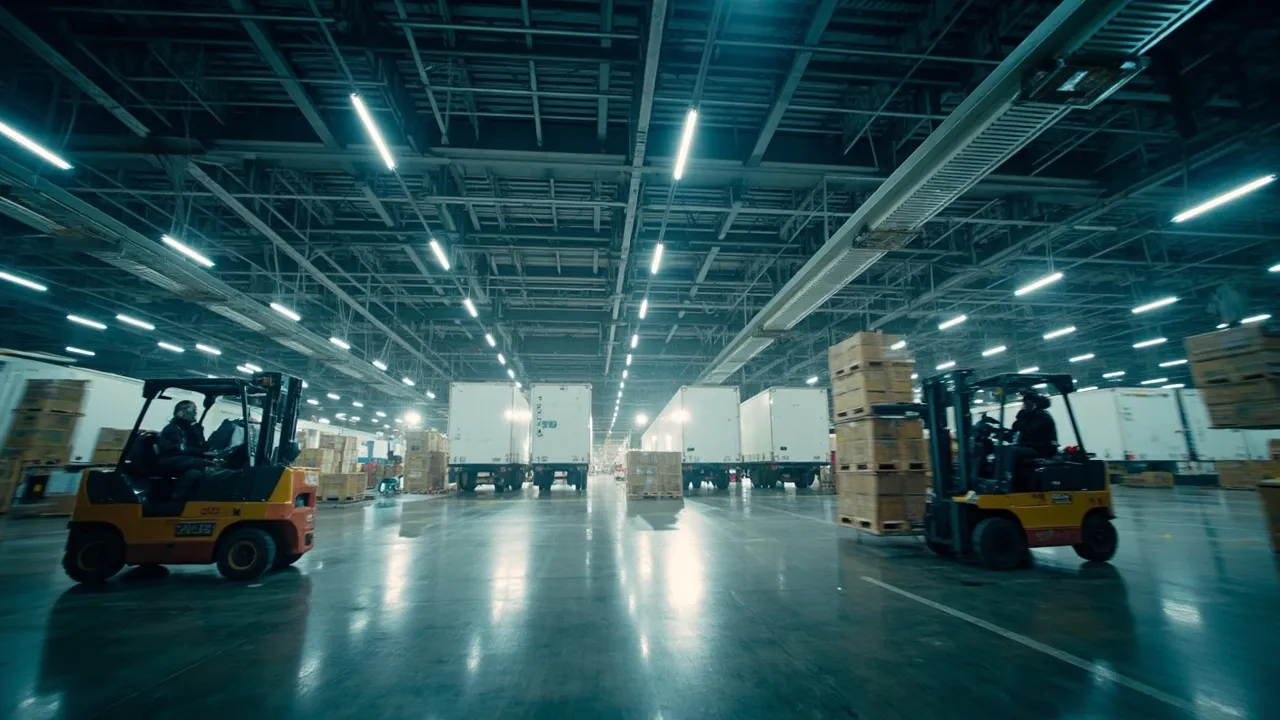
Warehouse activity is accelerating, but the useful question for transportation teams is not simply whether facilities are busy. It is whether today's activity will become tomorrow's outbound volume—and whether contracted carrier capacity will absorb it.
The latest Prologis Industrial Business Indicator (IBI) offers a timely starting point. The second-quarter Activity Index reached 59.3, staying within the 55-to-60 expansion range seen over several quarters. Logistics Management reports that the result reflects increased warehousing activity and sustained demand improvement. Because readings above 50 indicate growth, 59.3 is more than a neutral pulse: it signals broadly expanding work inside logistics facilities.
For freight planners, however, the IBI should be treated as an early-warning input—not a shipment forecast by itself.
Why warehouse activity can lead freight demand
Warehouse work sits between inbound supply and outbound transportation. When receiving, putaway, replenishment, picking, and staging intensify, freight often follows after a short operational lag. That lag varies by business model: a high-velocity fulfillment center may convert activity into parcels or truckloads within hours, while an import distribution center may hold goods for weeks.
The relationship usually appears through three channels.
First, higher pick and replenishment activity increases staged orders. Once enough orders accumulate by destination and service window, outbound tenders rise. Second, busier facilities add labor hours, shifts, or temporary workers. Labor demand can therefore confirm that elevated activity is persistent rather than a one-day receiving surge. Third, concentrated outbound releases tighten carrier schedules. Tender acceptance can weaken and spot exposure can climb when multiple facilities release volume into the same lanes at once.
The broader market supports watching this conversion closely. FreightWaves' coverage of the Logistics Managers' Index found warehousing capacity falling from 47.5 to 46.3, while warehousing prices increased from 73.8 to 75.5. That combination—contracting available capacity and rising price pressure—suggests that additional warehouse activity may encounter less operational slack.
Build a regional signal stack
A national index cannot tell a shipper which origin will tighten first. The practical move is to combine the IBI with internal measures at facility, market, and lane level. A useful signal stack contains four layers.
1. Facility activity
Track receipts, putaway tasks, replenishments, picks, packed orders, and staged pallets by day. Compare each measure with its trailing four- and thirteen-week averages. Picks and staged pallets are usually closer to transportation demand than receipts, while receipts help explain what may enter the outbound pipeline later.
Normalize activity for calendar effects. A post-holiday rebound, month-end push, or promotion can produce a temporary spike that should not be mistaken for a durable trend.
2. Inventory turns and dwell
Measure how quickly received inventory becomes available, allocated, picked, and shipped. Rising activity accompanied by faster turns is a stronger freight signal than activity accompanied by growing dwell. If units are entering the building but aging in reserve storage, the warehouse may be accumulating inventory rather than generating outbound demand.
Segment turns by product family and destination region. Fast movement in bulky goods may generate truckload demand quickly; fast movement in small items may primarily affect parcel and less-than-truckload networks.
3. Dock appointments
Monitor requested outbound appointments, appointment lead time, door utilization, trailer dwell, and late departures. A rising count of future appointments converts warehouse activity into a time-based view of expected freight. It also exposes constraints before they become missed pickups.
Map facilities into regional clusters rather than viewing them independently. Simultaneous appointment growth across nearby sites can strain the same local drayage, truckload, and labor pools.
4. Carrier acceptance
Overlay primary tender acceptance, response time, waterfall depth, spot quote counts, and rate variance. Warehouse activity becomes commercially significant when acceptance deteriorates on the lanes where staged volume is rising.
Set tiered triggers. For example, elevated facility activity alone may prompt monitoring; activity plus appointment growth may prompt a capacity check; those two signals plus weakening acceptance may justify prebooking backup capacity or adjusting routing-guide allocations.
Where the IBI can mislead
An expansionary reading does not guarantee a proportional increase in freight. Several effects can break the connection.
Inventory front-loading can create intense receiving and storage activity well before customer demand materializes. Network redesigns can shift work between buildings without changing total shipment volume. Automation can increase task counts while reducing labor demand, weakening labor as a confirmation signal. Product mix also matters: 1,000 additional e-commerce picks do not equal 1,000 pallet movements.
Geography is another limitation. A national indicator can remain strong while a shipper's core origins soften. Supply Chain Dive notes that Phoenix and Indianapolis led markets with increased warehouse demand in one recent quarter, illustrating how activity can concentrate regionally rather than rise uniformly.
Finally, warehouse activity and truck capacity can move independently. Carrier exits may tighten capacity even under modest demand, while excess tractors can keep acceptance high despite growing warehouse throughput. Planners need both sides of the equation.
Validate the signal with shipment data
Start by testing whether each facility's activity measures led historical outbound orders, tenders, and shipped weight. Compare lags of one, seven, fourteen, and twenty-eight days. The most predictive measure and lag will differ across facilities.
Then calculate forecast error by region and mode. If staged pallets reliably lead truckload tenders by seven days in the Midwest but poorly predict volume in the Southeast, use different alert thresholds. Recalibrate quarterly and after network, assortment, or order-policy changes.
The 59.3 IBI reading is valuable because it tells planners to look harder at emerging demand. Its real power comes from translating that macro signal into facility-level evidence, regional capacity actions, and measurable transportation outcomes.
Ready to connect warehouse signals with shipment planning and carrier execution? Request a CXTMS demo to see how one transportation platform can turn operational data into faster, better-informed freight decisions.