Prologis Breaks Ground on a 1.3M-Square-Foot Cross-Dock: Test the Building Against the Freight Profile

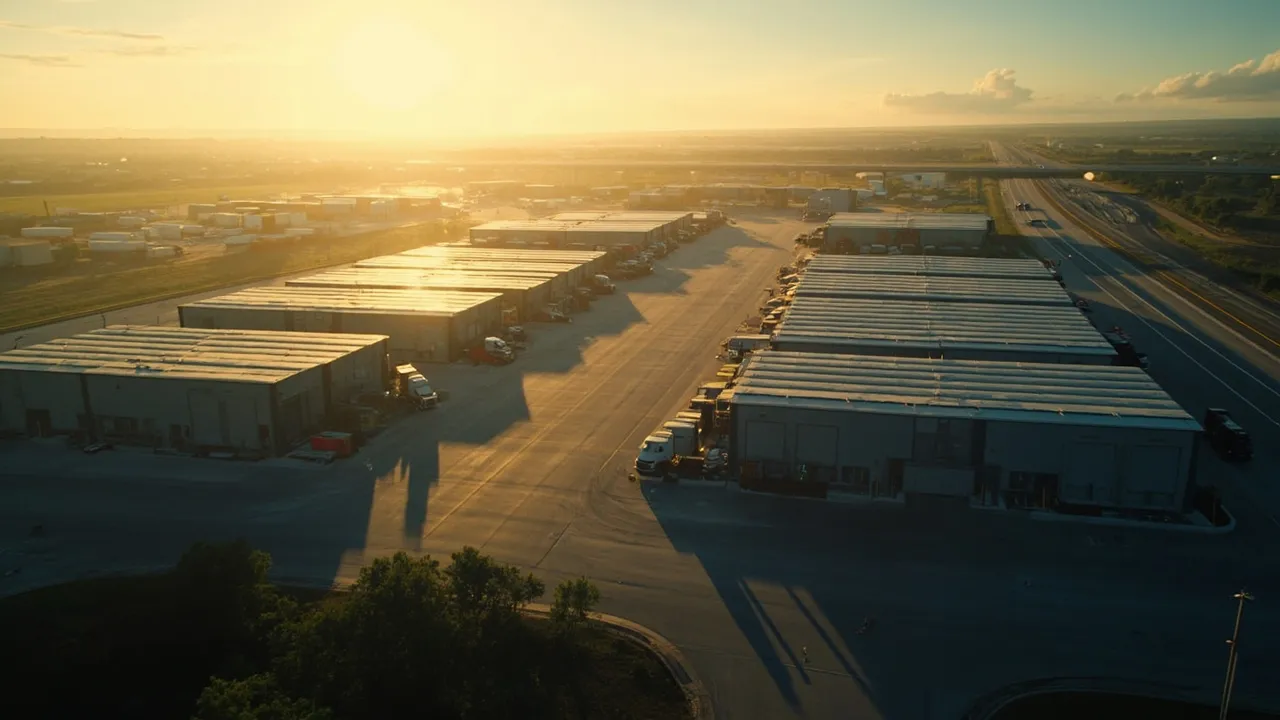
Prologis has broken ground on a nearly 1.3-million-square-foot cross-dock facility in Jackson, Georgia. Its scale will attract attention, but square footage is not the metric that determines whether a building improves a shipper's network. The real question is whether its doors, yard, labor market, highway access, and operating design can process a specific freight profile at peak volume.
That distinction matters because a cross-dock is not simply a very large warehouse. Its economic value comes from moving freight between inbound and outbound trailers with minimal storage and handling. As Inbound Logistics explains, building shape, product flow, and the number and placement of dock doors are critical design considerations. A vast building with the wrong flow can add travel, touches, and delay rather than remove them.
Start with flow, not floor area
Before touring the property, translate demand into hourly movements. Build a seven-day profile showing inbound trailers, outbound trailers, pallets, cases, weight, cube, appointment windows, and dwell by hour. Then model the busiest credible shift—not the annual average.
The Jackson project should be tested against at least four freight patterns:
- High-volume, full-pallet transfers that can move directly across the dock
- Mixed-SKU consolidation that needs sorting, staging, and scan confirmation
- Floor-loaded freight that consumes more labor and door time
- Freight requiring inspection, temperature control, hazmat separation, or exception handling
Each pattern creates a different requirement. A palletized flow may turn a door several times per shift. Floor-loaded cartons may occupy the same door for hours. Averages conceal that difference, so capacity should be expressed as pallets, cases, and trailers per labor hour and per door hour.
The operating objective is fewer touches. A separate Inbound Logistics review notes that cross-docking eliminates putaway and picking, supports consolidation, and can improve transportation and labor utilization. If a proposed process still sends most freight into reserve storage, the operation is closer to a conventional distribution center—and should be evaluated as one.
Convert door count into usable capacity
A brochure door count is only a starting point. Separate doors by inbound, outbound, returns, damaged freight, and maintenance use. Deduct doors blocked by charging infrastructure, yard constraints, or incompatible trailer types. Then calculate usable door hours after breaks, shift changes, sanitation, inspections, and appointment variability.
Door capacity also depends on internal travel. Cross-dock freight should move through short, predictable lanes without colliding with replenishment, pedestrian, or lift-truck traffic. Measure the distance between likely inbound and outbound door pairs and multiply it by peak pallet moves. A few hundred unnecessary feet repeated thousands of times becomes a material labor requirement.
Technology can change the equation. Inbound Logistics recently described an automated approach under which a hypothetical warehouse could shrink from 40 doors to 10, with 10 operating teams instead of 40. That is not a universal benchmark, but it demonstrates why door count cannot be assessed independently of unload methods, conveyors, autonomous equipment, and scheduling discipline.
Treat the trailer yard as production space
The dock stops when the yard stops. Determine how many loaded inbound, loaded outbound, empty, late, rejected, and maintenance trailers will be present at the peak. Add space for hostler movement and recovery from weather, highway disruption, and missed appointments.
Track five yard metrics during qualification:
- Trailer spaces per active dock door
- Average and 95th-percentile gate-to-door time
- Average and 95th-percentile trailer dwell
- Hostler moves per completed load
- Peak queue length at the gate and on nearby roads
A nominally large trailer yard can still fail if its geometry forces excessive repositioning or if separate carrier fleets arrive in the same narrow window. Run a time-based simulation using actual appointment distributions rather than simply dividing parking spaces by daily trailers.
Test labor and highway access at shift level
Jackson's position in the I-75 South corridor may support regional and interstate flows, but a map pin is not a service guarantee. Model travel time to major origins, destinations, parcel hubs, ports, rail ramps, and customer clusters at the hours trucks will actually depart. Include recurring congestion, driver hours-of-service limits, tolls, and the probability that a late inbound misses its outbound connection.
Labor analysis needs the same precision. Define the headcount and skills required for the peak shift, then test the realistic commute radius, competing employers, wage rates, turnover, and availability of supervisors, maintenance technicians, hostlers, and equipment operators. A building that can physically process 100 trailers in a shift is not capable of doing so unless the labor plan supports it.
Staffing should follow freight signals. Inbound Logistics recommends matching staff to shipment volume and tracking direct labor productivity alongside pre-alerts for arriving freight. That means the site assessment should include data readiness: advance shipment notices, appointment quality, barcode compliance, and exception visibility.
Separate speculative capacity from committed demand
Large speculative construction creates options, not proof of fit. Prologis manages 1.3 billion square feet across 20 countries, according to FreightWaves, and reported 64 million square feet of logistics lease signings in the first quarter of 2026. Those numbers show the scale of the platform and current leasing activity, but an individual occupier still needs a demand-backed business case.
Create three occupancy scenarios: committed volume, probable growth, and upside demand. Phase labor, material-handling equipment, automation, and occupied zones against those scenarios. Price the cost of unused space, premature automation, and duplicate operations during transition. Negotiate expansion rights and operational milestones where possible rather than designing the first day around an optimistic fifth year.
Use a throughput-first qualification scorecard
Score the site with weighted measures tied to the network outcome:
- 30% flow capacity: peak door hours, processing rates, internal travel, and exception space
- 20% yard resilience: trailer capacity, gate queues, hostler moves, and dwell recovery
- 20% transportation: route reliability, cutoff performance, carrier access, and total landed cost
- 15% labor: peak staffing availability, wage competitiveness, skills, and commute radius
- 10% demand confidence: committed volume, customer concentration, and ramp timing
- 5% flexibility: expansion, sublease, power, automation, and alternate-use options
Set minimum thresholds for any factor that can halt operations. A strong total score should not compensate for an undersized yard or an unavailable peak-shift workforce. Finally, compare the building with alternatives: a smaller cross-dock, multiple regional nodes, a shared facility, or continued use of incumbent sites.
The right facility is not the one with the most square feet. It is the one that converts a defined stream of freight into reliable departures at the lowest sustainable cost.
Ready to connect facility decisions with actual shipment demand? Request a CXTMS demo to model flows, appointments, carrier performance, and network costs in one transportation platform.