Long Beach's Pier B Plan Targets 24-Hour Rail Dwell: How to Measure the Gateway Payoff

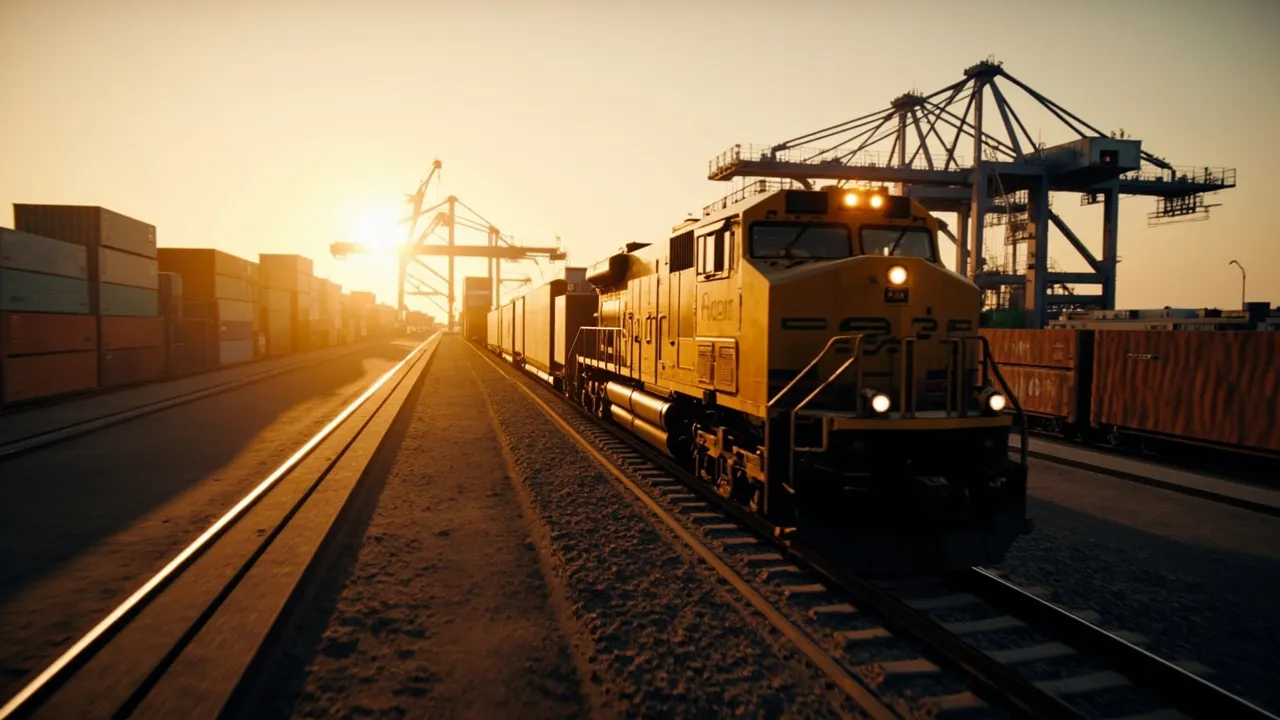
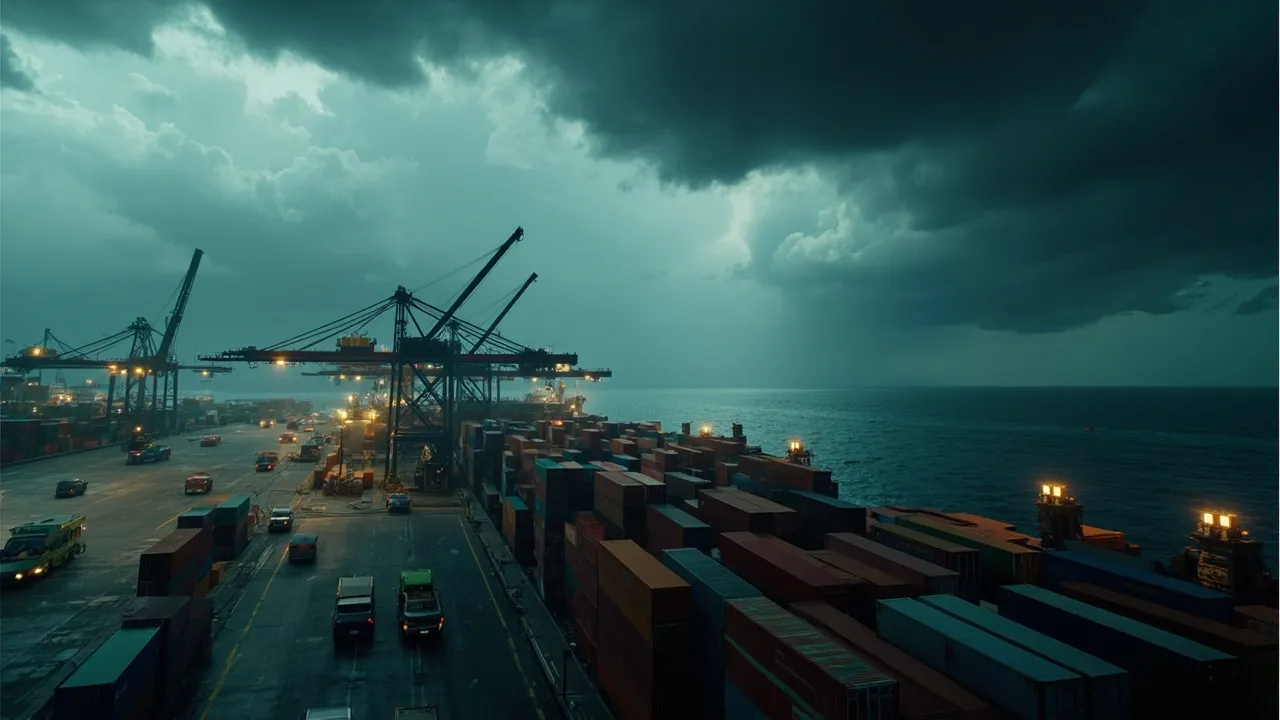
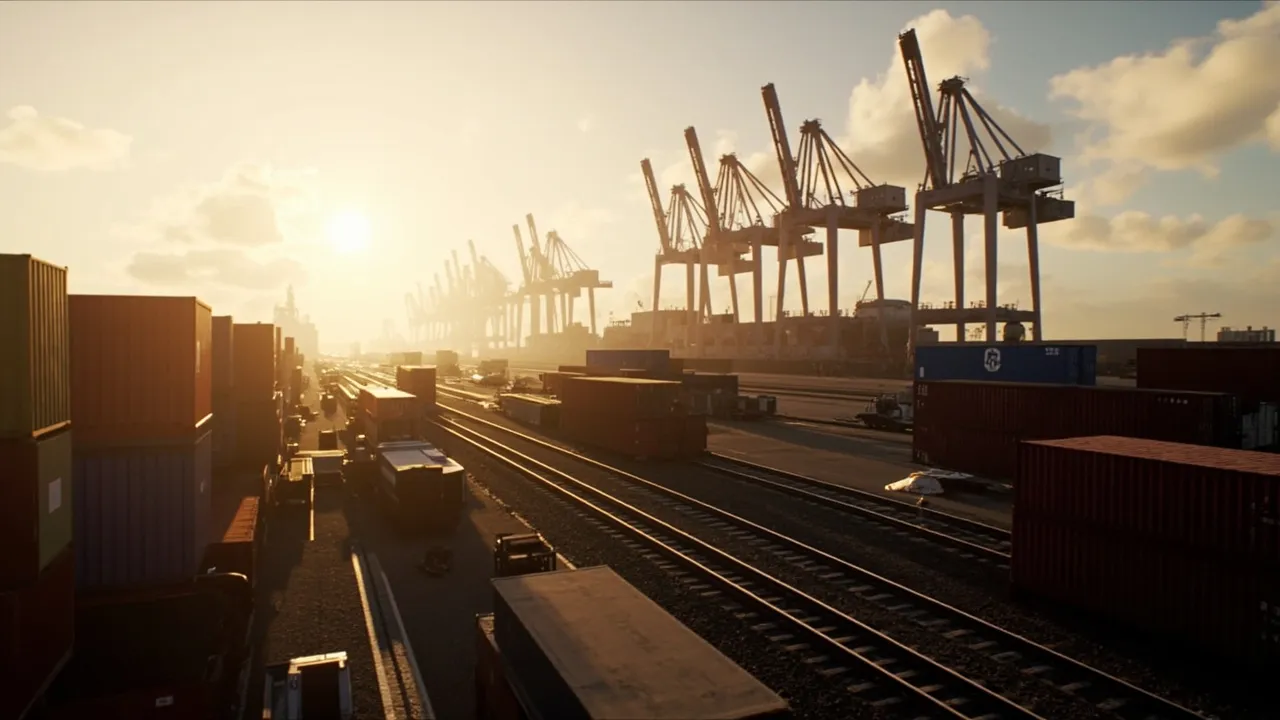
The Port of Long Beach's Pier B On-Dock Rail Support Facility is designed to change a stubborn part of the import journey: the interval between a container leaving a vessel and departing the harbor by train. The headline target is ambitious—reduce rail dwell from roughly four days to 24 hours while more than doubling the port's rail-handling capability.
That goal deserves attention, but infrastructure capacity is not the same thing as shipper value. Importers will only realize the payoff if added track, longer train assembly, terminal coordination, and railroad service combine to produce faster and more predictable shipment milestones.
FreightWaves reports that Pier B is intended to triple on-dock rail capacity and strengthen connections to the national rail network. An earlier Supply Chain Dive report put the planned capacity increase at 2 million to 4.7 million twenty-foot equivalent units annually and the project investment at $870 million.
Those figures define the scale. They do not, by themselves, tell a shipper whether its boxes moved better.
Why a 24-hour rail dwell target matters
Rail dwell is working capital parked at the gateway. A container waiting four days rather than one ties up inventory, obscures inland arrival estimates, consumes free time, and makes downstream labor and appointment planning less reliable. It can also force planners to carry more safety stock or authorize costly recovery moves.
Reducing that interval by three days could improve several connected outcomes:
- Container availability: Inland facilities receive usable inventory sooner, reducing the gap between purchase-order arrival and allocation.
- Demurrage exposure: Faster movement lowers the probability that a rail-bound box crosses a terminal free-time threshold, although billing rules and holds still matter.
- Inland ETA reliability: Earlier train departure provides more time to manage linehaul variability before a customer or distribution-center appointment.
- Drayage demand: More on-dock rail can reduce the need to dray containers to off-dock rail yards, avoiding an extra handoff and local truck trip.
- Equipment velocity: Containers and chassis complete their cycles sooner, particularly when terminal release and railroad departure remain synchronized.
The benefit is therefore broader than terminal speed. It appears across inventory, transportation, finance, and customer service—but only if teams connect those records.
Build the baseline before capacity changes
A clean before-and-after comparison should begin well before the new facility reaches full operation. At minimum, capture vessel discharge, customs release, terminal release, rail billing, train loading, port departure, inland ramp arrival, grounding, and final delivery timestamps for every eligible shipment.
The primary metric should be median time from vessel discharge to port rail departure. Median performance resists distortion from a handful of extreme holds. Pair it with the 75th and 90th percentiles, because a lower average can conceal a costly tail of delayed containers.
Then segment the baseline by factors the project cannot control:
- terminal and ocean service;
- destination railroad and inland ramp;
- weekday, weekend, and holiday discharge;
- customs or government-agency hold status;
- hazardous, refrigerated, and oversized cargo;
- train service frequency and destination block;
- weekly port volume and vessel bunching.
This segmentation prevents a common measurement error. If cargo volume falls during the comparison period, dwell may improve even without an infrastructure benefit. Conversely, a strong peak season can make a genuine process improvement look ineffective. Compare like-for-like shipment cohorts and report volume alongside dwell.
Use four scorecards, not one headline KPI
The Pier B payoff should be evaluated through a linked scorecard.
1. Flow: Track discharge-to-departure dwell, the percentage departing within 24, 48, and 72 hours, and variability by terminal and inland lane. A 24-hour target should be treated as a service distribution, not a single monthly average.
2. Cost: Measure demurrage incidents and dollars per eligible container, off-dock drayage moves, storage, chassis days, and expedites triggered by late inland availability. Normalize each measure per 100 containers so volume growth does not masquerade as deterioration.
3. Reliability: Compare planned and actual port departure, inland ramp availability, and final delivery. Track the percentage of shipments that retain their original delivery appointment. The facility succeeds commercially when terminal gains survive the entire trip.
4. Capacity utilization: Monitor rail share, train length, available versus used train slots, and containers left behind after the intended cutoff. The planned 4.7 million-TEU capacity matters only when operating schedules and demand allow shippers to use it.
Separate infrastructure gains from market noise
A credible analysis needs a control. One option is to compare Pier B-eligible rail shipments with similar Long Beach moves not yet using the improved process. Another is to use matched lanes through a comparable gateway, adjusting for distance, commodity, carrier, and weekly import volume.
Teams should also flag disruption periods rather than quietly averaging them away. Labor events, severe weather, rail network outages, blank sailings, customs exams, and vessel bunching are operational reality. Report performance both with and without exceptional events. The first view shows the shipper's lived experience; the second reveals whether the underlying gateway process improved.
Recent regional data shows why this discipline matters. A FreightWaves dwell report found truck-bound cargo at Los Angeles–Long Beach averaged 2.59 days in April 2026, compared with 2.61 days in March and 2.78 days a year earlier. Small changes can look meaningful until placed against mode, season, and volume. Pier B measurement should use the same contextual rigor.
Turn terminal milestones into shipper action
Visibility without workflow does not protect a delivery promise. Importers should configure milestone rules that compare actual events with lane-specific thresholds. If rail departure has not occurred within 24 hours of an eligible, released container's discharge, the transportation team needs an exception—not another dashboard tile.
The exception should identify the responsible handoff, expected next event, free-time exposure, downstream appointment risk, and approved alternatives. A planner may keep the rail plan, request a new ETA, change an appointment, prioritize an inventory transfer, or evaluate a dray-and-transload recovery. The correct action depends on shipment value and customer impact, not dwell alone.
Pier B could produce a major gateway improvement. The decisive test will not be the ribbon cutting or theoretical capacity. It will be whether importers see sustained reductions in dwell, cost, variability, and missed commitments across comparable shipments.
CXTMS connects port, rail, order, cost, and delivery milestones so logistics teams can build that evidence and act on exceptions before they become failures. Request a CXTMS demo to see how a transportation control tower can measure gateway performance shipment by shipment.