Locus Robotics Buyers Need an Orchestration Benchmark, Not Another Robot Count


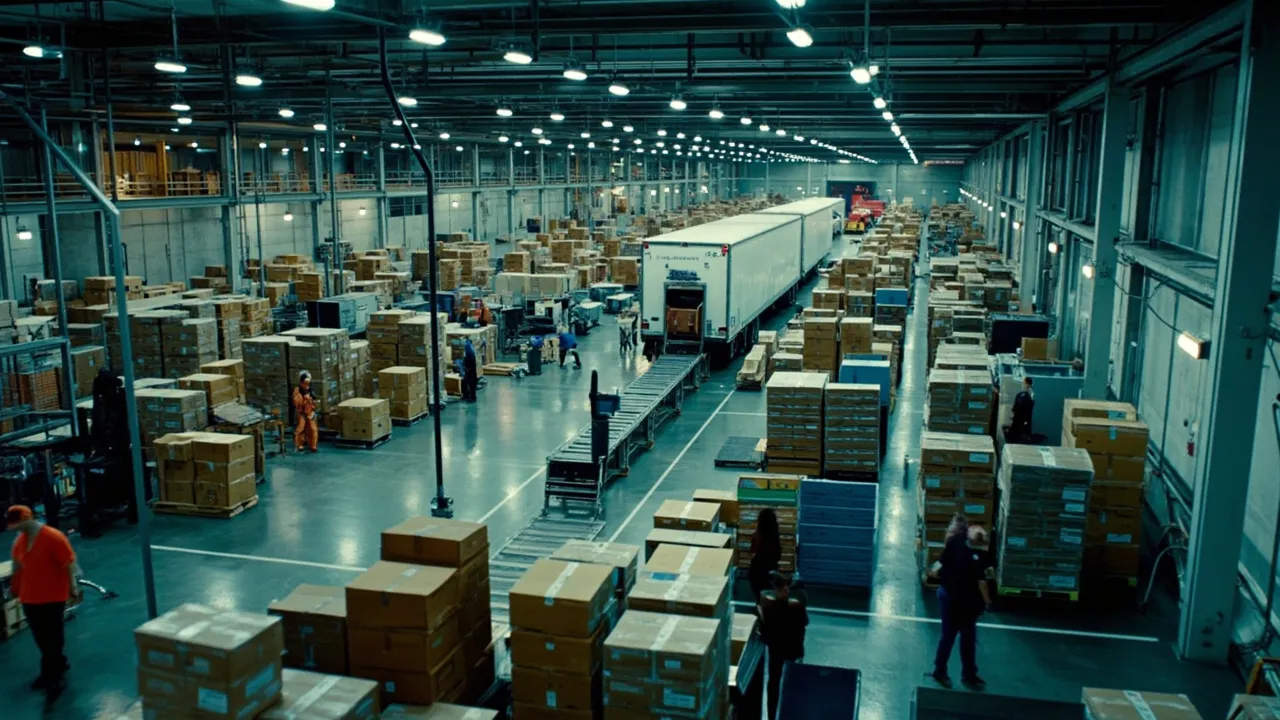
Robot counts are irresistible in warehouse automation announcements. They are also a weak buying metric. A fleet of 200 autonomous mobile robots can be a breakthrough or an expensive traffic jam, depending on how well the operation assigns work, balances zones, handles exceptions, and protects carrier cutoffs.
For teams evaluating Locus Robotics or another AMR platform, the real question is not how many robots have been deployed elsewhere. It is whether the proposed system can orchestrate people, inventory, orders, and transportation constraints inside your building. That requires a pilot benchmark built around completed orders and service outcomes.
The upside is meaningful. SupplyChainBrain reports that case studies of AI-driven AMRs and vision systems show throughput gains of roughly 25% to 40%, inventory and labor cost reductions of 15% to 30%, and picking accuracy of 99.5% to 99.9% in high-volume environments. Those ranges are promising—but they are not guaranteed results. Buyers need to reproduce the value under their own SKU mix, layout, labor profile, and cutoff schedule.
Start With Flow, Not Fleet Size
An AMR rarely completes an order by itself. It participates in a chain that includes order release, replenishment, worker assignment, picking, packing, quality checks, staging, and trailer loading. Optimizing one link can simply move the queue downstream.
Measure the pilot from order release to ship confirmation. Use a baseline period with comparable volume and product mix, then compare robot-assisted shifts against it. At minimum, track:
- Travel per completed unit: associate walking distance or travel minutes divided by shipped units, not merely robot miles.
- Picks per paid labor hour: include direct picking, replenishment, supervision, exception handling, and any temporary labor supporting the pilot.
- Congestion: minutes lost to blocked aisles, robot queues, crossing conflicts, and unavailable workstations.
- End-to-end cycle time: median and 95th-percentile time from release through pack and stage.
- Perfect-order rate: orders completed accurately, damage-free, documented, and before the applicable carrier cutoff.
Robot utilization belongs on the dashboard, but it is diagnostic rather than decisive. A robot can report high uptime while waiting for inventory, delivering work to an overloaded pack wall, or advancing low-priority orders while premium shipments miss departure.
Test the Orchestration Layer Under Stress
The pilot should include controlled stress cases instead of showcasing only a smooth average day. Change the order mix, close an aisle, remove a charging point, reduce staffing in one zone, inject rush orders, and create a short pick. Record how quickly the platform identifies the constraint, reprioritizes work, and restores flow.
This matters because modern automation is becoming a shared system rather than a collection of isolated machines. A separate SupplyChainBrain analysis says automation-savvy operations coordinate routes, charging, and human handoffs through one orchestration layer. It recommends 30-, 60-, and 90-day pilot reviews covering safety, quality, and throughput. It also points to standards such as VDA 5050 and the MassRobotics AMR Interoperability Standard as ways to reduce lock-in and support mixed fleets.
Use those reviews to calculate exception recovery time: the interval from an event occurring to normal flow resuming. Separate the clock into detection, assignment, response, and resolution. That makes it clear whether delays originate in robot software, WMS logic, inventory accuracy, labor availability, or unclear ownership.
Connect Warehouse Results to Carrier Cutoffs
A warehouse can post a strong picks-per-hour number and still disappoint customers. If orchestration releases work without regard to promised ship date, pack capacity, dock congestion, or carrier departure, local productivity masks service failure.
Every pilot order should therefore carry its service level, promised ship date, carrier, planned departure, and latest completion time. The task engine should consume those constraints when prioritizing work. The benchmark should then report cutoff attainment by service level and order type, including the number of orders expedited or manually rescued.
The key distinction is between robot uptime and order completion reliability. Uptime asks whether the machine was available. Reliability asks whether the coordinated system produced the right shipment before the deadline. Buyers should contract around the second outcome while retaining the first metric for root-cause analysis.
Build an Auditable Pilot Data Set
Claims cannot be compared if each vendor defines productivity differently. Before launch, establish an event dictionary shared by the WMS, labor-management system, AMR platform, and transportation system.
Capture timestamps for order release, task creation, robot assignment, associate acceptance, arrival, pick confirmation, exception opening and closure, pack completion, staging, tender, and ship confirmation. Add stable identifiers for the order, task, worker role, robot, location, SKU, wave, carrier, and cutoff. Record planned and actual travel, queue time, charge state, and reason codes for every manual intervention.
Keep the raw events. A daily summary cannot reveal whether a productivity gain came from easier orders, deferred replenishment, extra supervisors, or excluded downtime. Normalize results by order lines, units, cube, SKU velocity, and labor hours. Compare medians with tail performance because the slowest 5% of orders often determine whether a truck waits or leaves.
Seasonal flexibility deserves its own trial. Ask the team to add a temporary pick zone, change priorities, and raise volume without redesigning the entire workflow. Measure configuration hours, training time, stabilization time, and service degradation. A system that performs brilliantly after weeks of tuning may be less valuable than one that adapts safely in a day.
Turn the Benchmark Into a Buying Decision
Set pass/fail thresholds before the pilot begins. A practical scorecard might weight perfect-order and cutoff performance most heavily, followed by labor productivity, exception recovery, safety, congestion, and reconfiguration time. Require vendors to disclose assumptions and show the event-level evidence behind each result.
The winning system is not necessarily the one with the highest peak pick rate or the largest reference fleet. It is the one that produces repeatable end-to-end service under realistic variability, exposes why performance changes, and can exchange events cleanly with the rest of the operation.
CXTMS connects transportation deadlines and execution events to the warehouse workflows that feed them, giving teams a clearer view of whether automation is improving shipped-order performance—not merely robot activity. Request a CXTMS demo to build carrier cutoffs, exceptions, and fulfillment milestones into one operational control loop.