Lenovo Regional Manufacturing: How to Measure the Freight Value of Production Localization

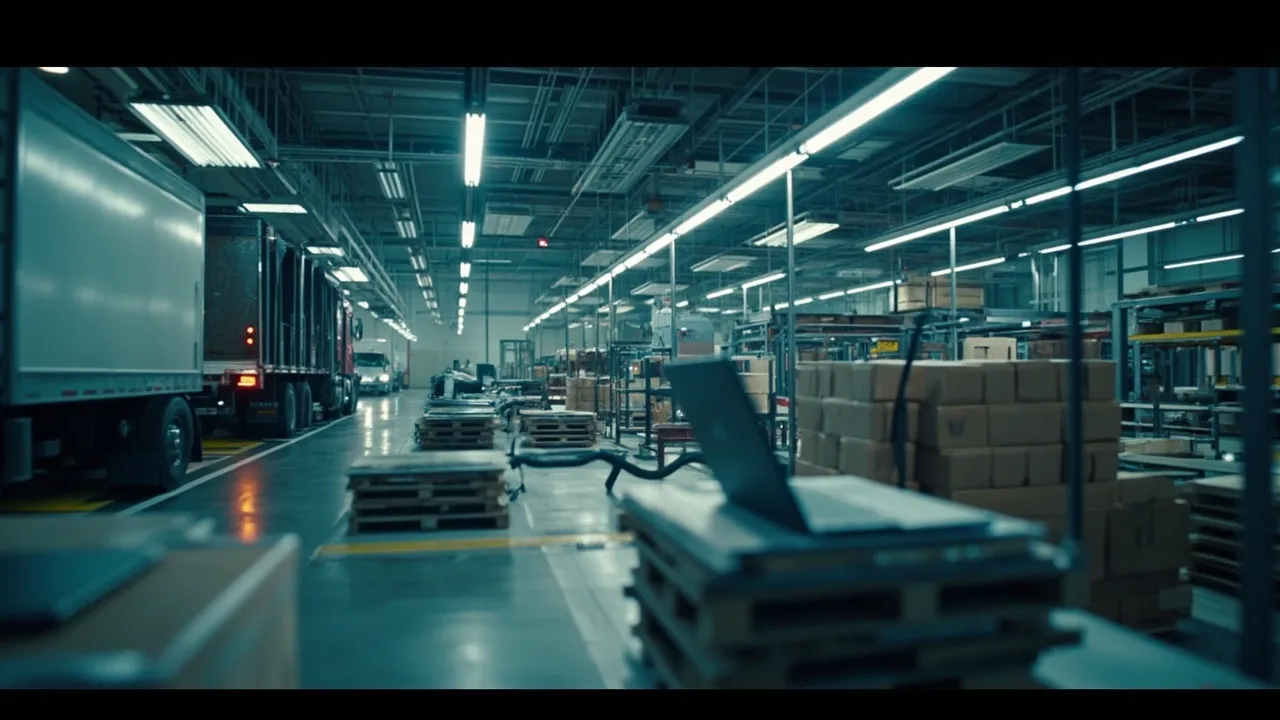
Lenovo's expanding regional manufacturing footprint offers a useful lesson for logistics leaders: moving final production closer to customers does not automatically localize the supply chain. The freight value comes from changing the cost, speed, and risk profile of the entire product flow—not simply placing a factory on a different map.
The company is doubling capacity at its U.S. manufacturing plant and beginning production at a Saudi Arabia campus, according to Supply Chain Dive. Those moves can shorten finished-goods routes and create more regional options. Yet computers, servers, and smartphones still depend on globally concentrated semiconductors, displays, memory, batteries, and specialized assemblies.
For freight teams, the right question is therefore not, "How close is the plant to the customer?" It is, "How much cost and exposure did the new network actually remove?"
Regional production changes the freight equation
Localization shifts freight rather than eliminating it. A finished laptop that previously crossed an ocean may now move by domestic truck from a regional plant. At the same time, dozens of component flows may still arrive internationally by ocean or air.
That trade can still be valuable. Regional final assembly can reduce finished-goods inventory in transit, improve replenishment speed, and postpone product configuration until demand becomes clearer. A manufacturer may ship common components in economical bulk, then configure keyboards, memory, storage, power supplies, or software for the destination market near the customer.
The network can also respond faster when demand shifts among product families. Instead of committing finished units to a forecast several weeks before arrival, planners retain flexibility later in the cycle. This postponement value should appear in the business case alongside conventional transport savings.
But inbound complexity matters. A regional plant supplied by many long-distance component lanes can exchange one visible finished-goods route for a web of smaller, time-sensitive inbound routes. If one low-cost part stops the line, expedited airfreight can quickly erase the savings from shorter outbound delivery.
Lenovo's footprint illustrates both opportunity and dependency
Lenovo already operates at global scale. Reuters reported that the company had more than 30 factories across nine markets while China remained its primary manufacturing base. Reuters also reported that the Saudi facility was expected to produce PCs, laptops, smartphones, and servers beginning in 2026.
That structure creates regional capacity without pretending every upstream tier can be replicated locally. Semiconductor fabrication and many electronics subcomponents remain capital-intensive and geographically concentrated. Regional assembly may reduce the distance traveled by finished devices, but it cannot remove exposure to chip allocation, supplier shutdowns, international trade rules, or capacity constraints at critical gateways.
The practical advantage is optionality. Multiple qualified production points give planners more ways to route demand when tariffs change, a lane is disrupted, or regional demand accelerates. The value grows when product specifications, supplier approvals, and transportation contracts allow volume to move among those sites without a lengthy requalification process.
Build the localization case on total landed cost
Freight cost per unit is only the starting point. A useful comparison should calculate total landed cost for both the current and proposed network, including:
- inbound component transport by mode and origin;
- outbound finished-goods transport and final distribution;
- duties, tariffs, brokerage, and rules-of-origin compliance;
- inventory carrying cost for pipeline stock and buffers;
- premium freight caused by shortages or production interruptions;
- handling, packaging, and transfer costs at each additional node;
- expected disruption losses and recovery costs.
This broader accounting prevents an attractive outbound saving from hiding more expensive inbound flows. It also makes scenario testing possible. A plant may look marginal under normal rates but become valuable when an ocean route is disrupted, tariffs increase, or demand requires a shorter response time.
McKinsey's 2025 supply chain risk survey found that among respondents facing tariff impacts, 45% were increasing inventories, 39% were pursuing dual sourcing, and 33% were developing nearshore suppliers. Those actions show why localization should be evaluated as part of a portfolio of risk controls. Inventory, sourcing, production, and transportation choices affect one another; evaluating them separately can double-count benefits or conceal new costs.
Use a five-part localization scorecard
A disciplined scorecard can convert the strategy into measurable freight outcomes.
1. Inbound component complexity
Track supplier count, origin countries, border crossings, mode mix, lead-time variability, and the share of parts with no approved substitute. Give special attention to components that can halt production even though they represent little unit cost.
2. Finished-goods distance and service
Measure door-to-door miles, average and 95th-percentile lead time, on-time-in-full performance, and inventory days in transit. The tail of the lead-time distribution often matters more than the average because buffers are sized for variability.
3. Trade exposure
Model duties and tariffs by product classification and origin, then test plausible policy changes. Include the operational cost of documentation, origin verification, and customs holds—not only the published duty rate.
4. Recovery capability
Estimate how quickly the network can shift production and transport after a disruption. Record alternate suppliers, qualified lanes, available plant capacity, tooling constraints, and the time required to approve a new routing.
5. Financial and service value
Combine landed cost with revenue protection. Faster replenishment can reduce lost sales, improve product availability, and lower markdown risk. Those service benefits should be explicit rather than buried in a qualitative resilience claim.
Let freight data validate the factory strategy
Regional manufacturing is not a binary choice between global and local supply chains. It is a network design decision that can shorten selected flows while preserving global sourcing where capability and economics require it.
The strongest localization programs connect plant strategy to shipment-level evidence. TMS data can reveal whether inbound variability is rising, premium freight is increasing, regional outbound lead times are improving, and tariff assumptions match actual landed cost. It can also expose lanes where a theoretically local product still travels through an unnecessarily complex route.
Lenovo's expansion is a timely reminder: factory geography creates the opportunity, but freight execution determines whether the opportunity produces savings and resilience.
Want to measure localization scenarios with real transportation data? Request a CXTMS demo to model landed cost, lane performance, and freight risk across your network.