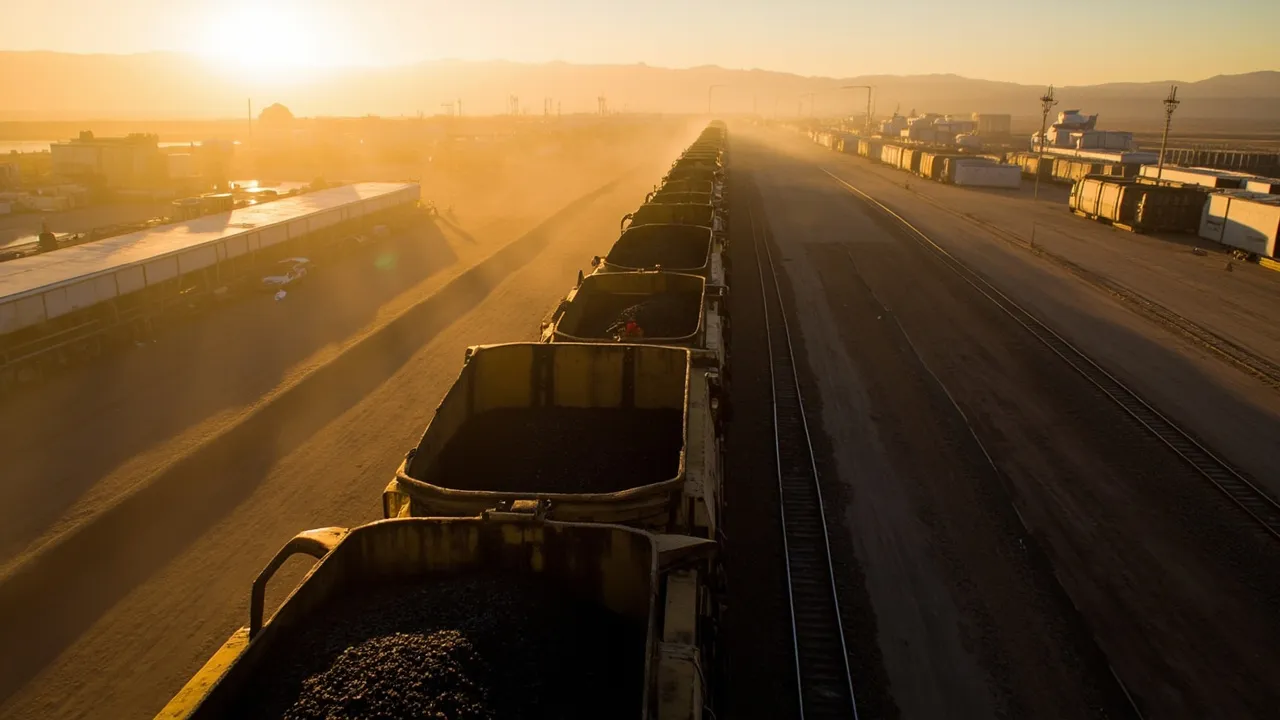
Falling Railcar Demand: How Shippers Can Read the Equipment-Capacity Cycle

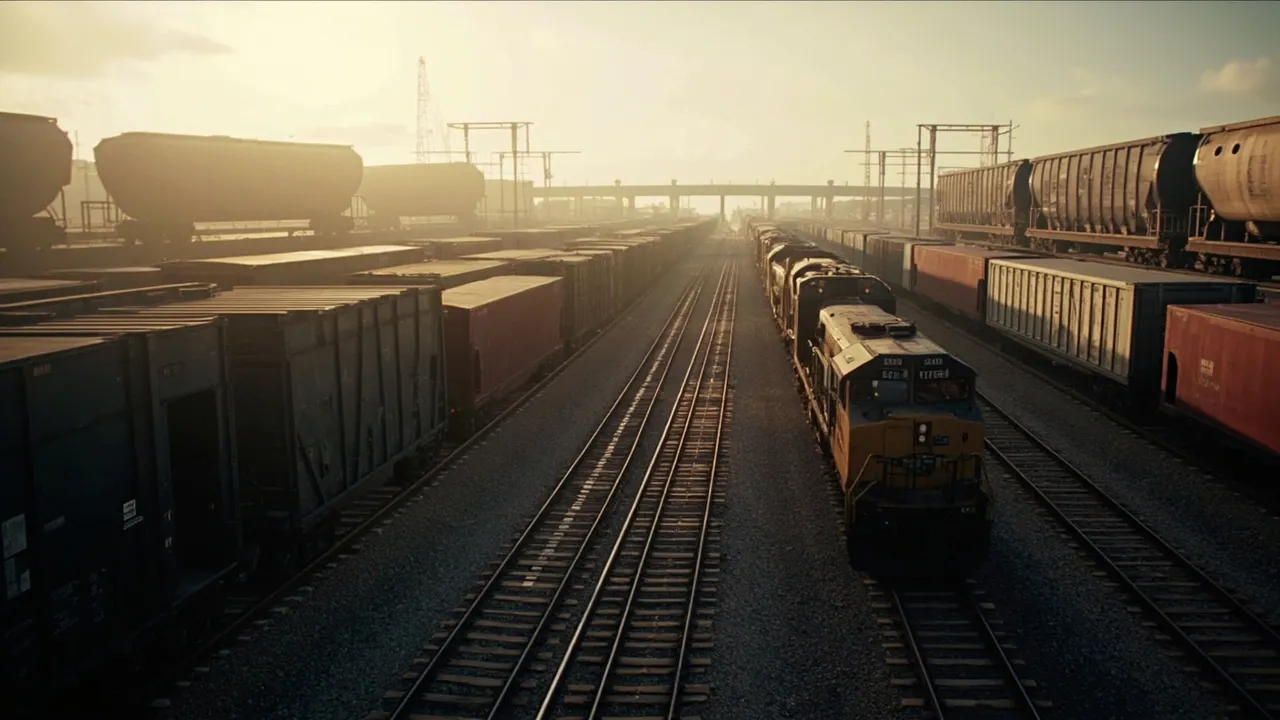
Railcar demand is weakening, but that does not automatically mean every shipper can find the right car in the right lane at an attractive price. The rail equipment market is a collection of specialized fleets, regional imbalances, lease structures, and commodity cycles. A decline in new-car orders may signal a broader cooling trend while covered hoppers, tank cars, or gondolas remain tight for particular customers.
That distinction matters now. Greenbrier's latest results offer an early signal that the manufacturing cycle has slowed. Yet current rail traffic data shows that freight demand has not disappeared. Shippers should treat the divergence as a reason to improve equipment planning—not as a blanket instruction to cut fleet commitments.
What the manufacturer data is saying
FreightWaves reported that Greenbrier received orders for 3,400 new railcars valued at $600 million during its fiscal fourth quarter and delivered 3,600 units. Its year-end backlog stood at 14,000 cars worth an estimated $2.1 billion. The company's operating margin narrowed to 4.3% from 5.5% in the preceding quarter, while manufacturing gross margin slipped to 9.2% from 9.9%.
Those figures point to a market moving away from the stronger replacement cycle seen two years earlier. In fiscal 2024, Greenbrier recorded 21,700 orders and 23,700 deliveries, ending that year with a backlog of 26,700 units valued at $3.4 billion. Compared with that benchmark, the latest backlog is nearly half as large by unit count.
For shippers, however, manufacturer results are a leading indicator rather than a direct measure of usable capacity. New-car demand can fall because lessors are cautious, financing costs are elevated, or fleet owners already placed replacement orders. None of those conditions guarantees that a food-grade covered hopper or pressure tank car will be available where and when a shipper needs it.
Traffic can rise while equipment orders fall
The demand picture is not uniformly weak. Logistics Management reported that U.S. railroads originated 232,120 carloads in the week ending October 17, up 3.5% year over year. Intermodal volume reached 308,015 containers and trailers, an annual increase of 12.6%.
This apparent contradiction reflects different time horizons. Weekly traffic measures freight moving now; railcar orders reflect expectations for several years of utilization and asset returns. Intermodal growth also has limited relevance to the supply of specialized freight cars. A shipper can therefore see healthy network volume, weaker factory orders, and tight equipment availability at the same time.
The practical lesson is to analyze capacity by car type, commodity, origin region, and season. Aggregate fleet counts obscure whether cars are serviceable, clean, properly lined, approved for the commodity, and positioned near the loading point.
Six indicators belong on one dashboard
A reliable rail equipment view should combine six measures:
- Orders: Track quarterly orders by car type, not only the headline total. Sustained order weakness can foreshadow tighter replacement supply several years later.
- Deliveries: Compare deliveries with orders. Deliveries exceeding orders generally reduce the backlog and indicate that factories may have more open production capacity.
- Lease rates: Monitor renewal quotes, term lengths, escalation clauses, and maintenance responsibility. Lease pricing may reveal scarcity before manufacturing data does.
- Storage: Rising stored-car counts can indicate excess capacity, but location and condition matter. A stored car hundreds of miles away may require inspection, repair, cleaning, and repositioning before it becomes usable.
- Utilization: Measure loaded trips, empty miles, dwell, and days per cycle for the shipper's own fleet. Poor turns can create an apparent shortage even when the contracted fleet is large enough.
- Railroad velocity: Watch terminal dwell and train speed alongside equipment data. Faster cycles release effective capacity; slower service traps cars in transit and increases the fleet needed for the same volume.
No single metric should trigger a major commitment. The useful signal comes from the combination. Falling lease rates, growing storage, improving velocity, and a shrinking order backlog together support a buyer-friendly interpretation. If storage rises but dwell also increases and lease quotes remain firm for a specific car type, the market may only look loose at the headline level.
Turn market signals into decision triggers
Shippers can translate the dashboard into explicit actions instead of renegotiating equipment reactively.
Lease when projected loaded demand consistently exceeds available fleet capacity and lease pricing remains below the operational cost of spot substitutions, production interruptions, or premium repositioning. Favor staggered expirations so the entire fleet does not reprice in one market window.
Extend contracts when a specialized car type remains highly utilized, railroad velocity is stable, and replacement lead times are long. An early extension can protect continuity without committing to new equipment.
Redeploy cars when one lane's utilization weakens while another faces shortages. Before ordering more equipment, model whether reducing empty miles or changing pool rules can cover the gap.
Postpone commitments when orders and backlogs are falling, stored inventories are rising, lease quotes are softening, and forecast demand remains uncertain. A delay of one or two quarters can improve negotiating leverage, provided the shipper maintains contingency capacity.
Manage the cycle with better operational data
The biggest mistake is treating the railcar cycle as a procurement-only issue. Equipment decisions depend on shipment forecasts, customer orders, commodity requirements, lane performance, free-time rules, maintenance events, and railroad service. When those records live in separate spreadsheets, planners cannot distinguish a structural capacity shortage from a utilization problem.
CXTMS brings shipment execution and performance data into one operational view, helping logistics teams track cycle time, exceptions, lane demand, and asset utilization before making long-term capacity commitments.
Request a CXTMS demo to see how connected transportation data can support smarter rail and multimodal planning.