China Captured $45B in Clean-Industry Investment—Map the Supplier Capacity Behind the Headline

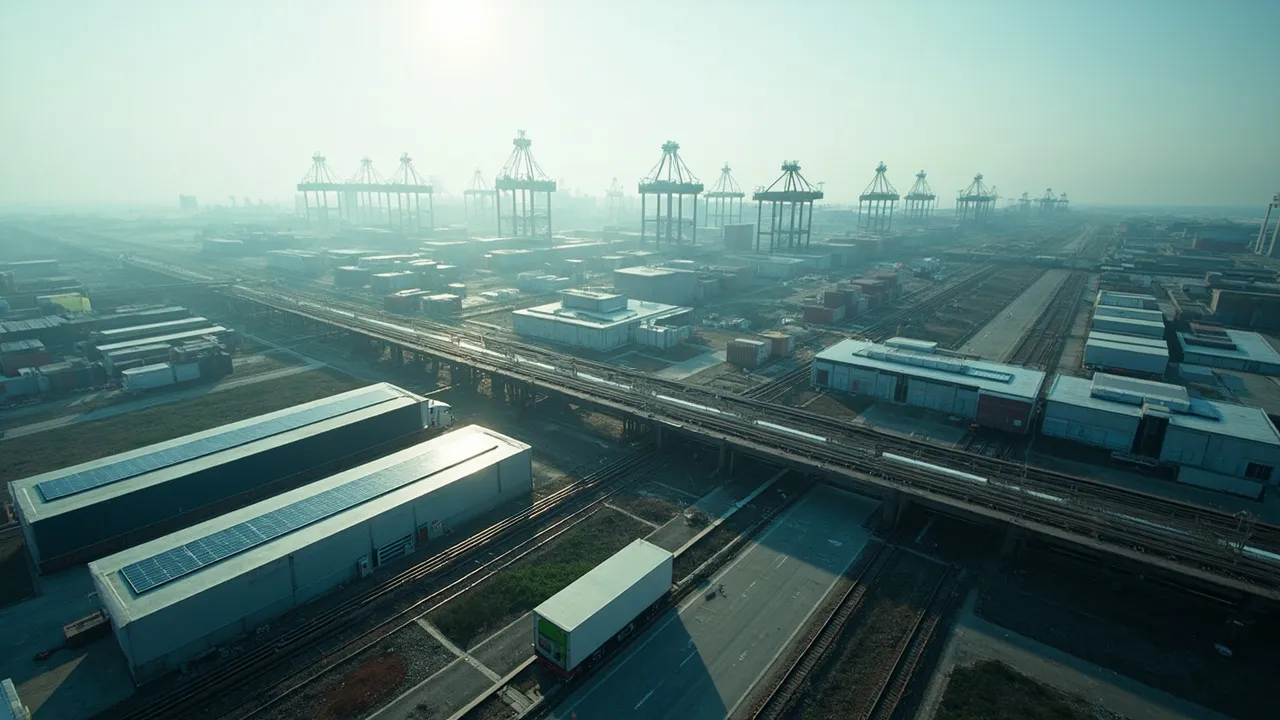
China secured $45 billion in clean-industry investment in 2026 and now hosts 49% of the world's clean industrial plants that are operating or under construction, according to Reuters reporting on a Mission Possible Partnership investment tracker. Those numbers confirm China's extraordinary industrial gravity. They do not, however, tell a procurement or logistics team how much dependable output will reach its production line.
That distinction matters. Investment announcements describe capital intent. Supply-chain resilience depends on qualified equipment, stable yields, available inputs, utility reliability, export clearance, and transport capacity. A factory can appear in an investment database years before it becomes a dependable source of export-ready material.
The practical response is not a vague mandate to “de-risk China.” It is a supplier-capacity map that connects every critical plant to the dependencies that determine usable output.
Start With Capacity States, Not a Factory Count
A clean-industry project should move through defined states in the supplier master: announced, financed, under construction, equipment installed, commissioning, customer-qualified, ramped, and export-ready. Recording one headline nameplate figure without the state creates false confidence.
For every site, capture nameplate capacity, demonstrated monthly output, yield, current utilization, committed customer allocations, and the share approved for the relevant product specification. The number procurement needs is available qualified capacity, not the figure in a press release.
For example, a battery-material plant rated for 100,000 metric tons annually may be commissioning one line, producing at an 80% yield, and allocating most acceptable output to contracted domestic customers. Its theoretical capacity may look substantial while the volume available to a new overseas buyer remains small.
Add dates and evidence to every status. Supplier declarations, completed audits, sample approvals, production records, and shipment history should carry more weight than an announced start date.
Map the Dependencies Behind Tier-One Plants
The useful map extends beyond a tier-one supplier's address. Each plant should connect to five dependency layers:
- Production equipment: Identify proprietary furnaces, coating lines, robotics, tooling, and spare parts. Record the original equipment manufacturer, service location, replacement lead time, and whether a single specialist performs maintenance.
- Critical materials: Trace cathode inputs, lithium chemicals, graphite, rare-earth magnets, polysilicon, specialty gases, and process chemicals to processors—not merely distributors. Deloitte notes that China processes 80% of the minerals used in lithium-ion batteries, illustrating how concentration can persist several tiers upstream.
- Utilities: Capture electricity demand, grid connection, backup generation, water source, industrial-gas supply, and curtailment history. A nominally independent second factory drawing power and water from the same constrained system is not a true alternative.
- Outbound gateways: Map road and rail corridors, consolidation warehouses, ports, container availability, dangerous-goods capability, and feasible alternates. Include cutoffs, sailing frequency, transit variability, and seasonal disruption history.
- Trade controls: Link product classification, licenses, origin documentation, duties, export restrictions, and destination rules to the affected part numbers. Regulatory availability is a component of capacity.
This dependency view often reveals that two suppliers share the same mineral refiner, tooling company, substation, or port. On a flat vendor list they look diversified; on a network map they form one risk cluster.
Separate Installed Output From Export-Ready Output
Clean-tech manufacturing has exacting qualification requirements. A new line may be mechanically complete yet unable to meet purity, consistency, traceability, or customer validation thresholds. Supplier scorecards should therefore report four numbers separately: installed capacity, demonstrated good output, qualified output, and unallocated export-ready output.
The distinction is especially important as industrial policy and trade rules change. China's upstream strength begins in mineral processing and extends through components and finished equipment. McKinsey's analysis of geopolitical supply chains observes that China leads the processing of nearly every critical mineral and has used export controls on selected materials. A line can be productive while a particular grade, precursor, or destination remains unavailable.
Test export readiness with actual transactions. Confirm that the supplier can produce compliant documents, secure equipment, book the appropriate carrier, clear the shipment, and deliver within the promised variability band. A successful pilot shipment is stronger evidence than a questionnaire response.
Set Dual-Source Triggers by Recovery Time
Not every component deserves the same buffer or sourcing effort. Prioritize items by time to recover, revenue exposure, substitutability, and dependency concentration.
Long-recovery items—including custom power electronics, large castings, specialized magnets, production tooling, and qualified battery materials—need early dual-source action. Define measurable triggers such as:
- qualified available capacity falling below 120% of forecast demand;
- a supplier's yield or on-time dispatch missing threshold for two reporting periods;
- more than 50% of a component's output sharing one refiner, utility zone, or gateway;
- alternate-lane transit variability exceeding the inventory protection window;
- a new license, tariff, or export-control review affecting the part or an upstream material.
When a trigger fires, the response should already be assigned: accelerate alternate qualification, reserve capacity, reposition inventory, switch a port or mode, or redesign the component. For the longest-recovery parts, inventory targets should cover the time to detect a failure, decide, qualify an alternate, manufacture, and transport—not just average supplier lead time.
Turn the Map Into an Operating System
A capacity map loses value if it becomes an annual spreadsheet exercise. Procurement, quality, production, trade compliance, and logistics should review the same records on a fixed cadence. Supplier milestones, audit results, purchase orders, bookings, exceptions, and inventory positions need shared identifiers so teams can see when a plant-level event threatens customer commitments.
China's $45 billion investment signal is strategically important. The operational advantage comes from knowing which portion of that industrial base is qualified, available, exportable, and logistically reachable—and how quickly the network can respond when one dependency fails.
Want one view of supplier orders, freight execution, milestones, and exceptions? Request a CXTMS demo to see how logistics teams turn capacity signals into coordinated action.