Amazon’s Planned 1 Million-Square-Foot Connecticut DC Needs a Downstream Capacity Model

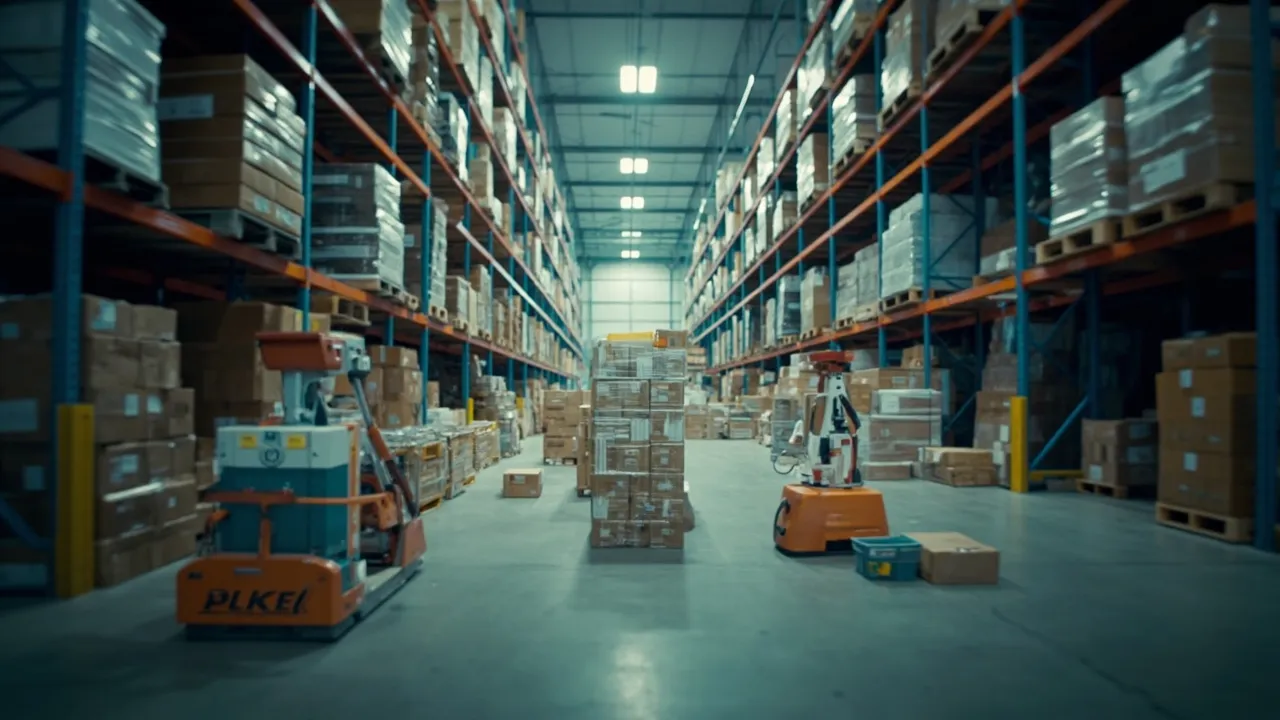
A million square feet of warehouse space looks like capacity. In a distribution network, however, floor area is only potential capacity. The real limit is the weakest connected operation: receiving, storage, pick-pack, outbound docks, middle-mile transportation, sortation, or local delivery.
That distinction matters for Amazon's proposed facility in Norwich, Connecticut. Supply Chain Dive reports that the project is in the early planning stage and has no announced opening date. The 1 million-square-foot building is expected to operate as a first-mile facility, storing bulk goods and picking, packing, and shipping them around the clock to downstream sortation and localized delivery centers.
The proposal is a useful network-design lesson for any shipper opening a large distribution center. A building should not receive its forecast volume merely because construction, systems, and staffing are ready. Volume must be released only when every downstream dependency can absorb it.
Model the node as part of a flow, not an island
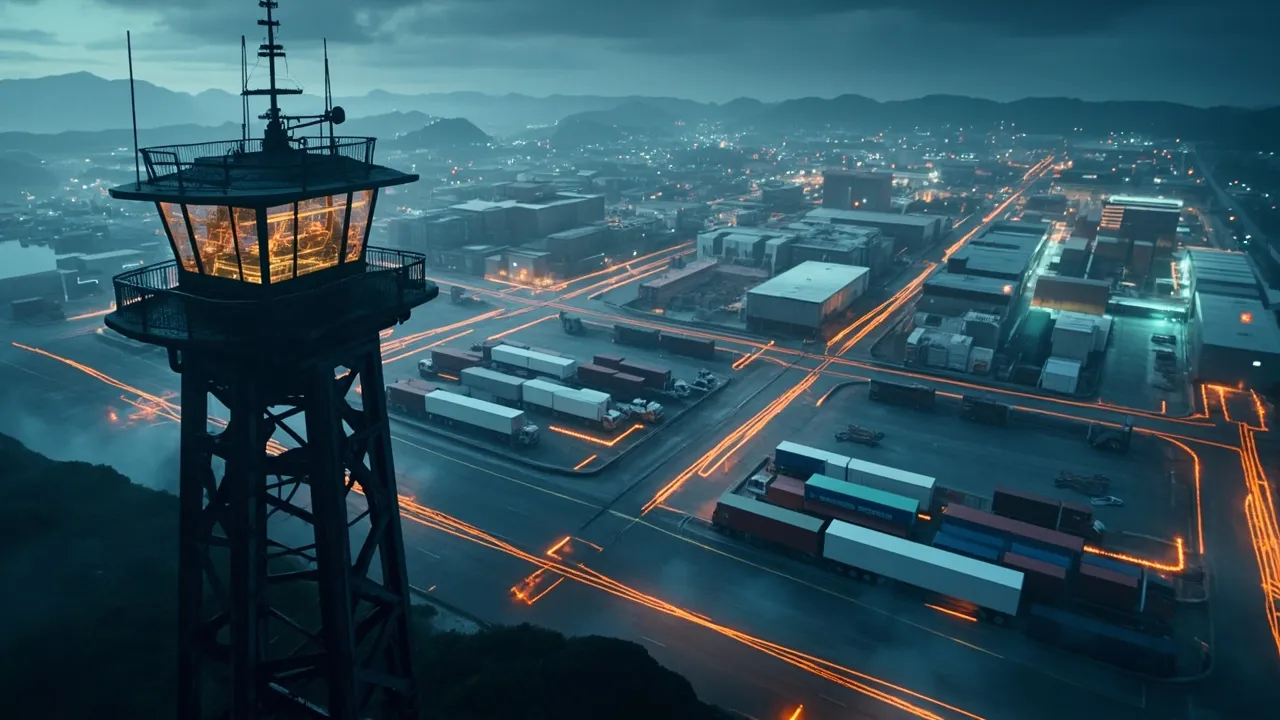
The Norwich operation would sit upstream of at least two other layers. Product leaving the site would move to middle-mile sortation centers, then into last-mile facilities that support customer delivery. Increasing output at Norwich therefore creates arrivals, handling work, trailer demand, door occupancy, and route volume somewhere else.
Start the capacity model with units per hour at each handoff. For every product family and destination, map:
- inbound receipts, storage locations, replenishment, and inventory dwell;
- pick and pack rates by shift, including automation availability;
- outbound staging positions, dock doors, trailer pools, and gate capacity;
- linehaul departures, scheduled transit time, and arrival windows;
- sort-center induction, processing, and dispatch capacity; and
- local delivery-center space, vehicles, routes, and driver hours.
The model must preserve time. A downstream center that can process 80,000 units per day is not necessarily able to receive a 20,000-unit wave in one hour. Hourly peaks, cutoff times, labor breaks, equipment downtime, and yard congestion determine whether nominal daily capacity is usable.
Scenario testing should include a normal day, promotional peak, delayed inbound wave, automation outage, weather disruption, and one constrained downstream node. If the plan works only when every assumption is on target, it is not a launch plan; it is a best-case illustration.
Put measurable gates ahead of volume
A phased ramp protects the network from converting an upstream success into downstream failure. Each phase should have entry and exit criteria, an owner, an observation period, and a rollback threshold.
Inventory accuracy is the first gate. The warehouse cannot reliably promise output when its system record and physical stock disagree. Measure receipt accuracy, putaway accuracy, location accuracy, order fill rate, and the age of unresolved discrepancies. Inbound Logistics identifies inventory accuracy, receiving cycle time, receiving backlog, putaway accuracy, storage utilization, order accuracy, and on-time delivery as core warehouse measures. Those metrics should be tested by zone and shift, not hidden inside a building-wide average.
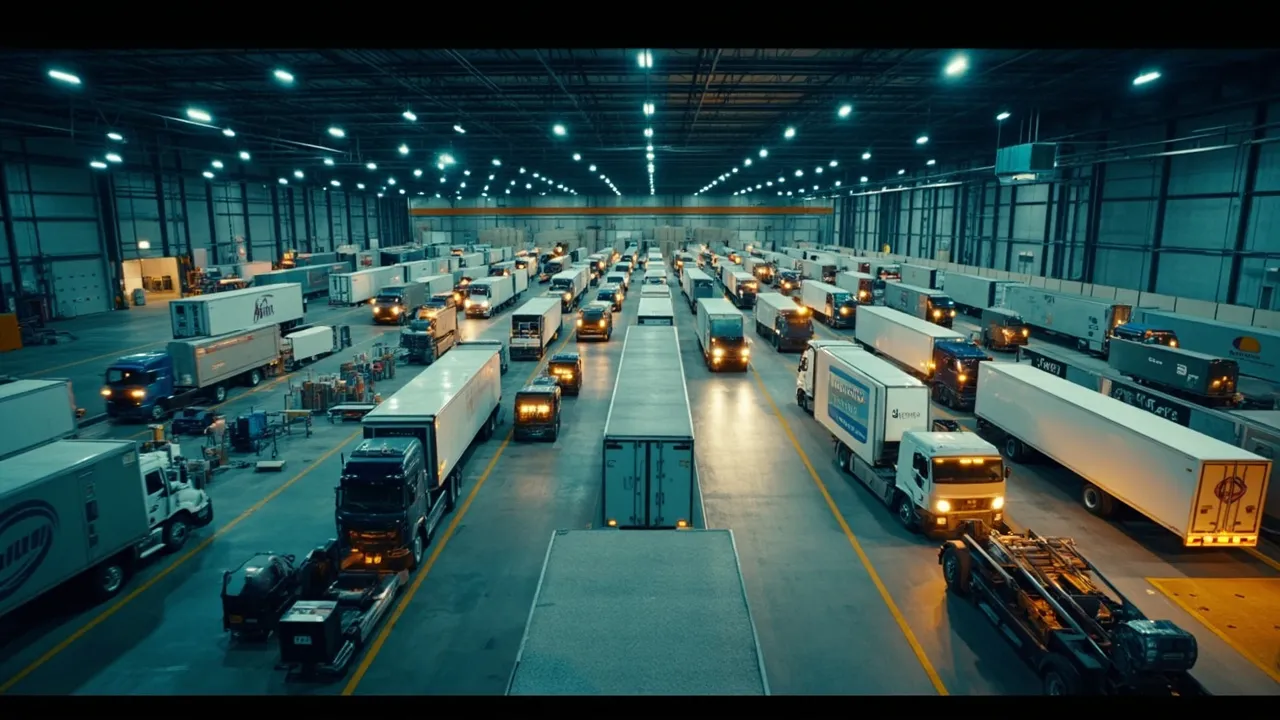
Trailer turns and dock flow form the second gate. Track gate-to-door time, live-load duration, door occupancy, dropped-trailer dwell, on-time departure, and loads rolled to a later schedule. A facility operating 24/7 can spread work across more hours, but only if carriers, yards, and receiving sites can use those hours. Extending operating hours has been shown to double or triple door availability in some settings, according to an Inbound Logistics examination of transportation capacity, but availability is not the same as coordinated demand.
Labor is the third gate. Measure planned versus filled hours, new-hire learning curves, units per paid hour, overtime, safety incidents, and absenteeism. Do not approve the next volume step based on one strong shift while another shift depends on overtime or supervisors doing production work.
Downstream capacity is the final gate. Each receiving center needs a forecast of arrivals by hour, cube, unit count, service class, and required dispatch window. Monitor induction backlog, missed connection rate, sort completion, route overflow, and next-day carryover. The upstream node should advance only when downstream centers sustain their thresholds through the agreed observation window.
Use the TMS to control the ramp
The transportation management system should translate the capacity plan into executable lanes and commitments. Before launch, create origin-destination lanes for each downstream center, including transit standards, departure schedules, equipment types, dock appointments, primary carriers, backup carriers, and expected volume bands.
Do not award the final steady-state volume on day one. Stage carrier commitments by ramp phase. For example, an initial phase might use a limited set of destinations and departures, with protected backup capacity. The next phase can add lanes only after tender acceptance, on-time pickup, trailer dwell, and destination receipt performance stay within thresholds.
Every tender should carry a ramp phase and forecast version. That lets planners compare committed volume with actual shipments and distinguish a demand miss from an execution failure. Capacity alerts should trigger before release when projected loads exceed a sort center's hourly limit, a carrier's commitment, a destination's appointment supply, or the available trailer pool.
The same data supports controlled recovery. If one downstream facility accumulates backlog, the TMS can hold non-urgent releases, change departure waves, activate a backup carrier, or redirect eligible inventory to another node. The decision and its cost remain attached to the shipment instead of disappearing into email and spreadsheets.
Make network throughput the launch objective
The wrong opening-day question is, “How much can the new building ship?” The better question is, “How much can the entire connected network deliver without creating backlog, service failures, or unsustainable cost?”
Norwich may eventually become a major first-mile node, but its million square feet will create value only when storage, pick-pack, transport, sortation, and last-mile operations rise together. A downstream capacity model makes that dependency visible, while phased gates prevent ambition from outrunning evidence.
Planning a distribution-center launch or network expansion? Request a CXTMS demo to see how lane plans, carrier commitments, appointments, and shipment exceptions can support a controlled ramp.