Georgia-Pacific’s 274,000 Yard Moves Need an Event-Quality Score

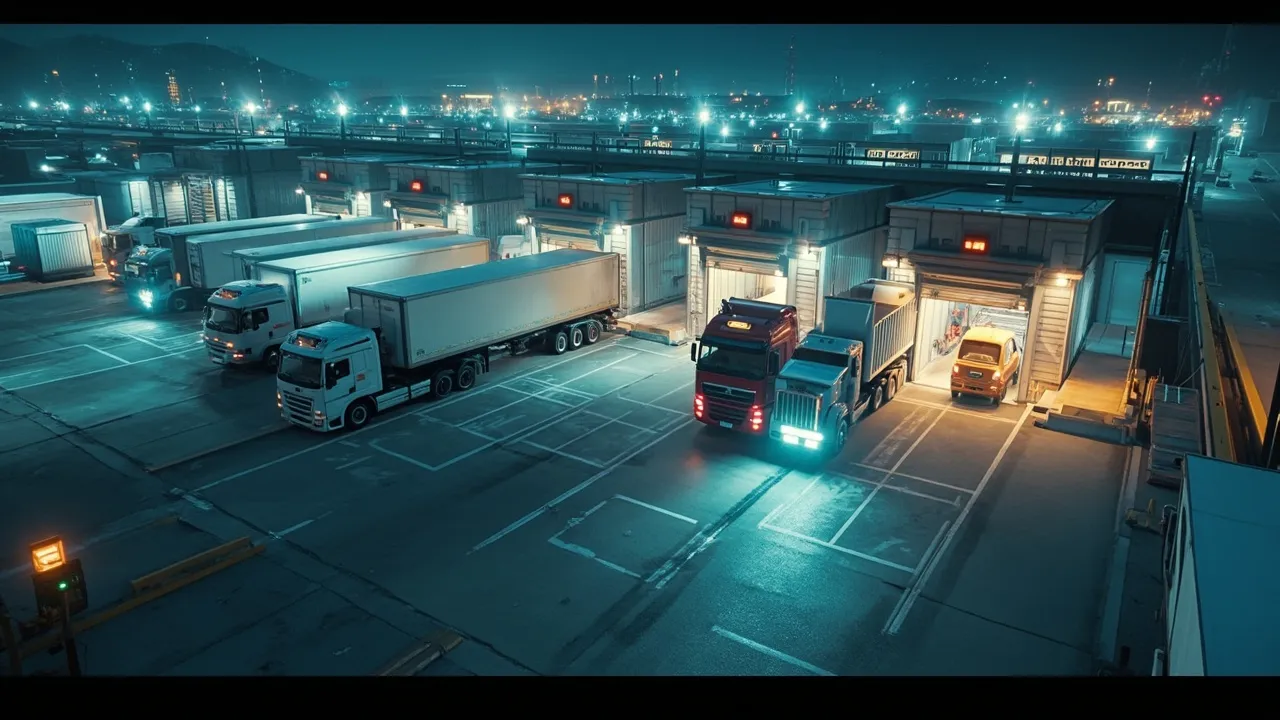
A yard management system can show every trailer as a colored icon on a map. That does not mean the map is true.
Georgia-Pacific offers a useful picture of the scale involved. Across its live sites in 2026, the company recorded more than 114,000 driver check-ins and tracked approximately 274,000 spotter and equipment moves, according to SupplyChainBrain’s account of its yard-management automation. At that volume, even a small rate of stale locations, missing timestamps, or duplicate moves can create thousands of misleading records.
The next maturity step is therefore not simply collecting more yard data. It is measuring whether each operational event is complete, timely, consistent, and trustworthy enough to drive the next decision. Every automated yard needs an event-quality score.
Network scale magnifies small data defects
Yard automation replaces radio calls, spreadsheets, paper logs, and visual searches with structured workflows. Drivers can check in digitally, dispatchers can prioritize moves, spotters receive instructions, and dock teams gain a shared view of equipment. Those benefits depend on a sequence of events remaining intact.
Suppose only 1% of 274,000 move records have a material defect. That still produces about 2,740 questionable events. A trailer shown at the wrong door may trigger an unnecessary search. A completion without a timestamp may inflate dwell. A duplicated request can send two spotters toward the same equipment. A missed release can make usable capacity appear occupied.
The operational impact spreads quickly because yard systems increasingly connect with transportation, warehouse, appointment, and gate processes. Logistics Management describes modern YMS capabilities as extending beyond basic tracking to dock scheduling, real-time asset visibility, AI-enabled vision, and WMS and TMS integration. When one event feeds several systems, its errors travel too.
Define the authoritative yard-event chain
Quality control starts with an explicit event model. Each event should identify the facility, trailer or container, shipment, carrier, actor or device, location, event type, source system, and occurrence time. The record should distinguish when something happened from when the platform received it.
Seven events form a practical minimum:
- Arrival: The vehicle enters a defined facility boundary or reports an accepted arrival signal.
- Gate-in: Identity, appointment, equipment, and security checks are completed and the driver is admitted.
- Location assignment: The equipment receives a valid yard slot, staging area, or dock position.
- Move request: A prioritized instruction identifies the equipment’s origin, destination, reason, and required completion window.
- Move completion: The spotter confirms the equipment reached the intended destination, ideally with location validation.
- Dock assignment or release: The door becomes reserved, occupied, cleared, and available through separately timestamped state changes.
- Gate-out: Equipment identity, shipment status, driver authorization, and departure time are confirmed.
Each transition needs one authoritative source. A gate kiosk may own gate-in, while a spotter application owns move completion and a dock workflow owns door release. If two systems can independently create the same event, the integration needs precedence and deduplication rules.
Score completeness, latency, consistency, and confidence
An event-quality score should be understandable to operators, not hidden inside a technical health dashboard. A 100-point model can combine four dimensions:
- Completeness: Are all required fields and predecessor events present?
- Latency: Did the event arrive soon enough to influence the next action?
- Consistency: Do asset, location, shipment, appointment, and status records agree across connected systems?
- Confidence: Was the event verified by a reliable device or workflow, or entered later as an unconfirmed correction?
Weights should reflect operational risk. A missing move reason may reduce analytical value but not stop work. An unknown trailer location should carry a severe penalty because it can invalidate dispatch decisions. The system can quarantine low-scoring events, request confirmation, or prevent downstream automation until the conflict is resolved.
Quality should also be visible by site, shift, event type, source, and integration. A network average can conceal a gate scanner that fails during rain, a night shift that records moves after the fact, or one facility using free-text location names. Trends are more useful than a single score: falling latency at one site may warn of connectivity or adoption problems before dwell time rises.
Detect the failure patterns operators already know
Four defects deserve continuous monitoring.
Stale locations occur when a newer physical observation contradicts the system’s last confirmed position, or when an asset remains in a temporary location longer than the process allows. Set freshness thresholds by location and state rather than using one limit for the whole yard.
Duplicate moves appear when the same asset receives overlapping origin-destination requests or multiple completions inside an impossible interval. Match asset IDs, locations, time windows, and request lineage before counting activity.
Missing timestamps break dwell and productivity calculations. Require both occurrence and ingestion times, then flag events created out of sequence or after a shift closes.
Manual workarounds are not merely user behavior to suppress. Repeated overrides, radio dispatches, generic equipment IDs, and bulk end-of-shift updates often reveal a workflow that does not fit real operations. Track reason codes and repair the process behind the workaround.
Put data quality beside operating KPIs
Traditional yard measures remain essential: gate cycle time, trailer dwell, moves per spotter hour, detention exposure, dock utilization, appointment adherence, and empty-trailer availability. But leaders should view each measure beside its supporting event quality.
A reported improvement in dwell is not credible if gate-out completeness declined. Higher move productivity may be artificial if duplicate completions increased. Strong dock utilization can mask doors that remain digitally occupied after physical release.
This context matters because genuine YMS gains can be substantial. Inbound Logistics reported one manufacturer achieved a 60% increase in trailer moves per hour and a 15% reduction in dwell time. Results of that magnitude deserve a clean audit trail connecting each KPI to verified events.
For every dashboard metric, publish the percentage of eligible events included, median reporting latency, exception rate, and number of corrected records. Operations teams can then separate a true performance change from a measurement change.
Make trustworthy events the foundation for automation
At 274,000 moves, supervisors cannot inspect every record. They should not have to. Rules can detect impossible sequences, score uncertainty, route exceptions, and preserve an audit trail while people focus on the cases that require judgment.
That is how yard visibility becomes dependable network intelligence. The objective is not a perfect database; it is a controlled process in which questionable events are identified before they assign a dock, dispatch a spotter, calculate detention, or distort planning.
CXTMS connects transportation workflows and operational milestones so logistics teams can manage exceptions with shared, traceable data. Request a CXTMS demo to see how stronger event governance can support more reliable execution across your freight network.