USDA's $1.3 Billion Fertilizer Buildout Needs an Inbound-to-Outbound Logistics Map

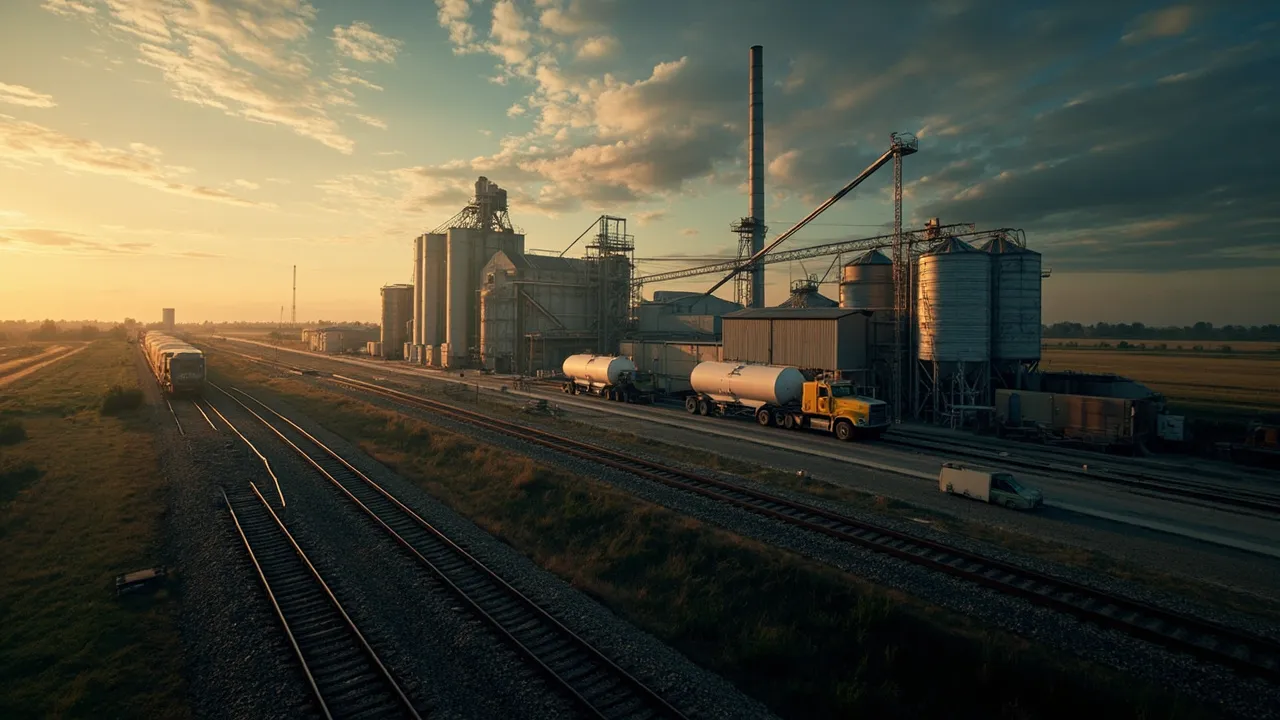
The next wave of domestic fertilizer capacity will be judged not only by what plants can produce, but by whether their supply chains can move inputs in and finished product out at the right time. The U.S. Department of Agriculture has announced support for eight fertilizer manufacturing projects representing more than $1.3 billion in investment, according to Supply Chain Dive.
That is a substantial manufacturing signal. It is also a network-design challenge. A fertilizer plant cannot operate as an isolated dot on a map. Each site depends on minerals, chemicals, energy, packaging, railcars, trucks, storage terminals, and distributors. On the demand side, product must reach agricultural regions during narrow seasonal windows rather than merely leave the factory on schedule.
Before these projects ramp, operators need an inbound-to-outbound logistics map that connects plant capacity with supplier readiness, transport constraints, storage space, and customer allocation.
Start with the complete inbound bill of flow
A bill of materials says what goes into the product. A bill of flow adds where every input originates, how it travels, how frequently it is replenished, and what can interrupt it.
The map should identify primary and alternate sources for phosphate rock, potash, sulfur, ammonia, acids, micronutrients, additives, pallets, bags, and bulk packaging. It should also show energy dependencies. Natural gas is especially important because, as Reuters explains, it powers the process used to synthesize most widely used ammonia fertilizers.
For every input, planners should record:
- Origin and supplier production capacity
- Contracted volume and replenishment frequency
- Primary mode, route, and border or interchange points
- Transit-time range rather than a single average
- Minimum inventory and maximum safe onsite storage
- Substitute specifications and qualification lead time
This reveals correlated risks. Two suppliers may appear independent but use the same rail interchange, pipeline, port, or chemical precursor. A nominal backup does not provide resilience when it shares the same failure point.
Treat rail and storage as production capacity
Bulk fertilizer economics often favor rail, but rail capacity is not simply available because tracks reach the plant. The operating plan must account for car type, fleet ownership, empty-car positioning, switching windows, train size, siding length, loading rates, interchange performance, and cycle-time variability.
Past disruptions show why. Fertilizer shippers told regulators that weak rail cycle times reduced the volume they could move in a fixed period and placed pressure on domestic plants with limited onsite storage, FreightWaves reported. That relationship is direct: if outbound cars do not turn, storage fills; if storage fills, production slows even when labor, raw materials, and equipment are available.
Each new project should therefore model effective throughput under normal, stressed, and severe rail-cycle assumptions. The same exercise applies to trucks. Planners need to know whether enough food- and agriculture-compatible equipment, qualified drivers, loading appointments, and legal payload capacity exist during peak weeks.
Storage should be modeled as a connected network rather than a plant-level number. Include factory silos, rail-served terminals, distributor warehouses, dealer facilities, and temporary forward positions. For each node, capture usable capacity by product, handling rate, compatibility restrictions, dwell targets, and the customer territory it can serve.
Build the outbound map backward from application season
Agricultural demand is both regional and time sensitive. Planting season drives fertilizer and seed shipments, a pattern highlighted in FreightWaves' analysis of agricultural freight. Weather can compress application into an even shorter interval, turning a manageable annual volume into an intense weekly surge.
The outbound plan should begin with customer-required dates by county or sales territory, then work backward through dealer receipt, terminal transfer, line-haul transportation, plant loading, production, and inbound supply. This produces a time-phased capacity requirement rather than an annual forecast that hides the peak.
Segment demand by crop, product formulation, package type, and delivery method. Bulk urea moving by rail to a regional terminal has a different constraint profile from bagged specialty fertilizer moving by truck. The map must preserve those distinctions.
Forward positioning can protect service, but it should follow explicit rules. Inventory placed too early consumes working capital and storage; inventory placed too late competes for transport during the surge. Set target arrival windows using forecast confidence, weather sensitivity, terminal capacity, and replenishment lead time.
Define readiness milestones before volume ramps
Capital-project milestones typically focus on engineering, construction, and commissioning. Logistics readiness needs equal visibility. A plant that passes a production test but lacks qualified inbound sources, railcars, or terminal agreements is not commercially ready.
Use stage gates across four areas:
- Supplier readiness: Specifications approved, contracts signed, alternates qualified, and trial loads received.
- Transport readiness: Rail and truck capacity contracted, routes tested, equipment positioned, loading procedures validated, and disruption playbooks assigned.
- Storage readiness: Plant and regional nodes commissioned, product compatibility confirmed, and peak inventory plans tested against physical limits.
- Customer allocation: Demand prioritized by region and service commitment, with rules for shortages, substitutions, and weather-driven changes.
Each milestone should have an accountable owner, evidence requirement, due date, and escalation threshold. Useful measures include inbound on-time performance, railcar cycle time, storage utilization, loading throughput, forecast error, days of supply by region, and order fill rate.
Run scenario tests before full production. What happens if a key mineral is seven days late, rail cycle time rises 30%, or spring demand moves forward two weeks? The answer should identify affected orders, alternate routes, available inventory, and the person authorized to reallocate product.
Turn new capacity into reliable farm supply
More domestic fertilizer production can broaden supplier choice and shorten exposure to distant sources, but manufacturing investment alone does not guarantee availability. The value reaches farmers only when inbound materials, plant output, transport, storage, and seasonal demand operate as one system.
CXTMS gives logistics teams a shared operating view of orders, routes, capacity, milestones, and exceptions across that system. Request a CXTMS demo to see how transportation planning and execution can support a resilient fertilizer distribution network.