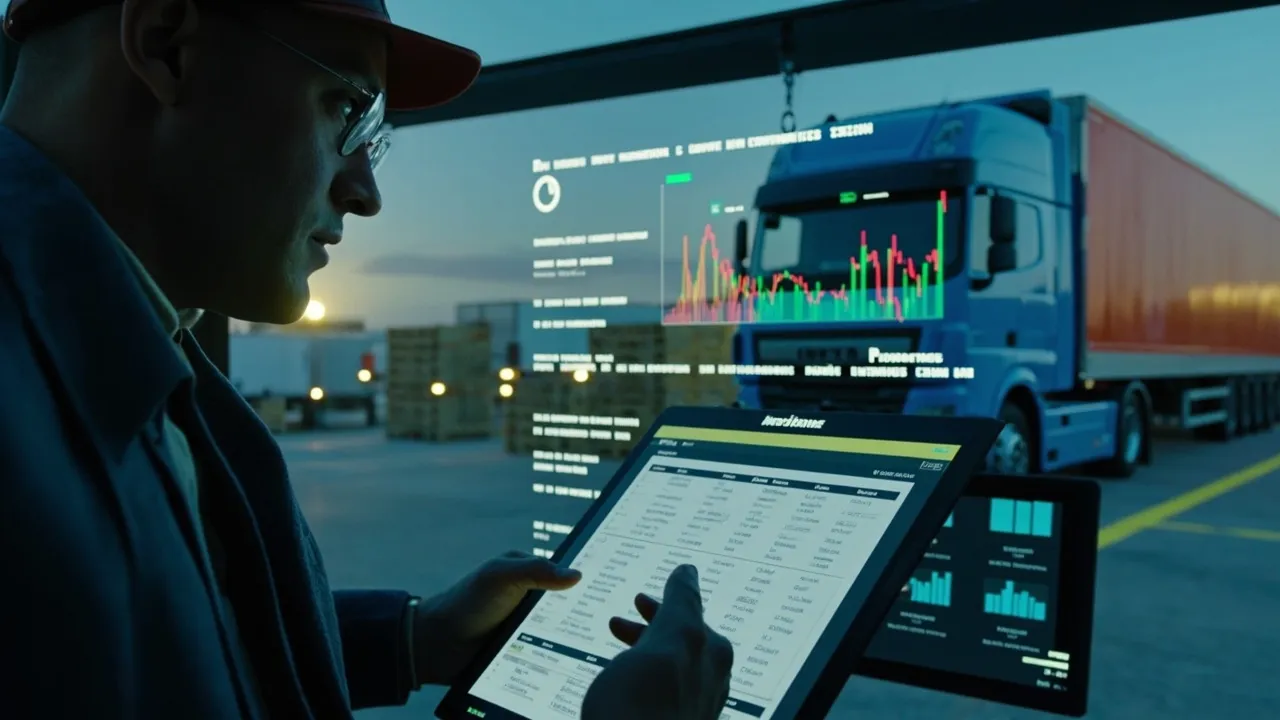
Food Manufacturers Bought Technology but Missed Productivity: Measure the Constraint, Not the Install

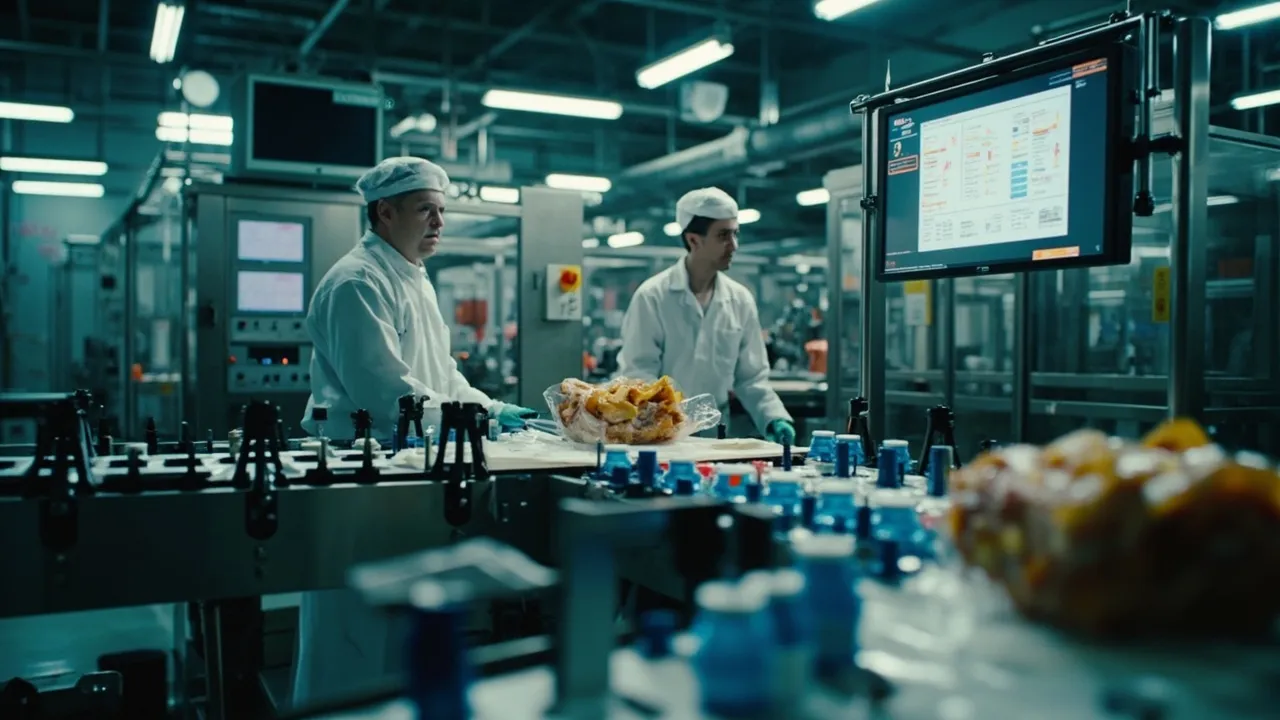
Food manufacturers have invested in automation, software, sensors, and connected equipment, yet many plants still cannot show a durable productivity gain. The problem is rarely a complete absence of useful technology. It is the way projects are defined and accepted: equipment is installed, training is completed, and the project is declared successful before the plant proves that its limiting operation can produce more saleable output.
That distinction matters because the largest losses may sit outside the maintenance ledger. Food Logistics reports that 90% of the impact associated with poor productivity comes from indirect costs such as lost sales, reduced shelf presence, excess inventory, and manufacturing inefficiency. A machine can meet its technical specification while the business still misses customer orders.
The answer is to measure the constraint—not the installation.
An installed asset is not a productivity result
Traditional project milestones are necessary but incomplete. Delivery, mechanical completion, system integration, and operator training confirm that an asset exists and can run. They do not confirm that the line produces more good units per hour, with the right product mix and without shifting congestion downstream.
Consider a faster filler installed upstream of packaging. Its dashboard may show higher instantaneous speed, but total plant output will not rise if the case packer, inspection station, cold-storage door, or outbound appointment schedule is already saturated. The investment may instead create work-in-process, extra handling, longer dwell time, and more product at risk of expiry.
There is real upside when automation is aimed at the limiting work. In a manufacturing case described by McKinsey, a new system increased volume per employee by more than 70% in processing and by almost 280% in filling and packaging. Those figures describe operating outcomes, not a count of deployed devices. They also show why the metric must be tied to the process being changed.
Establish the baseline before selecting the technology
A credible business case begins with several weeks of shift-level data before installation. Measure the system under the same demand, product-mix, sanitation, and staffing conditions that will apply after launch. At minimum, capture:
- Saleable throughput: good cases, pounds, or units released per scheduled hour.
- Constraint utilization: productive time at the limiting operation, separated from starvation, blockage, faults, sanitation, and planned stops.
- Changeover performance: elapsed time from the last good unit of one run to the first good unit of the next.
- Labor productivity: good output per paid hour, including indirect labor required to feed, clear, inspect, and rework the line.
- Yield and waste: first-pass yield, giveaway, scrap, rework, and quality holds by product family.
- Service performance: orders shipped complete and on time, shortages, expedites, and substitutions.
Avoid a single plantwide average. Averages conceal the shifts, recipes, package formats, and order profiles that create the loss. Record performance by line, SKU family, crew, and reason code. The baseline should expose which condition truly limits output and how often that constraint moves.
Turn the constraint into an acceptance test
Before approving a purchase order, convert the expected benefit into testable requirements. “Automation installed” is not an acceptance criterion. “The line sustains 185 good cases per hour for four consecutive hours across the three highest-volume formats, with less than 1.5% scrap and no additional labor” is.
Use a staged acceptance process:
- Factory test: verify safe operation, controls, speeds, recipes, alarms, and data capture before shipment.
- Site test: prove interfaces with existing conveyors, quality systems, utilities, and upstream and downstream equipment.
- Constraint test: run representative products long enough to reveal starvation, blocking, minor stops, and accumulating work-in-process.
- Business test: confirm that additional good output becomes shipped orders rather than excess stock, quality holds, or congestion in storage.
Include peak conditions, not only an easy demonstration SKU. Food plants must also test allergen transitions, sanitation cycles, label changes, temperature controls, traceability, and restart behavior after faults. A solution that performs only during a vendor-supervised trial has not passed operational acceptance.
Measure the whole flow from production to customer
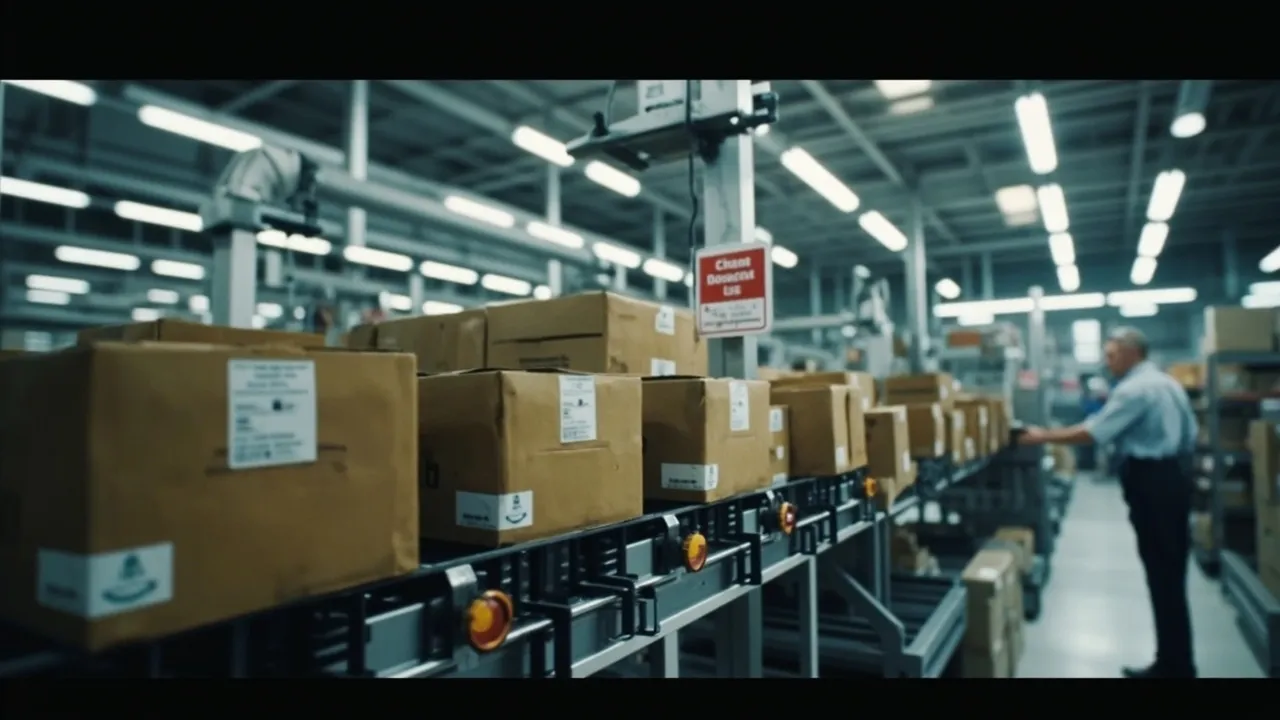
Manufacturing productivity cannot stop at the end of the line. Added output creates value only when warehousing and transportation can absorb it. If pallets wait for putaway, refrigerated space fills, or carrier appointments are unavailable, the constraint has merely moved.
Connect the production record to inventory and shipment events. For each run, track the time from release to staging, loading, departure, and customer delivery. Monitor dock-to-stock time, trailer dwell, storage occupancy, order cycle time, detention, and expedited freight alongside line throughput. This creates a shared measure of flow instead of separate “green” dashboards for production, warehousing, and transportation.
Interest in new machinery remains strong. Modern Materials Handling reported that approximately 70% of visitors engaging with one exhibitor at PACK EXPO International 2026 were new contacts, many bringing active projects. That pipeline is encouraging, but every project should begin with a named constraint, a measured baseline, and an operating result that the investment must deliver.
Govern benefits after the vendor leaves
Run a benefits review at 30, 60, and 90 days after handover. Compare performance with the pre-install baseline using equivalent products and schedules. Assign one owner to each gap and preserve the event-level data needed to diagnose it. If throughput improves but waste, overtime, or freight premiums rise, report the net effect rather than celebrating one favorable measure.
The best automation scorecard is compact: constraint throughput, good output per labor hour, first-pass yield, changeover time, service level, and cost per shipped case. It tells leaders whether the plant converted technology into customer value—and where the next limiting condition has appeared.
CXTMS connects production-ready freight, inventory milestones, carrier capacity, and delivery execution so manufacturers can see whether added plant output becomes reliable customer service. Request a CXTMS demo to build a transportation workflow around the constraints that actually govern flow.