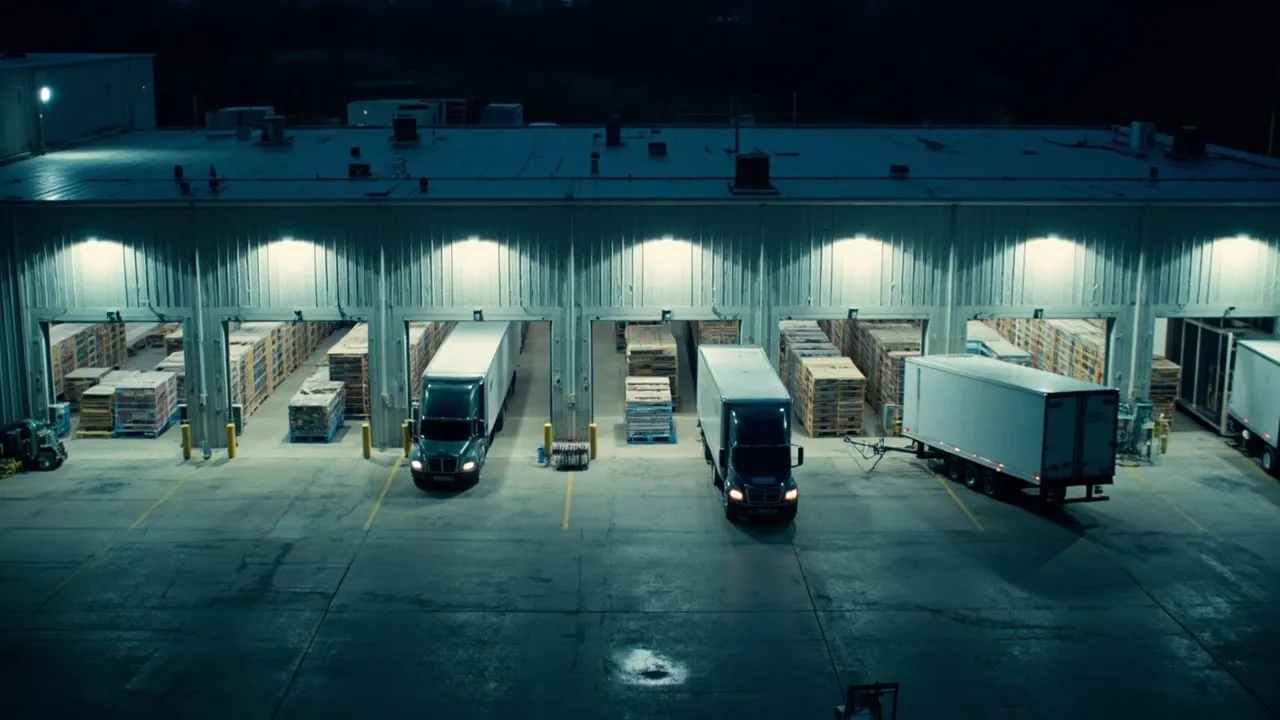
Falling Warehouse Vacancies Change the 2027 Capacity-Buying Window


The national warehouse market is no longer sending the same “wait and see” signal it sent during the recent supply wave. Demand is absorbing space faster, vacancies have started to retreat, and the development pipeline has already been constrained by the pullback in speculative construction. For companies planning 2027 capacity, that combination changes the buying window.
It does not mean every shipper should sign a long lease immediately. It means real estate can no longer be treated as a decision that begins after the sales forecast is final. Logistics teams need trigger dates, market-level capacity signals, and fallback options before the buildings that actually fit their operations disappear.
The national numbers mark a turning point
Logistics Management reports that U.S. industrial net absorption reached 76.6 million square feet in the third quarter, the strongest quarterly result since the first quarter of 2023. It was also the second consecutive quarter above 70 million square feet, lifting year-to-date absorption beyond 203 million square feet.
At the same time, the national industrial vacancy rate fell to 6.8%, down 20 basis points from its late-2025 peak and its lowest level since the end of 2024. Approximately 64 million square feet was completed during the quarter, while year-to-date completions reached about 324 million square feet.
The direction matters more than any single number. Developers reduced speculative starts when the market softened, and the under-construction pipeline remained below 270 million square feet throughout 2025. The resulting slowdown is now reaching completion schedules just as occupancy gains strengthen. If demand continues to outrun new supply, the apparent cushion in national vacancy can narrow quickly.
Leasing activity reinforces that warning. Third-quarter leasing exceeded 200 million square feet for a second consecutive quarter, while roughly 810 million square feet of new leases were completed nationally over the last four quarters. Third-party logistics providers accounted for 30% of 2026 leasing volume, manufacturers represented 26%, and data-center-related users accounted for about 10%. Those users do not compete for identical buildings, but they do compete for land, labor, power, contractors, and transport access in many of the same markets.
National vacancy is not usable capacity
A 6.8% vacancy rate does not mean a shipper has a 6.8% selection of operationally viable space. Some vacancies are in the wrong submarket, lack sufficient dock positions, have unsuitable clear heights or column spacing, or cannot support refrigeration, automation, charging infrastructure, or heavy power demand. Others may add too many miles to inbound or outbound routes.
This is why a capacity plan must move from national headlines to a building-level filter. Inbound Logistics describes site selection as a balance among real estate, labor, and transportation costs. That balance should be measured with operating data, not rent alone.
For each target market, planners should define minimum requirements for usable square footage, yard depth, trailer parking, dock-door count, clear height, floor load, power availability, fire protection, zoning, and expansion potential. They should then add labor availability by shift, wage pressure, parcel and LTL coverage, drayage access, highway reliability, and distance to customers and suppliers.
The resulting “qualified vacancy” rate will usually be much lower than the published market rate. That is the capacity figure that belongs in a 2027 network plan.
Match the commitment to the demand scenario
Capacity buyers have four practical options, each suited to a different level of demand confidence.
A direct lease offers the most operational control and can support automation or specialized infrastructure. It also creates the longest commitment and the greatest exposure if demand shifts. Use it when the location is strategically durable, baseline volume is well supported, and the building requirements are difficult to source on short notice.
Dedicated overflow through a 3PL converts some fixed exposure into a contracted service. It can accelerate startup, but the shipper should verify labor, systems integration, peak throughput, dock allocation, inventory accuracy, and the provider’s rights to substitute facilities.
Shared-user warehousing is useful when volume is seasonal or still developing. The tradeoff is less control over labor priority, cut-off times, layouts, and surge capacity. Service-level agreements should specify throughput and storage entitlements during the exact weeks when multiple customers peak.
Short-term storage can bridge a launch, promotion, inventory build, or network transition. It should not become an accidental long-term node. Additional handling, shuttle moves, split inventory, and weak systems connectivity can erase the apparent rent advantage.
A robust plan can combine these options: secure core capacity with a lease or dedicated operation, reserve a defined flex band with a 3PL, and prequalify temporary sites for exceptional demand.
Set trigger dates before the forecast becomes certain
Waiting for certainty is risky because site search, negotiation, permitting, fit-out, systems integration, hiring, and inventory transfer all consume time. Capacity should therefore be governed by dated triggers rather than a single approval meeting.
Start with the required operational date and work backward. A typical trigger framework should include:
- T-minus 15 to 18 months: validate demand scenarios, network geography, building specifications, and qualified-market availability.
- T-minus 12 months: launch the site search when base-case utilization is projected above 85% or qualified vacancy falls below the company’s threshold.
- T-minus 9 months: select the preferred commitment model and negotiate both primary and fallback capacity.
- T-minus 6 months: finalize integration, labor, carrier, and inventory-transfer plans.
- T-minus 3 months: test receiving, fulfillment, exception handling, and peak-day throughput before moving critical volume.
Each checkpoint should also watch external signals: quarterly absorption, new leasing, sublease additions, construction starts, rent movement, and large transactions in the target submarket. Internally, forecast error, storage utilization, dwell time, overflow spend, missed cut-offs, and miles per order reveal when the current network is running out of economically usable room.
Turn the real-estate decision into an operating plan
The best capacity decision is not necessarily the building with the lowest rent. It is the option that protects service at an acceptable total cost under several plausible demand scenarios. That requires combining facility commitments with shipment volumes, customer promises, inventory positioning, carrier capacity, labor constraints, and implementation milestones.
CXTMS gives logistics teams a shared operational record for that work. Planners can compare lane and order data across candidate nodes, model the transport effect of a new site, monitor utilization and dwell, and coordinate inbound and outbound capacity as activation dates approach. Alerts can surface when actual volume crosses a trigger or when a fallback facility must be brought online.
Falling vacancy is an early signal, not a reason to panic-buy space. The right response is to define qualified capacity now, match commitments to demand confidence, and attach decisions to dates. Request a CXTMS demo to see how one transportation control layer can connect warehouse-capacity planning with the freight flows that determine whether a location really works.