NAPA Auto Parts' Automation Push Needs a Store-Fill-Rate Proof Test

NAPA Auto Parts is adding another layer of warehouse automation, but the decisive result will not be how many bins a robot moves. It will be whether a technician can get the correct alternator, sensor, or brake component from the local store when a vehicle is waiting in a service bay.
That distinction matters in the automotive aftermarket. A distribution center can report higher pick rates while stores still experience backorders, substitutions, late replenishment, and costly emergency transfers. Automation must therefore pass a store-fill-rate proof test: did the investment improve parts availability at the time and location of demand?
A large network makes local availability the real objective
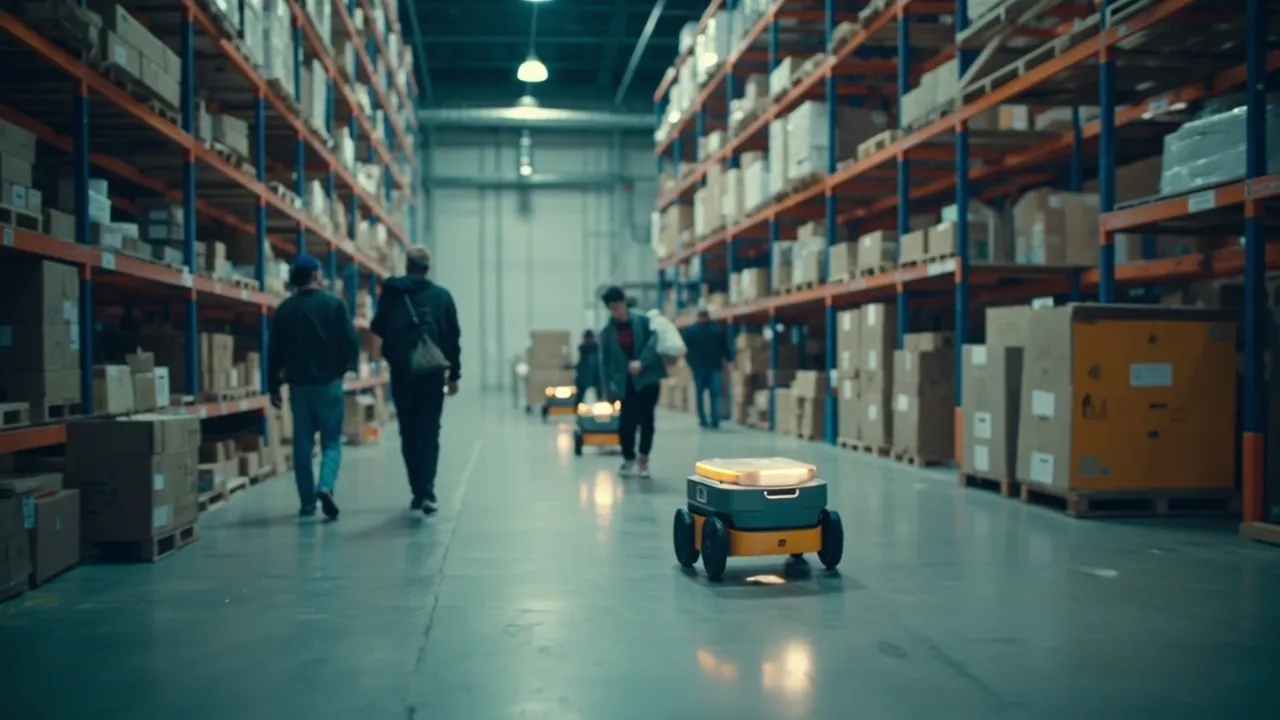
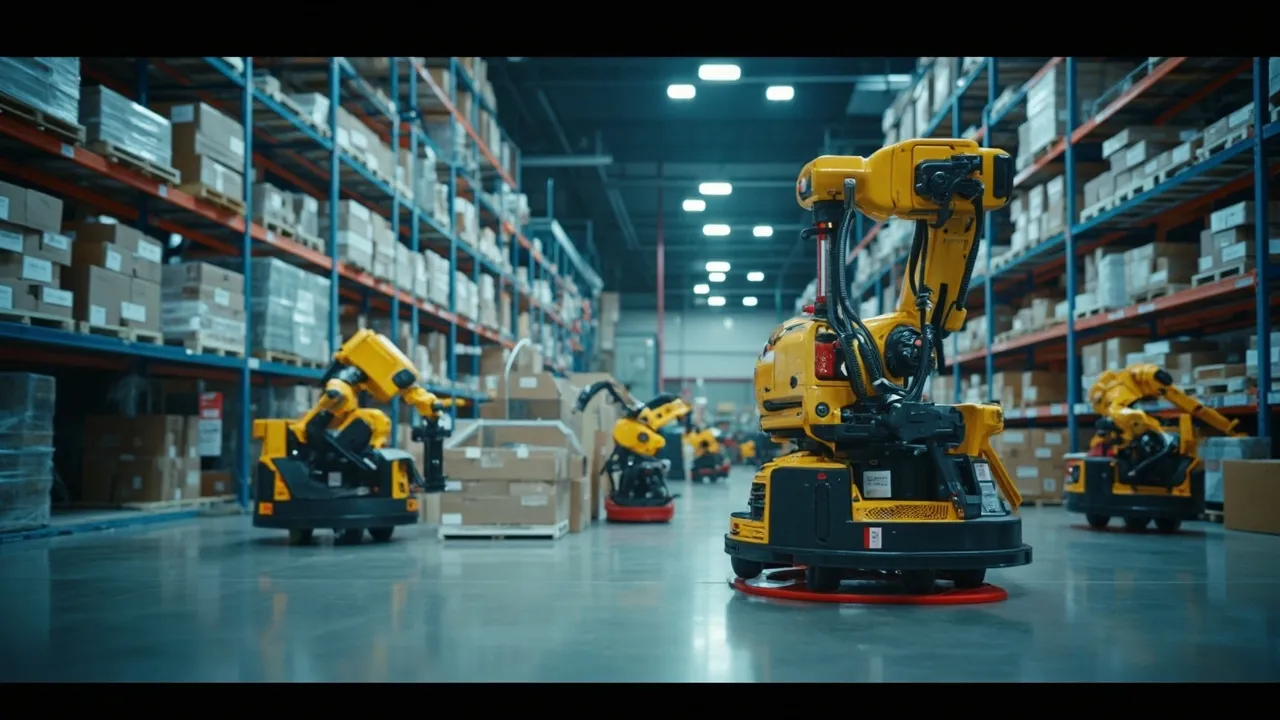
NAPA's automation program is substantial. Supply Chain Dive reported in March that the retailer planned to deploy more than 100 AI-powered mobile robots at an additional site after a 2025 pilot. The same report put the network at 6,000 U.S. parts stores, more than 16,000 auto care and collision centers, and approximately 800,000 parts, accessories, and supplies carried by its distribution centers.
In October, Supply Chain Dive reported a separate partnership with Hy-Tek Intralogistics and Hai Robotics. The planned goods-to-person system is intended to raise storage density, accuracy, throughput, and fulfillment speed. NAPA evaluated the technology in a live warehouse environment before deployment, an important step for validating performance under realistic operating conditions.
Those facts describe the size and ambition of the project. They do not yet prove the retail outcome. With hundreds of thousands of SKUs and thousands of demand points, a faster automated zone can still feed a poorly synchronized replenishment process.
Establish the baseline before robots change the workflow
The proof test starts with a frozen pre-deployment baseline. Each facility should record order cycle time, lines picked per labor hour, mispicks, backordered lines, short shipments, and emergency store-to-store or DC-to-store transfers. Results should be segmented by store, route, day, shift, and SKU velocity.
That segmentation prevents averages from hiding service failures. An automation project may produce a large gain on fast-moving filters and wiper blades while reducing responsiveness for slow-moving electronic modules or vehicle-specific components. Both outcomes matter, but only the second may determine whether a repair is completed today.
A useful scorecard should track at least five measures:
- First-pass store fill rate: the percentage of requested lines shipped completely on the original replenishment order.
- Order cycle time: elapsed time from released store order to carrier-ready shipment.
- Accuracy: correct SKU and quantity delivered, not merely the number of robot transactions completed.
- Backorder recovery: time required to source and deliver a line missed on the first pass.
- Emergency transfer rate: urgent movements needed to repair normal replenishment failures.
The first and fifth measures belong together. A falling transfer rate alongside a rising fill rate is strong evidence that automation is improving the network rather than shifting work and cost elsewhere.
SKU proliferation is the harder automation test
Automotive parts distribution has an unusually long tail. Similar-looking products may differ by model year, trim, engine, connector, or calibration. Demand can be sparse at individual stores even when the network carries deep assortment overall. High-density storage can help, but slotting logic and inventory accuracy must keep pace with SKU proliferation.
Operators should compare automation economics across velocity bands. Fast movers typically generate enough touches to justify automated handling quickly. Medium movers may benefit from density and reduced walking. Slow movers require a different calculation: the value may come from accurate location control and rapid exception retrieval rather than headline lines per hour.
The business case should therefore allocate capital and operating cost by SKU cohort. It should also count exception labor, replenishment into the automated system, manual handling for non-conveyable products, maintenance downtime, and inventory quarantined after discrepancies. If these activities sit outside the automation dashboard, the apparent productivity gain will be overstated.
Connect DC waves to carrier cutoffs
Store service depends on more than the pick module. A completed tote that misses its route departure has delivered no same-day benefit. NAPA should connect warehouse wave planning to carrier cutoffs and store receiving windows, then measure the percentage of orders that clear each control point on time.
The operational chain is straightforward: store order deadline, inventory allocation, wave release, pick completion, consolidation, dock staging, trailer departure, and store receipt. Every event needs a timestamp and an exception code. That data reveals whether a service miss began with inventory availability, automation congestion, manual packing, dock capacity, or transportation.
This is also where disconnected systems create avoidable ambiguity. Warehouse, order, inventory, and transportation data should share the same order and shipment identifiers. Otherwise, teams can see that a store was short but cannot determine which process caused the shortage. A unified event record lets managers separate robotics performance from the rest of the fulfillment network.
Run the proof test as a controlled comparison
For the first 90 days, NAPA should compare automated and conventionally served flows with similar SKU mix and store demand. Weekly reviews should show median and 95th-percentile cycle time, not just averages. A few severely late orders can have an outsized effect on repair shops even when the mean improves.
The rollout earns expansion when store fill rate rises, order accuracy improves, cutoff misses decline, and emergency transfers fall without a disproportionate increase in inventory. Throughput remains valuable, but it is an input to customer service—not the final verdict.
For other aftermarket distributors, the lesson is clear: define the store-level service outcome before commissioning the machinery. CXTMS can connect orders, warehouse milestones, carrier cutoffs, and delivery exceptions in one operational view. Request a CXTMS demo to build a fulfillment scorecard that follows every parts order from allocation through store receipt.