Narrow-Aisle Forklift Safety Data Should Become a Warehouse Event Stream

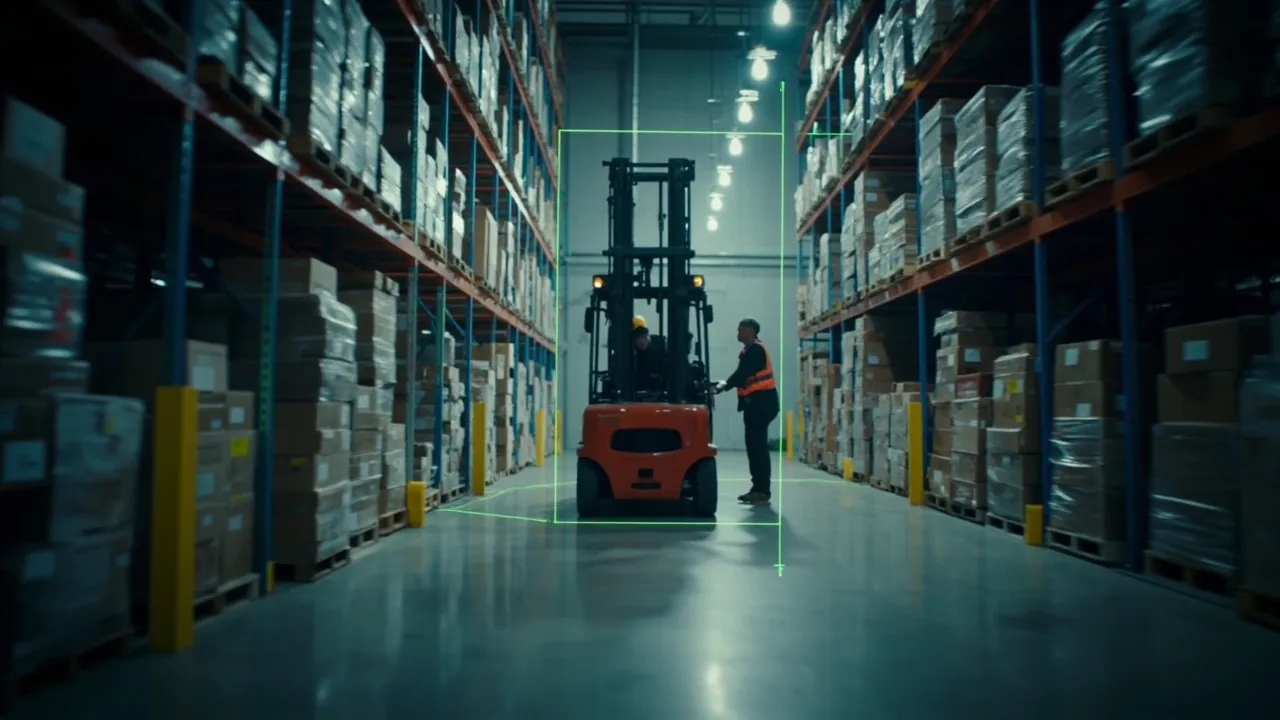
A forklift safety system that automatically slows or stops a truck can prevent an immediate hazard. Its longer-term value, however, depends on what the warehouse does with every detection, warning, speed reduction, and intervention after the moment has passed.
That distinction matters in narrow aisles, where high racks, restricted sightlines, pedestrians, and little maneuvering room leave operators with less margin for error. If sensor signals disappear inside the vehicle, managers learn only that the protection worked. If those signals become a structured event stream, the warehouse can learn why the same risk keeps appearing.
The goal is not more alarms. It is better operational evidence.
Amazon's deployment shows what the sensors can see
Modern Materials Handling reports that Amazon Germany is deploying a mobile personnel-protection system on roughly 50 Toyota high-rack forklifts. The first units have already been equipped.
Designed for narrow-aisle warehouses, the system uses laser scanning and sensors to monitor the full aisle in all directions. It identifies people and vehicles, automatically brakes or slows the forklift, monitors speed, and manages travel permissions. Protective fields and safety distances adjust dynamically according to the truck's speed and location.
Those capabilities create far richer data than a conventional impact counter. Each intervention can describe a sequence: the vehicle entered a zone, a person or object appeared within a protective field, the system issued a warning or reduced speed, and the conflict cleared. Location, direction, velocity, time, and intervention severity can turn that sequence into an operational event.
The technology also sits within a wider safety context. A separate MMH review of lift-truck sensors cited 70 lift-truck-related work deaths in the United States during 2021 and an OSHA estimate that about 70% of forklift incidents could be avoided through proper training and policy. The same review noted that dynamic detection zones can extend as far as 32 feet depending on speed and steering direction.
Sensors support training; they do not replace it. Their event data can make training and policy more specific.
Convert interventions into a common event model
A useful event record should capture more than "alarm at 10:42." At minimum, it should contain:
- truck and anonymized operator identifiers;
- timestamp, aisle, zone, and travel direction;
- truck speed, load state, lift height, and steering angle where available;
- detection type, such as pedestrian, vehicle, pallet, or fixed obstruction;
- protective-field level and distance at first detection;
- warning, slowdown, braking, or travel-permission response;
- duration until the path cleared; and
- the related task, pick, replenishment, or putaway movement.
Warehouses should normalize these fields across vehicle models before sending events to a warehouse management, telematics, or analytics platform. A shared schema lets managers compare similar risks instead of maintaining separate dashboards for each equipment brand.
Event severity also needs a clear hierarchy. A detection that cleared without intervention is different from an automatic stop at close range. Both matter, but they should not carry equal weight. Severity bands can combine proximity, closing speed, intervention type, and recurrence at the same location.
Connect safety events to warehouse conditions
An intervention is rarely explained by the forklift alone. Join the event stream to warehouse context and patterns become actionable.
If repeated slowdowns occur at one aisle end during shift changes, the cause may be pedestrian routing or congestion. If events cluster around a high-velocity SKU, replenishment timing or slotting may be forcing too many movements into the same space. A surge after a layout change may point to a new blind corner. Increasing braking interventions on one truck under similar conditions may justify a sensor inspection, tire check, or brake-service review.
This is the integration case for connected telematics. MMH's analysis of next-level lift-truck telematics explains that APIs can combine truck data with WMS, labor, training, and real-time location data. The article describes location accuracy of approximately plus or minus 3 feet for one RTLS implementation and shows how location and telematics can distinguish a training problem from a layout or workflow problem.
The most useful joins include:
- WMS tasks, to identify the work underway;
- slotting data, to find SKUs generating conflicting travel;
- labor schedules, to compare shifts and experience levels;
- maintenance history, to detect vehicle-specific drift;
- congestion measures, to quantify simultaneous aisle activity; and
- layout versions, to evaluate risk before and after a change.
Measure leading indicators without punishing reporting
Recordable injuries and damage are essential measures, but they are lagging indicators. A warehouse should also track interventions per 100 operating hours, high-severity events per 1,000 travel movements, recurring hotspots, average clearance time, speeding events, and the ratio of warnings to automatic stops.
Normalize the numbers by exposure. A busy receiving zone will naturally create more detections than a lightly used reserve aisle. Comparing raw totals can misdirect attention and unfairly label operators or shifts. Rates based on travel distance, operating time, tasks completed, or pedestrian exposure create a more credible comparison.
Management behavior is equally important. If operators believe sensor events will automatically trigger discipline, they may avoid reporting hazards, resist the technology, or find ways around it. Use aggregated data first to improve layout, traffic rules, maintenance, and coaching. Reserve individual review for serious or repeated deviations, and provide a transparent process for adding context to an event.
Avoid rewarding a simple decline in alerts. Fewer events could mean safer work, but it could also mean disabled sensors, unreported pedestrian activity, or changed thresholds. Pair the metric with sensor uptime, inspection completion, employee hazard reports, and spot audits.
Turn protection into continuous improvement
Start with a four- to six-week baseline. Map events by aisle and hour, review the highest-severity clusters weekly, and assign each cluster to an owner in safety, operations, facilities, or maintenance. After a change—reslotting inventory, altering a pedestrian route, adjusting a shift handoff, or servicing a truck—compare exposure-adjusted event rates with the baseline.
That feedback loop converts an automatic brake application from an isolated save into evidence that can prevent the next conflict. It also gives leadership a defensible way to prioritize capital and process changes around measured risk rather than anecdotes.
CXTMS helps logistics teams connect operational events, tasks, assets, and exceptions in one workflow. Request a CXTMS demo to see how connected event data can support safer, more measurable warehouse and transportation operations.