Terminal Technology Debt Is a Throughput Risk, Not an IT Backlog

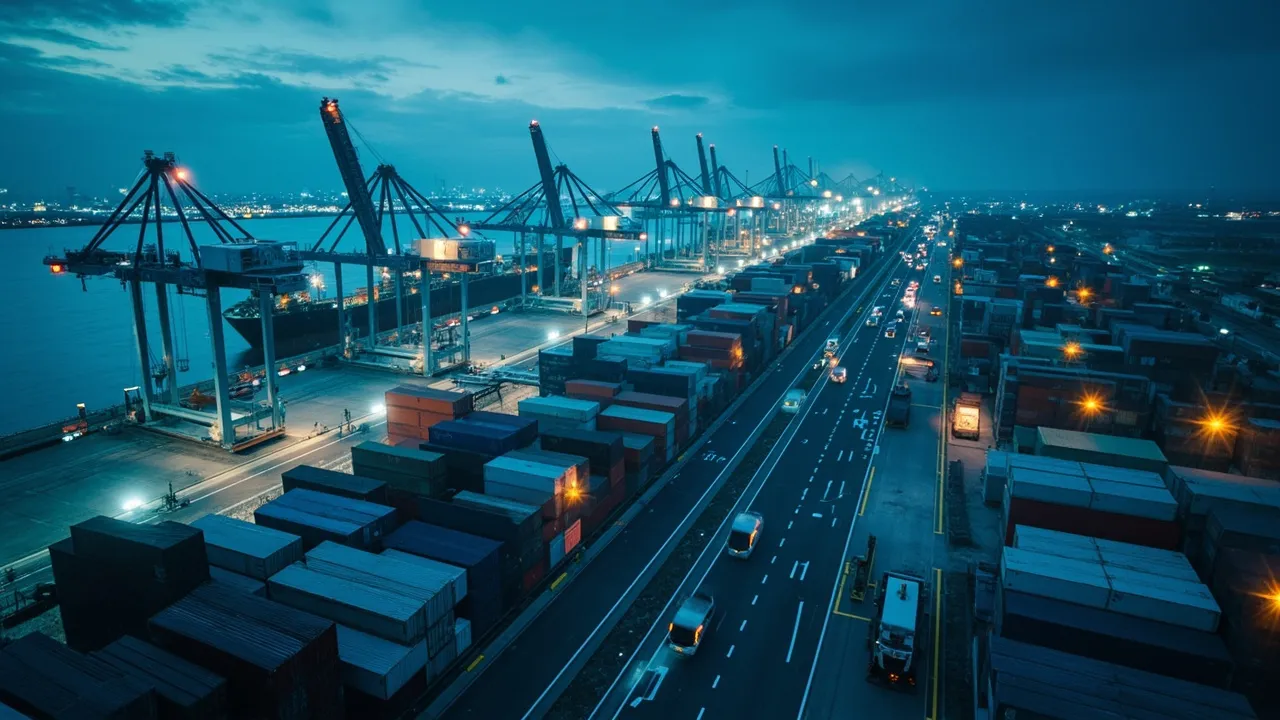
Technology debt at a marine terminal does not stay inside the IT department. It appears at the berth when planners cannot revise a stow plan quickly, in the yard when container locations lag reality, and at the gate when drivers wait for clerks to reconcile mismatched records. Each workaround may look manageable. Together, they put a ceiling on throughput and make service less predictable for every shipper using the facility.
That distinction matters because an IT backlog is usually prioritized by system age, maintenance cost, or vendor support. Throughput risk should be prioritized by its effect on cargo flow. A decade-old interface that reliably handles a low-volume message may be less urgent than a newer spreadsheet handoff that delays release status for hundreds of containers every morning.
Inaction accumulates as operational friction
Supply Chain Brain describes the cost of delayed modernization as a slow drift rather than a single failure: gate queues lengthen, billing disputes take longer, non-revenue housekeeping moves consume yard capacity, and employees spend more time reconciling information manually. Because no individual delay looks catastrophic, the operation gradually accepts lower performance as normal.
At a terminal, one stale integration can propagate across several physical processes. A late vessel-plan update can send equipment to the wrong block. An inaccurate yard position can trigger an extra rehandle. A customs or freight-release message that requires manual review can cause a missed truck appointment. A gate transaction that does not immediately update the system of record can distort chassis and container availability for the next user.
The financial consequences then move beyond the terminal. Importers absorb storage and demurrage, carriers lose productive driver hours, warehouses miss receiving windows, and exporters risk rolled bookings or missed connections. Technology debt is therefore not just the cost of maintaining old software. It is the recurring cost of uncertainty in every handoff between vessel, yard, rail, truck, warehouse, and customer.
Rising volume exposes hidden constraints
Volume is a useful stress test. FreightWaves reported that the Port of New York and New Jersey moved 503,016 loaded TEUs in June 2026, 7.6% more than a year earlier. Total volume reached 769,422 TEUs, an 11.9% increase. First-half throughput was 4,427,159 TEUs, roughly even with the prior year.
Those figures illustrate why annual averages can conceal operating risk. Even if six-month volume is flat, an 11.9% monthly increase can concentrate work into particular vessel calls, yard blocks, shifts, and gate windows. A process supported by manual reconciliation may function during an average week and fail during a compressed import surge.
Headline TEUs also do not reveal whether cargo moved smoothly. A container can be counted as discharged while it remains unavailable for pickup, buried under other boxes, held by mismatched documentation, or disconnected from a rail departure. Shippers should evaluate the velocity between custody events, not assume high port volume equals reliable cargo flow.
Convert technology debt into measurable flow loss
The modernization case becomes stronger when each system limitation is linked to an operational constraint. Start with the event where flow breaks down, then trace the data and decision path behind it.
For vessel operations, measure berth productivity, crane moves per hour, start delays, plan revisions, and vessel turnaround. For the yard, track average dwell, long-dwell inventory, rehandles per container, unproductive equipment travel, and the percentage of boxes whose recorded position differs from the physical position. At the gate, measure truck turn time, appointment adherence, transaction exceptions, queue length, and manual interventions.
Rail and intermodal connections need their own view: time from discharge to rail availability, missed cutoffs, grounded containers, and transfers requiring extra moves. Labor measures should include minutes spent searching, rekeying data, resolving duplicate records, or calling another party for status. These tasks are often hidden inside payroll even though they directly limit capacity.
Finally, connect terminal events to shipper outcomes: free-time consumed before availability, demurrage exposure, missed delivery appointments, late purchase orders, detention, and premium recovery transport. This turns a vague request to “replace the legacy system” into a quantified proposal to remove a specific throughput constraint.
Modernize the bottleneck, not the feature list
A large vendor checklist encourages organizations to buy breadth before proving operational value. A better sequence ranks constraints by frequency, cargo impact, financial exposure, and recoverability.
First, stabilize the system of record and critical integrations. Vessel, customs, carrier, rail, appointment, gate, and billing events need consistent identifiers, timestamps, and exception ownership. If teams cannot trust container status, adding predictive tools will only automate decisions on unreliable data.
Second, target the constraint with the largest flow effect. That may mean mobile yard confirmation, automated gate identification, appointment controls, planning optimization, or event APIs. Pilot the change in one bounded process, lane, block, or customer segment. Preserve rollback procedures and dual-run only long enough to verify accuracy; permanent parallel spreadsheets simply create new technology debt.
Third, design exception handling before cutover. Modernization does not eliminate bad messages, damaged equipment, customs holds, or late vessels. It should expose them earlier, route them to a named owner, and record the resolution without phone calls becoming the unofficial system of record.
Prove reliability before and after cutover
Establish at least four weeks of baseline performance, covering both ordinary operations and a representative peak if possible. Use the same event definitions after launch so improvements cannot be manufactured by changing the clock. Compare medians and upper percentiles; an unchanged average can hide a meaningful reduction in the worst delays.
A practical scorecard should include vessel turnaround, yard dwell, rehandles, truck turn time, manual touches, message latency, system availability, missed rail or vessel connections, and shipper accessorial cost. Add adoption measures such as mobile confirmation compliance and exceptions resolved within target time. Review results at 30, 60, and 90 days, with responsibility shared by operations, IT, labor, finance, and customer service.
For shippers, terminal reliability belongs in routing and procurement decisions. Capture actual availability, pickup, gate, and delivery timestamps in the transportation management system. Compare gateways and terminals by end-to-end release time and variability, not only ocean rate or published transit time. When dwell or missed connections breach a threshold, the TMS should alert the team early enough to change appointments, secure free-time extensions, or reroute downstream capacity.
Technology debt becomes dangerous when it is invisible. Once terminal friction is expressed as lost moves, added dwell, missed connections, and avoidable cost, modernization stops competing as an abstract IT project. It becomes what it always was: an investment in reliable cargo flow.
CXTMS connects terminal milestones, appointments, exceptions, freight costs, and downstream delivery commitments in one operational view. Request a CXTMS demo to identify where terminal variability is putting your shipments at risk.